
Automated Diabetes Diagnosis Using Machine Learning: A
Comprehensive Study
Zhiyuan Cao
College of Computer and Data Science/College of Software, Fuzhou University, Fuzhou, China
Keywords: Diabetes, Machine Learning, Data Analysis.
Abstract: Diabetes is a harmful illness that disturbed millions of patients around the globe. According to statistics, one
out of every ten adults is diagnosed with diabetes in the near future. So it’s essential to take measures to
prevent diabetes, but unfortunately, the current tools available for diagnosing this condition are not
sufficiently efficient. However, with the development of artificial intelligence, machine learning has been
introduced to human’s medical health system. In this study, a scientific test is conducted based on diabetes
dataset. Machine learning models is applied to the dataset respectively and model’s accuracies are measured.
The result shows that machine learning models perform well on diabetes dataset and GradientBoosting
performs better than other algorithms. This research consists of 4 parts, data analysis, data pre-processing,
model training and model evaluation. Initially, Exploratory Data Analysis (EDA) is shown to obtain an
extensive knowledge of the information at hand, enabling researchers to make informed decisions during
subsequent stages. Second, dataset is pre-processed for further research. Then, extensive model training is
conducted, utilizing machine learning algorithms customized to the diabetes domain and finally various
metrics are recorded to measure the effectiveness of the models.
1 INTRODUCTION
Diabetes is a long-term illness featuring elevated
blood sugar levels as a result of insulin manufacturing
malfunction (Gale and Gillespie 2001). It can have
several harmful effects on the body. According to the
International Diabetes Institution, the global adult
prevalence of diabetes has shown a rapid increase for
decades, making diabetes a global public health
concern (Roglic 2016). Therefore, developing
accurate and efficient diabetes prediction methods is
of great importance to early identification and
intervention.
Usually, to predict whether an individual catches
diabetes, some personal information such as age and
gender should be collected. Furthermore, medical
biochemical indicators such as insulin and blood
pressure should be examined for prediction, which
generates large volume of data. To analyze big data,
artificial method of data analysis is neither accurate
nor efficient. Aiming to process big data and sharpen
diabetes prediction, machine learning models are
introduced to solve the problem.
With the fast advancement of machine learning
techniques, more researchers have begun applying
these methods in the field of healthcare (Zou et al
2018). Machine learning technology applies
mathematical models and algorithms to automatically
identify and learn data patterns, greatly enhancing the
accuracy and efficiency of disease prediction. In this
research, 6 machine learning algorithms will be
applied to train and classify the diabetes dataset,
including DecisionTree, GradientBoosting, K-
NearestNeighbor (KNN), LogisticRegression,
RandomForest and Support Vector Machine (SVM).
The research process consists of 4 steps. Initially,
exploratory data analysis is intended for exploration of
the correlation of medical indicators and features of
the dataset. Then the author processes the data for
further research. Afterwards, machine models are built
respectively and grid search is applied to find the
optimal parameters for each model, which stimulates
model’s accuracy. Finally, this paper will introduce
effective metrics and methods for evaluating machine
learning models.
Machine learning models have significant
advantages in handling diabetes dataset. It’s flexible
enough to adapt to various types of datasets, including
numerical, categorical, textual, and image data. They
can handle nonlinear relationships, complex patterns,
Cao, Z.
Automated Diabetes Diagnosis Using Machine Learning: A Comprehensive Study.
DOI: 10.5220/0012800900003885
Paper published under CC license (CC BY-NC-ND 4.0)
In Proceedings of the 1st International Conference on Data Analysis and Machine Learning (DAML 2023), pages 137-141
ISBN: 978-989-758-705-4
Proceedings Copyright © 2024 by SCITEPRESS – Science and Technology Publications, Lda.
137

and high-dimensional data, allowing them to tackle a
wide range of complex problems. Also, it features
with strong ability of classification and generalization.
Machine learning methods can make predictions and
generalize patterns based on models learned from
training data. Once trained, these models can
accurately predict new input data. This capability
makes machine learning methods well-suited for
modeling and categorization assignments.
The remaining sections of the essay are structured
as follows. The review of prior studies on the diabetes
dataset is presented in section 2. Section 3 introduces
some details of machine learning models. Section 4
summarizes final results for model evaluation while
section 5 draws conclusions and describes the
application prospects of the research.
2 LITERATURE REVIEW
Some related work has done before on diabetes dataset,
which provides ideas and experience for the research.
They skillfully utilized traditional or improved
machine learning techniques to classify the data.
Y.Angeline and P.Sivaprakasam upgraded KNN to
CKNN which significantly reduced the classification
error (Christobel and Sivaprakasam 2013). Chitra
Jegan implemented SVM as the classifier for
diagnosis of diabetes (Kumari and Chitra 2013). To
explore critical information in diabetes dataset, data
mining is widely used in various domains. Saman
Hina, Anita Shaikh and Sohail Abul Satter applied
data mining to analyze the dataset (Hina et al 2017).
Furthermore, data mining detected the processing time,
accuracy and error of each machine learning algorithm
to evaluate its performance. Osisanwo F.Y. extracted
critical information about models from WEKA
(Osisanwo et al 2017). To improve models’ accuracy,
some processing methods were introduced to sharpen
its prediction. Mehrbakhsh Nilashi invented a system
with SOM, PCA and NN so that the model can be
intelligent enough for prediction (Nilashi et al 2017).
And its method made remarkable progress in accuracy
at 92.28%. Aishwarya Mujumdar and Dr. Vaidehi V
processed the dataset with pipeline, which organized
and managed multiple data transformations and model
training steps and simplified code structure and
management (Mujumdar and Vaidehi 2019).
Therefore, although classifiers have different
model structures, they still have something in common.
Different machine learning models should be
implemented and some special methods should be
adopted to improve the performance of the model. In
this research, data normalization and grid search are
applied to fit the model and tune parameters. And
some metrics need to be recorded to measure the
model’s effect.
3 PROPOSED METHOD
3.1 Model Building
3.1.1 DecisionTree
Machine learning decision tree is a classification
algorithm based on feature selection. It has a tree
structure resembling a flowchart, with each core node
standing for a feature and each node of the leaf for a
choice or result. It constructs a tree-like model by
repeatedly splitting the dataset into pure subsets using
the optimal splitting criteria at each decision node,
enabling fast and effective prediction. The splitting
process aims to minimize impurity within each
subset, resulting in better predictions. Decision Trees
are easy to interpret and visualize, allowing us to
understand the decision-making process. However,
they can overfit the training data. Decision Tree is
widely utilized in various domains, including finance,
healthcare, and marketing.
3.1.2 GradientBoosting
An approach for ensemble learning called gradient
boosting iteratively blends inadequate models to
produce a strong model. It works by continuously
constructing new models that minimize the errors of
the prior system. In each iteration, the algorithm
calculates the difference between the predicted value
and actual outcome known as the residual. The
subsequent model is then trained to predict these
residuals, effectively correcting the mistakes made by
the previous models. To arrive at the final projection,
the predictions from all the models are put together.
By optimizing the loss function in each iteration
through gradient descent, Gradient Boosting
continuously improves the model's performance. It is
used in various domains for it can handle complex
data and produce accurate predictions.
3.1.3 KNN
KNN algorithm stands for k-nearest neighbors. It is a
non-parametric classification or regression algorithm.
Each instance is represented by its neighbors' labels
or averaged values. For regression problems, KNN
calculates the average or weighted average of the K
DAML 2023 - International Conference on Data Analysis and Machine Learning
138

nearest neighbors' values as the prediction for the new
sample. KNN does not have an explicit training
process, but makes decisions based on the closest
training samples during prediction. It uses distance
metrics, commonly the Euclidean distance, to
determine the neighbors. The advantages of KNN are
its simplicity and intuitiveness. For classification
problems, KNN votes for the class with the highest
occurrence among the neighbors.
3.1.4 LogisticRegression
Logistic Regression is a widely used categorization
technique for determining binary outcomes or
performing multi-class classification. Its foundation
is the sigmoid function, a function that is logistical.
The goal of Logistic Regression is to figure out the
optimal fitting parameters that expand the likelihood
of the observed data. The algorithm works by
calculating the weighted sum of the input features
with corresponding coefficients. Then, it applies the
sigmoid function to the sum to obtain a probability
value between 0 and 1. The sample is categorized
as the positive class if its likelihood is higher than a
predetermined threshold; otherwise, it is put into the
negative class. To find the optimal coefficients,
Logistic Regression uses an optimization algorithm,
usually gradient descent, to reduce the
loss value such as cross-entropy loss. The cost
function calculates the distinction between the actual
labels and the expected values. Logistic Regression
assumes that the dataset is linearly separable and the
log-odds of the result and the attributes have a linear
connection. If this assumption is violated, feature
engineering or other techniques may be applied to
improve the model's performance.
3.1.5 RandomForest
Random Forest a flexible and versatile ensemble
learning tool for regression as well as classification
applications. It constructs multiple decision trees, or
'forest', before it integrates projections from each tree
to get the final prediction. The algorithm works as
follows: First, a replacement method known as
bootstrapping is used to choose a random subset of
the training data. Next, a decision tree is built using
these bootstrapped samples, but with a slight
difference. Only a random subset of features are taken
into account at each split, which introduces
randomization and lessens overfitting. This process is
repeated for a set number of decision trees. Each
decision tree separately predicts during the prediction
process, and the end result is generated by averaging
(classification) or summing (regression) all of the
different tree predictions. Random Forests are robust
against overfitting, able to handle high-dimensional
data, and can capture non-linear relationships. They
also provide importance measures for each feature,
indicating their contribution to the
classification/regression task. Overall, Random
Forest is a powerful and reliable machine learning
algorithm.
3.1.6 SVM
Potent and powerful, SVM is designed to tackle a
variety of regression and classification issues. The
fundamental idea of SVM is to figure out a
hyperplane that maximally puts the samples into
different categories. SVM works by transforming the
data into a higher-dimensional feature space using a
kernel function. In this new space, a hyperplane is
constructed to separate the classes. The best
hyperplane is determined when it is impossible to
linearly separate the classes. SVM uses a technique
called soft margin. It allows some data points to be
misclassified but penalizes them with a cost
parameter. This way, SVM achieves a balance
between the margin size and misclassification errors.
To handle non-linear problems, SVM utilizes kernel
tricks to implicitly map the points into a high-
dimensional feature space, where they can become
linearly separable. The linear, polynomial, radial
basis function, and sigmoid kernel functions are
frequently used. SVM is widely used for its capacity
for dealing with high-dimensional data, good
generalization, and robust performance.
3.2 Evaluation and Comparison
This is the final phase of the research. Various
evaluation metrics are displayed so that the model can
be comprehensively evaluated.
𝑃𝑟𝑒𝑐𝑖𝑠𝑖𝑜𝑛 =
(1)
𝑅𝑒𝑐𝑎𝑙𝑙 =
(2)
𝐴𝑐𝑐𝑢𝑟𝑎𝑐𝑦 =
(3)
𝐹1=
∗∗
(4)
𝑊𝑒𝑖𝑔ℎ𝑡𝑒𝑑_𝑝𝑟𝑒𝑐𝑖𝑠𝑖𝑜𝑛 =
∑
𝑃𝑟𝑒𝑐𝑖𝑠𝑖𝑜𝑛
∗𝑤
(5)
𝑊𝑒𝑖𝑔ℎ𝑡𝑒𝑑
=
1
𝑛
𝑅𝑒𝑐𝑎𝑙𝑙
∗𝑤
(6)
Automated Diabetes Diagnosis Using Machine Learning: A Comprehensive Study
139
𝑊𝑒𝑖𝑔ℎ𝑡𝑒𝑑_𝐹1=
∑
𝐹1
∗𝑤
(7)
4 RESULTS
The limited scope of this dataset is attributed to its
exclusive focus on Pima Indian women above the age
of 21, indicating a somewhat restricted representation.
It aims to predict whether an individual has diabetes
through 8 features. To have a deeper insight into the
dataset, some data analysis tools are utilized to
visualize the dataset.
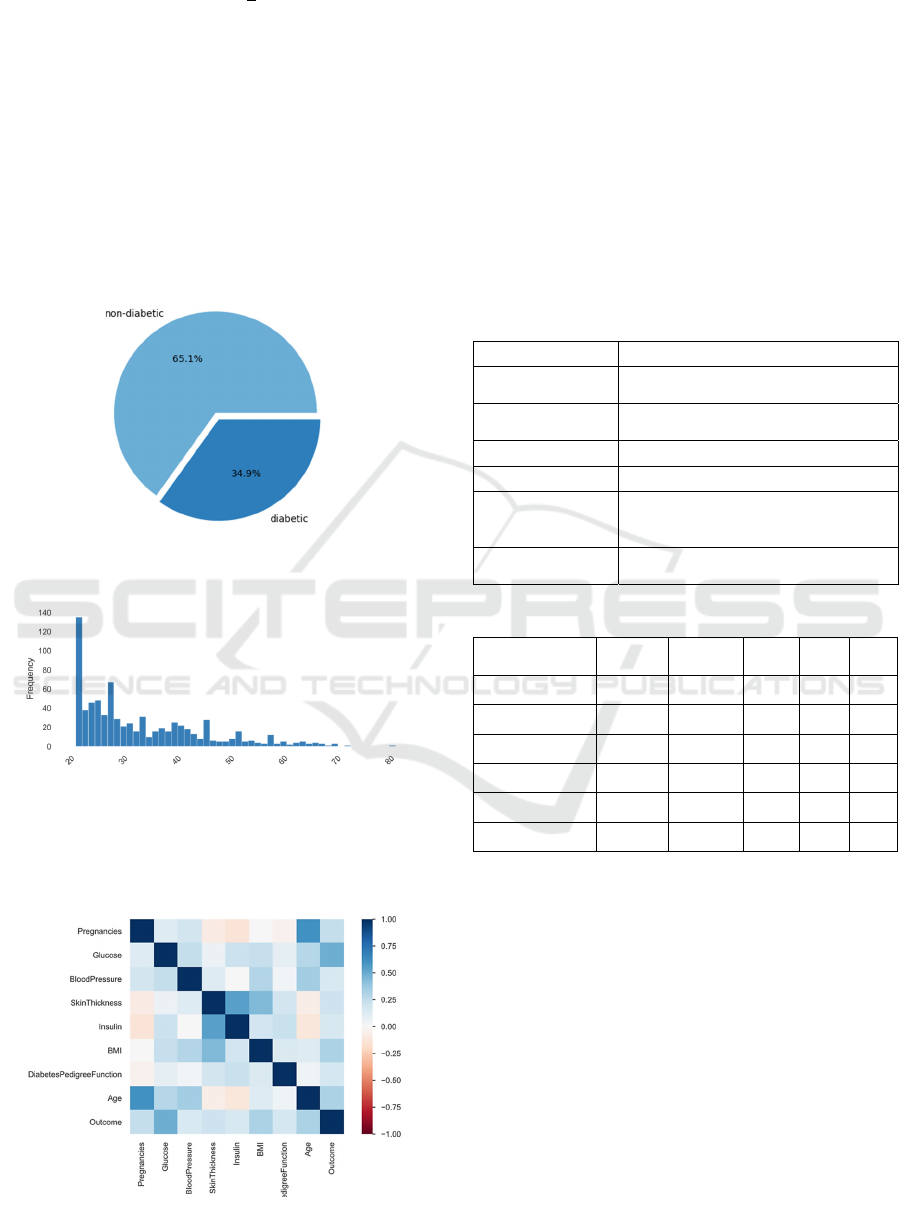
Figure 1: Proportion of diabetic and non-diabetic people
(Picture credit: Original).
Figure 2: Age of samples (Picture credit: Original).
Target 0 represents diabetic patients while target 1
represents non-diabetic individuals. Their
proportions are shown in figure 1. So there are around
Figure 3: Correlation of variables (Picture credit: Original).
1/3 of all samples are diabetic patients. Figure 2
shows the age of samples. It’s clear that most of
samples are young people between 20 and 30.
In figure 3, the shades of color represent the
correlation of variables. Some hidden patterns of
dataset are displayed. For instance, pregnancies and
skin thickness are highly correlated with age and
insulin respectively.
The dataset has been divided into training set and
test set, accounting for 75% and 25% respectively.
The presence or absence of diabetes in the patient is
predicted using six distinct models with the optimal
parameters of each model recorded in Table 1.
Table 1: Optimal Parameters for Each Model.
Model Name Optimal Parameters
DecisitonTree
max_depth=6, max_features=4,
min_samples_split=5
Gradientboosting
learning_rate=0.05, max_depth=3,
max_features=0.5
KNN n_neighbors=19
LogisticRegression C=4, 'penalty':'l2'
RandomForest
'criterion': 'gini', max_depth=6,
'max_features': 'sqrt',
n_estimators=100
SVM
C=0.25, gamma=1,
'kernel': 'linear', 'shrinking': True
Table 2: Evaluation Metrics
Model name Accuracy Precision Recall
F1
score
AUC
DecisitonTree 0.73 0.74 0.73 0.73 0.72
Gradientboosting 0.75 0.76 0.75 0.75 0.81
KNN 0.71 0.70 0.71 0.70 0.65
LogisticRegression 0.72 0.73 0.72 0.73 0.71
RandomForest 0.74 0.74 0.74 0.74 0.72
SVM 0.74 0.74 0.73 0.73 0.71
After training models with optimal parameters, we
have obtained some data for evaluation in Table 2. In
Table 2, models can be compared through 5 different
metrics.
Accuracy measures how closely the predicted
values match the actual values in a given dataset. It’s
evident that Gradientboosting achieves the highest
accuracy at 0.75, followed by RandomForest and
SVM at 0.74. On the contrary, KNN has the lowest
accuracy at 0.71. So, Gradientboosting, the model
with the highest accuracy, can promote 3% of
accuracy compared to KNN, the model with the
lowest accuracy, which makes little difference.
Precision which focuses on the accuracy of
positive predictions for Gradientboosting is 0.76 and
for SVM as well as RandomForest is 0.74. Recall is
DAML 2023 - International Conference on Data Analysis and Machine Learning
140

particularly valuable in situations where false
negatives are considered costly or undesirable. For
Gradientboosting, SVM and RandomForest, recall
value is 0.75, 0.73 and 0.74. Both KNN and
LogisticRegression perform poorly in these 2 metrics
with the lowest scores.
For comprehensive evaluation, F1 score is
introduced to strike a balance between precision and
recall, which lies between 0 and 1. F1 score near 1 can
be considered as the best model (Eusebi 2013). For
Gradientboosting, SVM and RandomForest, F1 score
is 0.75, 0.73 and 0.74 respectively. Therefore, these 3
models are found to give most precise result of the
patients based on the dataset and they will be taken for
further evaluation and comparison.
The effectiveness of a classification model
is evaluated via the algorithm's assessment statistic
known as AUC (Area Under the ROC Curve). It
measures the model's ability to distinguish between
positive and negative classes across various thresholds
and takes 4 metrics above into account to grade the
model performance. An ideal model has an AUC
value of 1.0 while a non-discriminating model has a
value of 0.5 (Eusebi 2013). For Gradientboosting
AUC is 0.81, much higher than SVM at 0.71 and
RandomForest at 0.72. So, from above studies, it can
be concluded that Gradientboosting is the optimal
classifier to diagnose diabetes.
Additionally, for each model, it is found that each
metric only differ by approximately 1%, indicating
that the model can function with excellent stability.
Moreover, it suggests that the model is well-balanced
and reliable in classifications. However, almost all
metric values are around 73% with small variance,
suggesting that Gradientboosting only brought minor
improvement instead of fundamental performance
gain compared to other machine learning models.
5 CONCLUSION
Through evaluation and comparison, the conclusion
can be summarized from results of each model.
Gradientboosting gives the highest accuracy at 0.75
while KNN has the lowest accuracy at 0.71. After
comprehensive comparison, it’s clear that
Gradientboosting is superior to others, but it doesn’t
significantly outperform others on the given dataset.
The contribution of the research is to exam and
improve traditional machine learning algorithms’
performance on disease diagnosis. Generally speaking,
machine learning models are able to handle large
dataset efficiently and make predictions automatically.
But the they are not reliable enough to be brought into
practice, for the given samples are limited and
insufficient, the model is not complicated and the
accuracy of prediction is not high enough. In the future,
the author will apply some practical machine learning
skills such as model blending or some deep learning
algorithms to improve the model. Also, abundant data
and samples are collected and intended for model
training. After appropriate improvements, the model
can be applied to prevention and treatment of diabetes.
It can not only predict risk of heart disease based on
clinical indicators but also distinguish between
individual differences and draw up the optimal
treatment plans.
REFERENCES
E. A.M. Gale and K.M. Gillespie, “Diabetes and gender,”
Diabetologia, 2001, pp.3-15.
G. Roglic, “WHO Global report on diabetes: A summary,”
International Journal of Noncommunicable Disease,
vol.1, pp.3-8, 2016.
Q.Zou, K.Qu, Y.Luo, D.Yin, Y.Ju and H.Tang, “Predicting
Diabetes Mellitus With Machine Learning
Techniques,” Front. Genet., vol.9, pp.1-10, 2018.
Y.A.Christobel and P.Sivaprakasam, “A New Classwise k
Nearest Neighbor (CKNN) Method for the
Classification of Diabetes Dataset,” International
Journal of Engineering and Advanced Technology
(IJEAT), vol.2, pp.396-400, 2013.
V.A.Kumari and R.Chitra, “Classification Of Diabetes
Disease Using Support Vector Machine,”
International Journal of Engineering Research and
Applications, vol.3, pp.1797-1801, 2013.
S.Hina, A.Shaikh and S.A.Satter, “Analyzing Diabetes
Datasets using Data Mining,” Journal of Basic &
Applied Sciences, vol.13, pp.466-471, 2017.
F.Y. Osisanwo, J.E.T. Akinsola, O. Awodele, J.O.
Hinmikaiye, O. Olakanmi and J.Akinjobi,
“Supervised Machine Learning Algorithms:
Classification and Comparison,” International
Journal of Computer Trends and
Technology(IJCTT), vol.48, pp.128-138, 2017.
M.Nilashi, O.Ibrahim, M.Dalvi, H.Ahmadi and
L.Shahmoradi, “Accuracy Improvement for Diabetes
Disease Classification: A Case on a Public Medical
Dataset,” Fuzzy Information and Engineering,
pp.345-357, 2017.
A.Mujumdar and V. Vaidehi, “Diabetes Prediction using
Machine Learning Algorithms,” International
Conference on Recent Trends in Advanced
Computing(ICRTAC), vol.165, pp.292-299, 2019.
P.Eusebi, “Diagnostic Accuracy Measures,”
Cerebrovascular Disease, pp.267-272, 2013
Automated Diabetes Diagnosis Using Machine Learning: A Comprehensive Study
141
