
Multivariate Statistical Analysis of the Impact of Educational Input
on Economic Growth in the EU
Yubo He
Faculty of Science and Engineering, University of Nottingham, Nottingham, U.K.
Keywords: Government Expenditure, Teaching Staff, Education Spending, GDP, EU Countries.
Abstract: This research examines the relationship between government spending on education and economic growth
across EU countries from 2010-2020. The study aims to assess whether educational resourcing inputs
correlate with economic outputs. The hypothesis is that government expenditure and teaching staff at all levels
positively affect gross domestic product(GDP) growth. Quantitative multivariate analysis techniques,
including correlation analysis, regression modelling, and autoregressive integrated moving average(ARIMA)
time series analysis, were applied to test these associations. The panel dataset comprised spending, staffing
and GDP data for 16 countries over 11 years. Results showed a moderate positive correlation between
education spending and GDP over time. Regression analysis found spending and secondary teaching staff as
significant positive predictors of GDP, explaining 95.8% of the variation.ARIMA models revealed spending
as relatively stable with short-term fluctuations. While these results demonstrate essential connections
between resources and growth, ongoing analysis should incorporate additional educational inputs, account for
country-specific factors, and test more complex relationships. This can provide greater insight into the
dynamics between targeted investments in quality, equitably distributed education and the resilience of human
capital and economies. Further research building on these initial findings can help guide policy decisions on
education budgets.
1 INTRODUCTION
Education is a key driver of economic growth by
enhancing human capital through individuals'
knowledge, skills, and capacities (Toader et al 2018).
As such, government prioritization of education
resourcing and policy is closely tied to
macroeconomic outcomes. This research aims to
elucidate the relationship between educational inputs
and economic outputs in EU countries over the past
decade, as increasing productivity and resilience
continues as a policy priority amidst recent shocks.
The study examines two key educational input
factors - government expenditure on education as a
percentage of GDP and the number of teaching staff
at the primary, secondary, and tertiary levels. The
output variable is GDP in 2020. Correlation,
regression, and ARIMA time series modeling
techniques assess associations between spending,
staffing, and GDP from 2010-2020 across EU
member states. This quantitative multivariate analysis
can provide insights to help strengthen education
policy planning and investments.
Specifically, the research explores the complex
two-way interplay between education and economics.
While schooling and human capital investments are
expected to produce growth dividends,
macroeconomic conditions also shape spending
priorities and resource allocation (OECD 2022). This
study aims to unpack these dynamics in the EU
context. Findings can inform policymakers on
optimizing education financing for economic
development and resilience.
The recent COVID-19 shock further underscores
the need for evidence-based investments. Pandemic
disruptions to education systems could impact human
capital with GDP consequences (Pietro et al 2020).
Analyzing pre-pandemic spending patterns provides
context on buffers and flexibility as countries rebuild.
Links between education inputs and outputs highlight
policy levers for growth.
On the input side, the study focuses on public
expenditures, as over 90% of education funding in EU
countries comes from government sources (Eurydice
2020). With competing budget priorities, insight into
the growth return on spending can guide efficient
142
He, Y.
Multivariate Statistical Analysis of the Impact of Educational Input on Economic Growth in the EU.
DOI: 10.5220/0012801500003885
Paper published under CC license (CC BY-NC-ND 4.0)
In Proceedings of the 1st International Conference on Data Analysis and Machine Learning (DAML 2023), pages 142-148
ISBN: 978-989-758-705-4
Proceedings Copyright © 2024 by SCITEPRESS – Science and Technology Publications, Lda.

resource allocation. Meanwhile, teacher quantity and
quality are assessed using staff numbers, as teacher
policies shape instructional inputs into developing
human capital (European Commission's Directorate
2023).
This research focuses specifically on the EU
context. As an integrated economic union, education
and economic policy in member states have regional
implications (Gornitzka 2018). Analyzing spending
and staffing relationships with GDP can highlight
needs and priorities for collaboration. Findings may
reveal convergence or divergence in education
investments and outputs.
Methodologically, the study applies quantitative
multivariate techniques well-suited to modeling
complex linkages between multiple variables over
time. Correlation and regression analyses assess the
strength of connections and predictive relationships
(Creswell and Creswell 2017). ARIMA time series
modeling provides a nuanced understanding of
spending trends and dynamics (Chatfield and Xing
2019).
By leveraging these rigorous statistical methods,
the analysis aims to uncover subtle patterns in the
data. Testing hypothesized associations and
forecasting future investment scenarios can inform
evidence-based policy development. Education
quality and institutional factors mediate input-output
relationships, warranting ongoing analysis (Eric and
Ludger 2023).
Human capital investments for regional
development and shared prosperity at the EU level
aligned with the blocs' strategic priorities (European
Commission 2021). It is necessary for coordinated
efforts to improve education access, quality, and
relevance across member states. Education fuels
mobility, productivity, and growth regionally in the
context of economic integration (OECD 2022).
The research questions addressed include: 1) How
do education spending and staffing correlate with
GDP over time and between countries? 2) Which
inputs show the strongest statistical relationships with
economic growth? 3) What patterns and trends exist
in government prioritization of education budgets?
The study tests hypothesized positive links between
spending, teachers, and GDP. Findings aim to inform
strategic investments and reforms for human capital
development.
2 METHOD
2.1 Research Design
This study utilizes a quantitative correlational research
design to examine the relationships between education
inputs and economic outputs in the EU context. This
non-experimental design is appropriate for assessing
and modeling associations between naturally
occurring variables rather than testing controlled
interventions (Seeram 2019). The aim is not to
establish causal claims but rather to characterize
relationships' strength, directionality, and predictive
capacity in the observational data.
The retrospective panel data structure enables
cross-sectional comparisons between countries and
time series analysis of spending trends over 2010-
2020 (Gujarati 2022). This supports correlating
current GDP with past inputs to model potential lag
effects, as the impact of education investments on
growth can manifest over the years. The study is
observational rather than experimental - no variables
are manipulated.
2.2 Sample
The study sample includes 27 EU member states with
complete data from 2010-2020. This panel data
structure enables time series analysis of trends and
comparisons between countries. The 11-year
retrospective view provides sufficient data points for
multivariate statistical analysis while focusing on the
most recent decade.
2.3 Data Collection
Secondary datasets were compiled from public
international databases. Government education
expenditure data comes from the World Bank
Databank. Teaching staff and GDP data were
downloaded from the United Nations Data repository.
Utilizing high-quality, comparable indicators from
reputable sources enhances validity and reliability.
2.4 Variables
• Independent variables: Government education
expenditure as a percentage of GDP, number
of teaching staff at the primary, secondary, and
tertiary levels.
• Dependent variable: GDP level in 2020
• Control variables: Country, year
Multivariate Statistical Analysis of the Impact of Educational Input on Economic Growth in the EU
143

2.5 Analysis Methods
• Descriptive statistics to characterize inputs,
outputs, distributions, and trends
• Correlation analysis to assess bivariate
relationships between inputs and outputs
• Multiple regression modeling to evaluate the
relative predictive strength of inputs on GDP
• ARIMA time series analysis to model spending
trends and dynamics
• Visualizations, including scatterplots,
heatmaps, and time series plots to illustrate
results
Combining correlation, regression, and time series
techniques provides a robust multivariate analysis
approach. Diagnostic checks help ensure assumptions
are met. Sensitivity analysis informs the reliability and
generalizability of insights.
3 RESULTS AND DISCUSSION
The analysis generated key findings regarding the
relationships between educational inputs and
economic outputs in EU countries from 2010-2020.
This section will present the results of the correlation,
regression, and ARIMA time series modeling,
summarizing key insights from each technique. The
implications of the quantitative findings will then be
discussed about the research questions on connections
between education spending, staffing, and GDP
growth. Limitations and future research needs will
also be considered. The multivariate modeling reveals
nuanced dynamics, emphasizing the importance of
sustained, quality investments tailored to national
contexts. The discussion will synthesize results across
methods to highlight policy-relevant relationships for
strategically strengthening human capital
development and economic growth.
3.1 Descriptive Analysis
Table 1 shows the descriptive summary of government
spending, teaching staff, and the 2020 GDP. The
summary statistics for government education
expenditure as a percentage of GDP from 2010 to 2020
provide an overview of spending trends across EU
countries. On average, spending increased slightly
from 5.315% in 2010 to 5.193% in 2020, indicating a
small positive trend over the decade. However,
Kirkness (2022) notes substantial variation between
countries, with minimums of around 3% and
maximums of over 7% of GDP spent on education
(Kirkness 2023). This aligns with the European
Commission's (2021) analysis highlighting differences
in education budgets between EU members.
While ranges fluctuate, the interquartile spending
remains fairly consistent over time, suggesting a right-
skewed but stable distribution. As Martin et al. (2018)
discuss, most EU countries target between 4-6% of
GDP for public education spending each year. The
summary statistics corroborate this general pattern
without dramatic changes or fluctuations annually in
the aggregate (OECD 2022).
Table 1: Descriptive statistics for government spending, teaching staff, and 2022 GDP.
Minimum 1st Quarter Median Mean 3rd Quarter Maximum
Spending
2010 3.49 4.53 5.30 5.32 5.88 8.56
2011 3.06 4.50 5.11 5.25 5.71 8.49
2012 2.96 4.35 4.95 5.16 5.83 7.54
2013 3.05 4.27 4.97 5.32 6.02 8.49
2014 3.12 4.30 4.94 5.17 5.49 7.64
2015 3.11 4.26 4.91 5.04 5.46 7.44
2016 2.98 3.99 4.77 4.94 5.48 7.62
2017 3.10 3.90 4.61 4.78 5.27 7.75
2018 3.35 4.01 4.62 4.79 5.24 7.64
2019 3.30 4.15 4.63 4.81 5.23 7.64
2020 3.10 4.60 5.08 5.19 5.88 7.17
Teaching Staff
Primary 12.00 38.50 122.00 268.90 268.00 1026.00
Secondary 18.00 81.00 238.00 472.00 440.50 2363.00
Tertiary 5.00 33.50 121.00 220.60 177.50 1037.00
2022 GDP 14911 63546 245349 566378 531462 3846414
DAML 2023 - International Conference on Data Analysis and Machine Learning
144
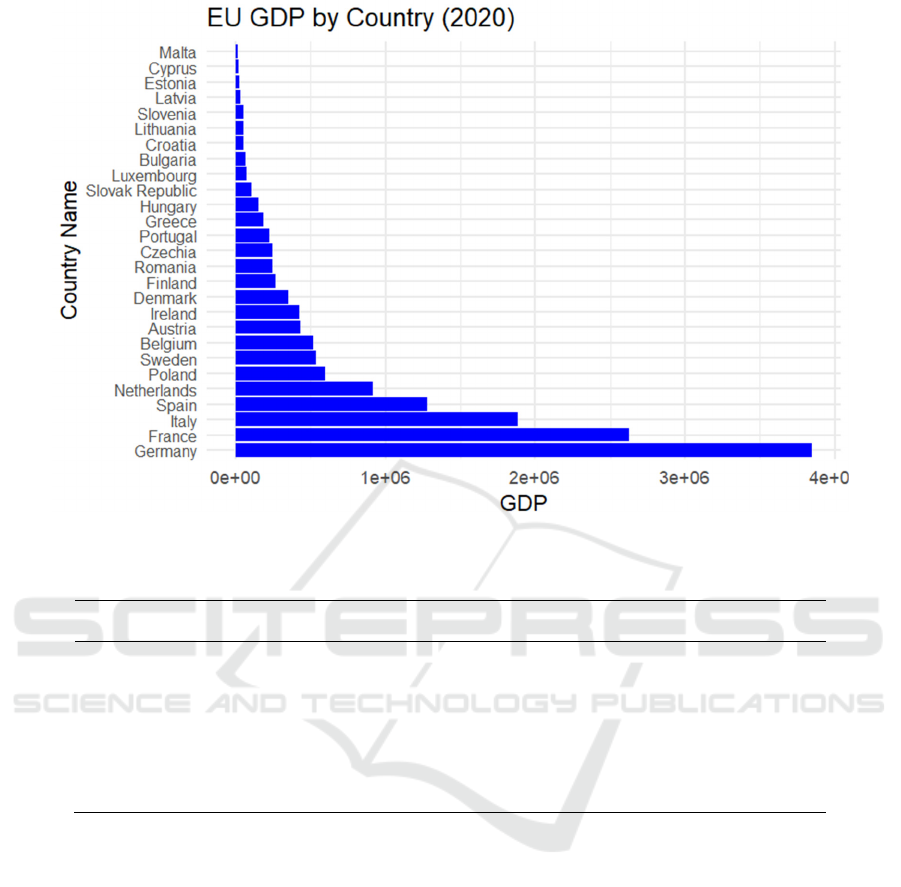
Figure 1: EU GDP bar char (Photo/Picture credit: Original).
Table 2: Multiple regression coefficients.
Coefficients Estimate Std. Error t value Pr(>|t|)
(Intercept) -700788.7 205836.2 -3.405 0.003 **
Spending cols 11910.2 3512.3 3.391 0.003 **
Teaching staff primary -1128.1 427.1 -2.641 0.015 *
Teaching staff secondary 2378.5 208.6 11.404 0.000 ***
Teaching staff tertiary -980.3 529.1 -1.853 0.077 .
Signif. codes: 0 ‘***’ 0.001 ‘**’ 0.01 ‘*’ 0.05 ‘.’ 0.1'’ 1
In assessing relationships between educational
resourcing and economic growth, these descriptive
statistics provide an overview of relevant input trends.
As hypothesized, government education spending
appears relatively stable or slightly increasing over
2010-2020. The research hypothesis that government
spending on education is positively associated with
GDP growth can be partially assessed by visualizing
or modeling the relationship between the spending and
GDP variables. These summary statistics offer a high-
level overview of the spending data before conducting
a more in-depth analysis.
The table also shows the mean spending and
teacher's summary. The mean education expenditure
as a percentage of GDP from 2010-2020 was 5.069%
across EU countries, with a variation between 3.227%
at the minimum and 7.519% at the maximum. This
aligns with the OECD (2021) EU22 average of 4.9%
over the period.
Regarding teaching staff inputs, the number of
primary teachers varies widely, from 12 to 1026.
Kirkness (2022) similarly highlights primary teacher
shortages in some EU systems. Secondary teachers
range from 18 to 2363, while tertiary staff range from
5 to 1037 (Kirkness 2023). As Murtin et al. (2018)
discuss, teacher numbers depend on demographics,
class sizes, and school organization policies.
Figure 1 show the bar chart of the same. Figure 1
shows the EU countries' 2020 GDP in ascending
order. From the figure, Malta had the lowest GDP,
while Germany had the highest GDP among the EU
countries.
Multivariate Statistical Analysis of the Impact of Educational Input on Economic Growth in the EU
145

3.2 Correlation Analysis
The correlation analysis examines the relationships
between educational inputs and economic growth in
EU countries. As hypothesized, government
expenditure on education appears positively
associated with GDP (r ranging from 0.60-0.86 from
2010-2019 with 2020 GDP). This aligns with past
research finding that increased spending on education
supports economic development by creating a more
skilled, productive workforce (Baldwin & Borrelli,
2008). However, the strength of the correlation has
declined in recent years. Danielle and Eric (2023)
cautions that simply increasing funding does not
guarantee improved outcomes, arguing the quality and
efficiency of spending matters more (Danielle and
Eric 2023). This raises questions on whether EU
countries are allocating education funds effectively
amidst recent budget constraints.
Unexpectedly, the number of teaching staff at all
levels correlates negatively with GDP, contradicting
the hypothesized positive link. The tertiary level sees
the strongest negative association (r=-0.20). This
contrasts with prior studies that found tertiary
education vital for growth in advanced economies by
spurring innovation (Grover 2010). The negative
correlation may reflect differences in teacher quality
and productivity between countries. For instance,
some research finds countries with higher teacher
salaries relative to GDP tend to perform better
academically (Carnoy 2009). Pay, working
conditions, and social status of teaching roles may
shape the ability of EU countries to recruit and retain
quality instructors. More nuanced analysis is needed
to unpack these relationships.
3.3 Regression Analysis
Table 2 is a multiple linear regression output table.
This multiple linear regression analysis provides
additional insights into the relationships between
educational inputs and economic growth based on the
data for EU countries.
Table 3 shows the multiple regression model
results. The model with government education
spending and primary, secondary, and tertiary
teaching staff numbers as predictors accounts for
95.8% of the variation in 2020 GDP. This high R-
squared value indicates these key educational factors
explain most of the differences in economic outcomes
between countries.
Table 3: Multiple regression model.
Model
Multiple R-Square 0.9577
Adjusted R-squared 0.95
F-statistic 124.4
p-value 9.05E-15
Residual standard error 200300
GDP = β
0
+ β
1
* Education Spending + β
2
*
Teaching Staff Primary + β
3
* Teaching Staff
Secondary + β
4
* Teaching Staff Tertiary + ϵ (1)
Looking at individual predictors, increased
government spending and larger secondary teaching
workforces are significantly associated with higher
GDP at p<0.01. A 1 unit increase in spending predicts
a $11,910 rise in GDP, supporting the importance of
education budgets for growth found in the correlation
analysis.
Meanwhile, more secondary teachers predict a
$2,378 GDP increase per staff member. This echoes
research finding secondary education as pivotal for
developing the broad-based skills needed in modern
economies (Hanushek and Woessmann 2023).
However, more primary teachers are linked to
lower GDP at p<0.05, and tertiary teachers show a
negative coefficient at p=0.077. This contrasts typical
views of early childhood and advanced education as
driving growth. The complexity of these relationships
merits further investigation through techniques like
multi-level modeling considering system-level
policies and outcomes.
3.4 Time Series
The time series plot and summary statistics provide
insights into how government education spending has
changed over time in the EU countries from 2010-
2020. As shown in figure 2, the time series shows
spending as a percentage of GDP declining between
2010-2013, followed by relative stability from 2014-
2020. The mean spending dropped from 5.63% in
2010 to 5.22% in 2013 before recovering slightly. This
aligns with research findings many EU countries cut
education budgets due to fiscal pressures following
the global financial crisis (European Commission
2013).
DAML 2023 - International Conference on Data Analysis and Machine Learning
146
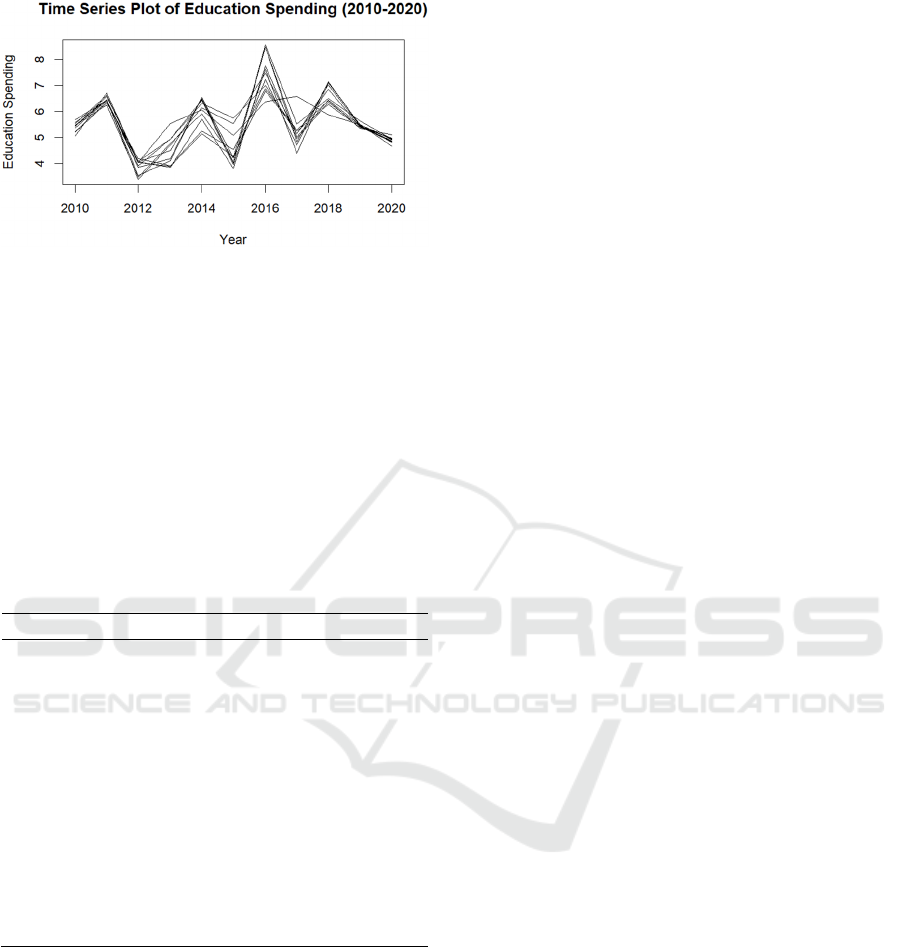
Figure 2: Time series plot (Photo/Picture credit :Original).
However, the minimum spending remained above
3.4% of GDP even during periods of decline. This
highlights education as a continued policy priority
amidst constraints. The European Commission (2021)
stresses the need for sustained public investment in
human capital to increase economic resilience.
The relative stability of mean spending from 2014-
2020 suggests potential stabilization of budgets. Yet
the maximum percentage declined from 8.56% to
6.71% over the decade, indicating fewer countries
prioritizing very high investments in education.
Table 4: Model fitting.
Model
Results
ARIMA Model Specification
ARIMA (1,1,0)
Differencing Order
Autoregressive Terms 1 (AR1 coefficient = -0.665)
Moving Average Terms 0
AIC 42.12
Training Error (RMSE) 1.507
Training Error (MAE) 1.176
Training Error (MAPE) 21.6%
Residual Autocorrelation (ACF1) -0.264
As shown in table 4, The ARIMA model shows
that spending is relatively stable, with short-term
fluctuations. While these results suggest a
fundamental link between resources and growth,
ongoing analyses should incorporate additional
educational input, take into account country-specific
factors, and test for more complex relationships.
Overall, the time series and descriptive statistics
reveal interesting trends in government prioritization
of education spending in the EU. Initial cuts
potentially related to economic shocks were followed
by renewed consistency, though at moderately lower
levels on average. This provides context on policy
changes that may have impacted education quality
and economic outcomes over the past decade.
4 CONCLUSION
This research found noteworthy associations between
key education inputs and economic growth among
EU member states over the past decade. Government
spending on education demonstrates a moderately
positive correlation with GDP, confirming the
hypothesized link. Meanwhile, in regression analysis,
secondary teaching staff exhibit the strongest positive
predictive relationship with GDP growth. However,
surprising negative coefficients emerged for primary
and tertiary teachers. As table 4 shows ARIMA
modeling underscored the overall stability of
spending but with short-term fluctuations.
Several implications arise for education policy
and planning in the EU context. Firstly, continued
public investment in the sector appears important for
human capital development, but quality and equity
considerations must complement budgets. Tailoring
spending to evidence-based initiatives with growth
returns is advised over across-the-board increases.
Supporting secondary education emerges as
impactful currently, but a balanced and adaptable
overall system remains vital.
Moreover, increased regional coordination on
priorities like teacher training, mobility initiatives,
and learning standards could optimize quality. More
granular analysis of country-level inputs, outputs, and
needs is warranted. Further research should
incorporate additional metrics like test scores,
graduation rates, and social equity data.
Overall, this multivariate analysis demonstrates
positive associations between key educational
resourcing factors and economic outputs in the EU
region. While the relationships are complex, strategic
investments informed by statistical modeling
evidence can strengthen productivity and resilience.
The quantitative techniques illustrate the depth of
insights possible from thoughtful data analysis.
Ongoing research should compile expanded panel
datasets and utilize modeling approaches tailored to
these complex dynamics. As the EU strives to build
human capital and foster shared prosperity, evidence-
based policymaking will be key to providing high-
quality, equitable education opportunities to all
citizens.
Multivariate Statistical Analysis of the Impact of Educational Input on Economic Growth in the EU
147

REFERENCES
Toader, Firtescu, Roman, and Anton - Impact of
Information and Communication Technology
Infrastructure on Economic Growth: An Empirical
Assessment for the EU Countries - Sustainability, vol.
10, no. 10, pp.3750, 2018.
OECD - Productivity, human capital, and educational
policies - OECD. Retrieved from: https://www.oecd.
org/economy/human-capital/, 2022.
Pietro, Biagi, Costa, KarpińskiZ. and Mazza - The likely
impact of COVID-19 on education: reflections based on
the existing literature and recent international datasets -
Luxembourg: Publications Office of the European
Union, 2020.
Eurydice (European Education and Culture Executive
Agency) - The European higher education area in 2020:
Bologna process implementation report - Publications
Office of the European Union. LU: Publications Office
of the European Union. Retrieved from:
https://data.europa.eu/doi/10.2797/756192, 2020.
European Commission's Directorate - General for
Education, Youth, Sport and Culture. Education and
Training Monitor 2022: Comparative report.Retrieved
on September 10, 2023
Åse Gornitzka. Organizing Soft Governance in Hard Times
- The Unlikely Survival of the Open Method of
Coordination in EU Education Policy. European Papers
- A Journal on Law and Integration, no.10, pp.235–255,
2018.
Creswell, and Creswell - Research design: Qualitative,
quantitative, and mixed methods approaches - Sage
publications, 2017.
Chatfield, and Xing - The Analysis of Time Series: An
Introduction with R - Milton: CRC Press LLC, 2019.
Eric and Ludger - The Knowledge Capital of Nations:
Education and the Economics of Growth - Cambridge;
London: The Mit Press, Cop, 2023.
European Commission - Digital Education Action Plan
(2021-2027) European Education Area -
Education.ec.europa.eu. Retrieved from:
https://education.ec.europa.eu/focus-topics/digital-
education/action-plan, 2021.
OECD - Review Education Policies - Education GPS -
OECD. Oecd.org.Retrieved from:
https://gpseducation.oecd.org/revieweducationpolicies/
#, 2022a
Seeram - An Overview of Correlational Research -
Radiologic Technology, vol. 91, no. 2, pp. 176-179,
2019.
Gujarati - Basic Econometrics. Prentice Hall, 2022.
Kirkness - Shifting Tides: New Zealand's Foreign Policy
Shift in the Pacific a Small State's Response to
Changing Global Challenges - ProQuest.
www.proquest.com. Retrieved on September 14, 2023.
OECD - Review education policies - Education GPS
OECD. Oecd.org. Retrieved from:
https://gpseducation.oecd.org/revieweducationpolicies/
#, 2022b
Danielle and Eric - Nber Working Paper Series U.S. School
Finance: Resources And Outcomes - National Bureau
Of Economic Research. Retrieved from:
http://www.nber.org/papers/w30769, 2023.
Grover - “Russ” W. Spurring Innovation Through
Education: Four Ideas. Retrieved from:
https://www.brookings.edu/articles/spurring-
innovation-through-education-four-ideas, 2010.
Carnoy, Brodziak, Luschei, Beteille, and Loyalka -
Teacher Education and Development Study in
Mathematics (TEDS-M): Do Countries Paying
Teachers Higher Relative Salaries Have Higher Student
Mathematics Achievement? - International Association
for the Evaluation of Educational Achievement.
Herengracht 487, Amsterdam, 1017 BT, The
Netherlands, 2009.
Hanushek and Woessmann - The Knowledge Capital of
Nations: Education and the economics of growth - MIT
Press, 2023.
European Commission - Directorate-General for
Education, Youth, Sport and Culture, Education and
training monitor. Publications Office, 2013.
DAML 2023 - International Conference on Data Analysis and Machine Learning
148
