
Statistical Analysis of Typhoons in China and the Western Pacific
Ocean
Yuchen Gao
Department of Atmospheric Sciences, School of Atmospheric Sciences, Nanjing University, Nanjing, China
Keywords: Typhoon, Sea Surface Temperature, ENSO, SOI.
Abstract: Typhoon has the characteristics of sudden strong, destructive power. Typhoons can cause huge economic
losses and casualties to coastal countries and regions, so it is considered to be one of the most serious natural
disasters in the world. The impact of typhoons has gradually increased in recent years. Therefore, the accurate
analysis and prediction of typhoon is particularly important. This paper starts with statistical methods, obtains
relevant data in the last hundred years, analyzes and summarizes some important factors that may affect
typhoon. Indicators such as barometric pressure and sea surface temperature are most likely to affect typhoons.
Therefore, the study started from the subtropical high and SST, collected many years of data and research,
and analyzed the relationship between them and typhoons by statistical methods. By analyzing the data of the
last hundred years and synthesizing the previous studies, the influence of the Western Pacific subtropical high
and ENSO (El Niño-Southern Oscillation) on the Pacific typhoon is discussed. Finally, the correlation
between typhoon and these two factors is obtained through analysis.
1 INTRODUCTION
Typhoons are tropical cyclones occurring in the
northwest Pacific Ocean and the South China Sea with
central sustained winds of 17.2m/s or above, including
tropical storms, severe tropical storms, typhoons,
severe typhoons, and super typhoons (Wang et al 2021).
Typhoon has the characteristics of sudden strong,
destructive power. Typhoon can cause huge economic
losses and casualties to coastal countries and regions,
so it is considered one of the most serious natural
disasters in the world (Kossin et al 2013 & Ying et al
2014).
Favorable atmospheric circulation, sea
temperature field, and other thermal and dynamic
environmental conditions are the direct background of
typhoon development. Traditionally, low-level
cyclone disturbance, warm and humid SST, and small
vertical shear of tropospheric zonal wind are the three
basic environmental conditions for typhoon
occurrence (Zou 2009). A large number of typhoon
case diagnoses and numerical simulation tests have
expanded our understanding of the environmental
factors affecting the change of typhoon intensity, such
as circulation and underlying surface. Cold air, high-
altitude jet stream, westerly trough, small and medium
scale system, topographic action, and sea surface
spray may also have an impact on typhoon intensity.
In addition, the degeneration of tropical cyclones by
mid-latitude circulation systems will also affect their
intensity and track. Therefore, the sea-air environment
conditions of China's offshore waters will directly
affect the active degree of typhoons entering China's
offshore waters. The sea-air environmental conditions
in the South China Sea and the tropical West Pacific
also restrict the number and distribution of typhoons
generated in the sea area, thus indirectly affecting the
offshore typhoons in China (Zheng 2015).
The generation and development of typhoons
cannot be separated from the heat transfer of the ocean
to its system. In the context of the long time scale of
global warming, the activity path and influence range
of typhoons have changed significantly in the
northwest Pacific Ocean.Sea surface temperature (sea
surface temperature, SST) and air-sea flux is one of the
important factors affect the air-sea interaction (Hu
2013). At the same time, since SST and air-sea
interaction are significantly affected by the El Nino-
Southern Oscillation (ENSO), the ENSO event is also
one of the factors affecting typhoons. It is of great
significance to use numerical models to study the
impact of ENSO events on typhoons, to forecast and
defend typhoon disasters, and to assess the impact of
decadal changes of SST on typhoons (Zheng et al
2013).
Gao, Y.
Statistical Analysis of Typhoons in China and the Western Pacific Ocean.
DOI: 10.5220/0012801800003885
Paper published under CC license (CC BY-NC-ND 4.0)
In Proceedings of the 1st International Conference on Data Analysis and Machine Learning (DAML 2023), pages 81-86
ISBN: 978-989-758-705-4
Proceedings Copyright © 2024 by SCITEPRESS – Science and Technology Publications, Lda.
81
2 INFLUENCE OF
INTERDECADAL VARIATION
OF SUBTROPICAL HIGH ON
TYPHOON VARIATION
Northwest Pacific subtropical high (Western North
Pacific Subtropical High WNPSH), hereinafter
referred to as subtropical high. It is a permanent high-
pressure circulation system over the Pacific Ocean,
generally represented by the area surrounded by the
5880 gpm line on a 500 hpa elevation chart over the
western Pacific (Chai et al 2023). As an important
factor affecting the weather system, the inter-annual
variation of subtropical high has an important
influence on various factors of typhoons.
2.1 Research Data and Methods
Typhoon data are obtained from IBTRACS, the best
archive for International Climate Management. The
data includes the relative physical quantities of
tropical storm locations and intensities, with an
interval of 6 h. It records most tropical cyclones
developing in the Northwest Pacific Ocean from 1861
to 2020. It is used to study the annual average
duration, annual frequency, and longitude and latitude
of typhoon path. The 500 hPa altitude field data was
used by the Beijing Climate Centre, BCC-CSM2-
MR_historical_r3i1p1f1 and the French National
Centre for Meteorological Research, CNRM) CNRM
_historical_r2i1p1f2 CM6-1-2 sets of CMIP6 data
with ERA5.
2.2 Influence of Interannual Variation
of the Western Pacific Subtropical
High on Typhoon Characteristics
2.2.1 Statistical Characteristics of Minor
Heights
The Northwest Pacific Subtropical High is one of the
important systems that affect typhoons and other
weather processes. The correlation between the
500hPa altitude field and the northernmost latitude
and westernmost longitude reached by typhoons is
roughly bounded by 40°N, while the relationship
between the north and the south is opposite. The
correlation coefficient between the maximum latitude
reached by typhoon and the 500hPa altitude field is
negative north of 40°N and positive south of 40°N.
This is because the area south of 40°N is the main
active area of the subtropical high, and when the
500hPa altitude field increases and the subtropical
high strengthens, it is conducive to the northbound
typhoon (Chai et al 2023).
In general, it is of practical significance and
research value to study the typhoon activity range by
the decadal variation of the subtropical high, west
ridge and ridge position.
2.2.2 Correlation Between Typhoon Activity
Characteristics and Subtropical High
The region where WNPSH is located is the region
where the sinking branch of Hadley circulation is
located, and the stronger the sinking branch of Hadley
circulation is, the more conducive it is to the sub-high
intensification. The ascending branch of Walker
circulation is located at the equator between 120 and
160°E. When the West Pacific warm pool is strong
and the monsoon trough is more active, the ascending
branch of Walker circulation on the equator is also
stronger, which will make the subtropical high
position to the west and north, which is conducive to
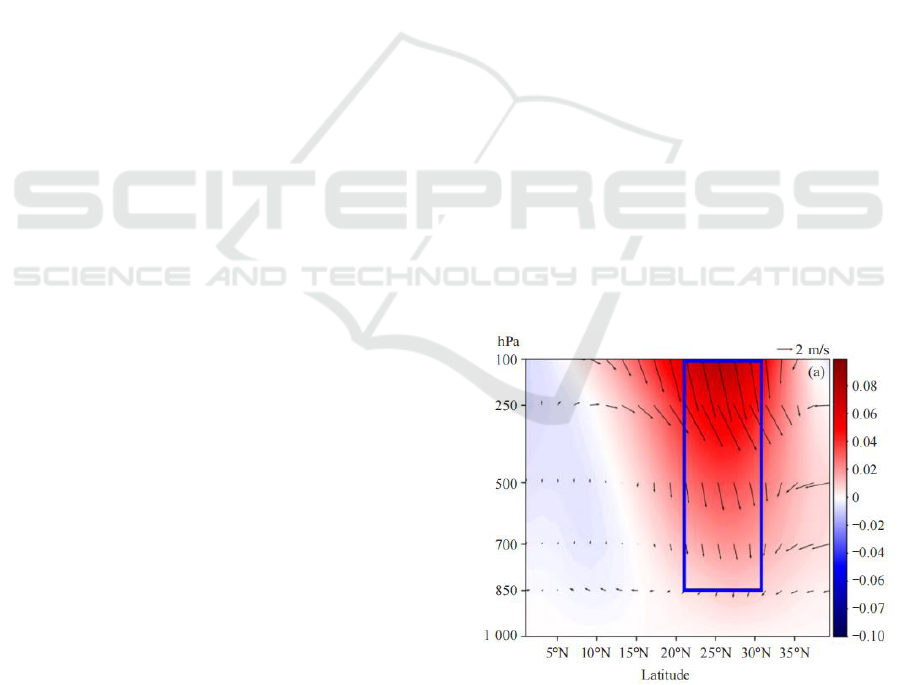
typhoon influence on China (Mu et al 2001). A v-w
wind synthesis analysis of Hadley circulation at
120~160°E and 0~ 40°N was conducted to obtain
the average condition of Hadley circulation at 0~ 40
°N under the zonal average of 120~160°E during
1861 ~ 2020, as shown in figure 1.
Similarly, to study the ascending branch of the
Walker circulation, a synthetic analysis of the average
u-w wind over the equator at 120 to 160°E from 1861
to 2020 was also performed, as shown in figure 2.
Figure 1: V-W wind synthesis analysis of the zonal mean of
120°~160 °E and 0 °~40 °N from 1861 to 2020 (Picture
credit: Original).
DAML 2023 - International Conference on Data Analysis and Machine Learning
82
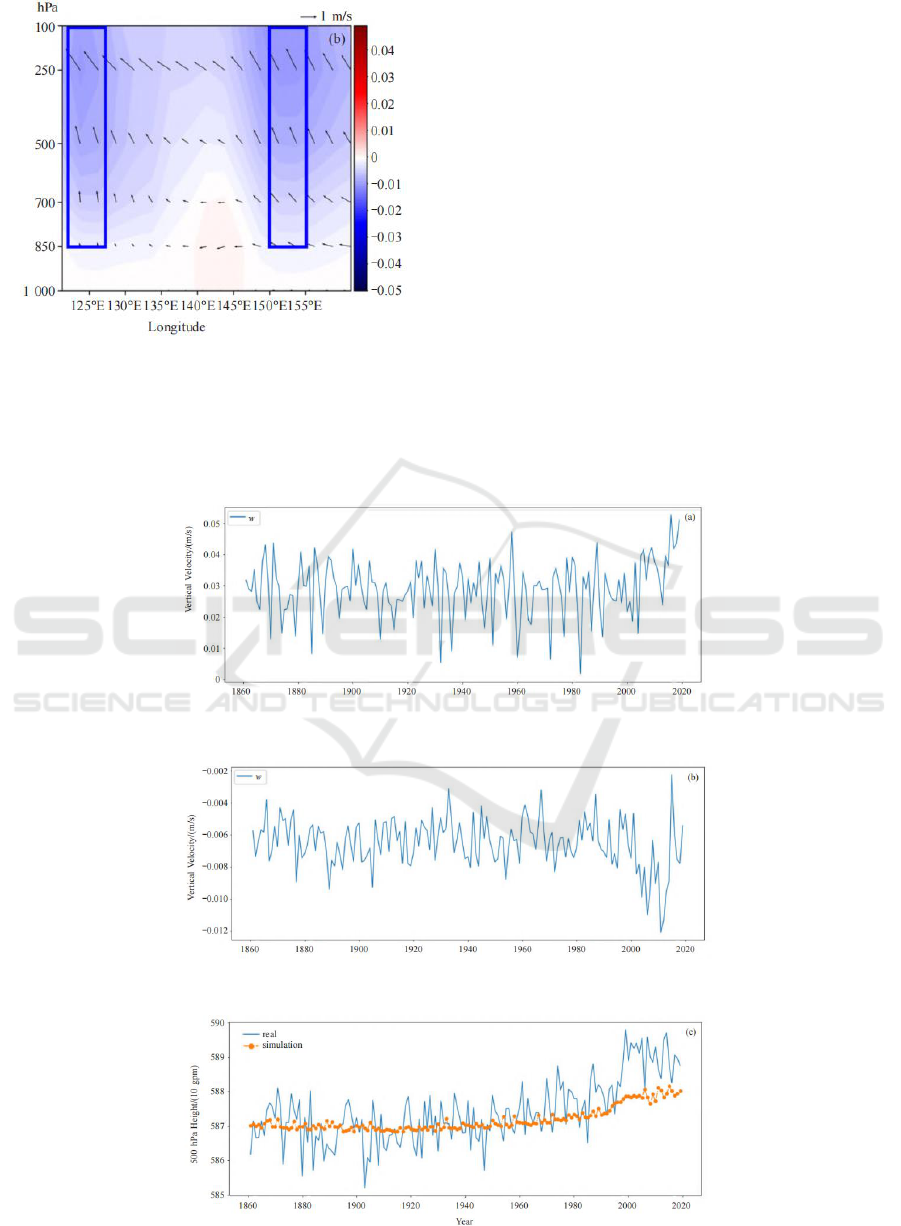
Figure 2: Average u-w wind synthesis analysis of 120 °
~160 ° E over the equator from 1861 to 2020 (Picture
credit: Original).
The ascending branch of the Walker circulation at
the equator divides into two branches at 120-160 °E.
One is located in the region above 850hPa from 122 to
127 °E, and the other is located in the region above
850hPa from 150 to 155 °E. Calculate the change in
the mean value of subsidence motion over 160 years
for the large value region of the sinking branch of the
Hadley circulation (the region represented by the blue
box in Figure 1a), defined as wh; And the change in
the mean 160-year upward motion of the high-value
regions of the two Walker circulation rising branches
(the regions represented by the blue boxes in figure 2,
defined as ww (Gong and Wang 2000).
The average 500hPa height field h in the key
WNPSH region is significantly positively correlated
with the vertical velocity wh of the sinking branch of
Hadley circulation and negatively correlated with the
average vertical velocity ww of the rising branch of
Walker circulation. The annual frequency of typhoons
in East China is significantly correlated with h. The
annual frequency affected by typhoons in South China
is significantly correlated with wh and ww. As shown
in figure 3, 4 and 5.
Figure 3: Example of Annual variation of wh and simulation results (Picture credit: Original).
Figure 4: Annual variation of ww and simulation results (Picture credit: Original).
Figure 5: Annual variation of h(c) and simulation results (orange dot line in c) (Picture credit: Original).
Statistical Analysis of Typhoons in China and the Western Pacific Ocean
83

2.3 Result Analysis
The average 500hPa height field h in the key WNPSH
region is significantly positively correlated with the
vertical velocity wh of the sinking branch of Hadley
circulation and negatively correlated with the average
vertical velocity ww of the rising branch of Walker
circulation. The annual frequency of typhoons in East
China is significantly correlated with h. The annual
frequency affected by typhoons in South China is
significantly correlated with wh and ww. Using t and
h as independent variables, the curve estimation can
successfully simulate the annual frequency of typhoon
influence in East China. Using t, wh, and ww as
independent variables, the curve estimation can
successfully simulate the annual frequency of typhoon
influence in South China.
3 ANALYSIS OF THE
INFLUENCE OF EL NINO-
SOUTHERN OSCILLATION
(ENSO) ON TYPHOONS
Sea surface temperature (SST), as an exogenous
forcing, has an important effect on the atmosphere.
The formation and development of tropical cyclones
are closely related to the size and distribution of SST.
This is because the wide ocean is the main source of
typhoon energy, and the high-temperature seawater
provides energy for the formation and development of
typhoons in the form of sensible heat flux and latent
heat flux. On the other hand, when a tropical cyclone
moves over the sea, the SST is reduced by bringing
cold water from deep layers to the mixed layer through
physical processes such as enrolling and suction. At
the same time, since SST is an important component
of El Nino-Southern Oscillation (ENSO), and the most
intuitive manifestation of ENSO is the inter-annual
variation of SST, ENSO is also one of the important
factors affecting typhoons (Zheng et al 2013).
3.1 Data Sources
The IBTRACS (http://ibtracs.unca.edu/) dataset
includes estimates of typhoon location and intensity at
intervals of 6h, starting from 1884 in the Northwest
Pacific Ocean. The data records 4193 tropical
cyclones that have developed in the Western Pacific
Ocean since 1884. Among them, the period of the best
path data is 1884-2020, and the period of the lowest
central pressure and the maximum wind speed near the
center is 1946-2020. Select the time node to compare
the time of typhoon occurrence. Based on the time
series of typhoon locations provided by IBTRACS
data, the changes of the northernmost latitude,
westernmost longitude, typhoon frequency, frequency
of strong typhoons in East and South China, as well as
the changes of the minimum central pressure, and the
maximum wind speed near the center since 1884 were
analyzed. Based on the changes of WNPSH, West
Pacific warm Pool, ENSO, flow field, radiation flux,
and other fields, the long-term climate change since
1880 is investigated, and the correlation analysis is
made. Based on the changes of 500hPa warm pool,
radiant flux, ENSO, and related physical quantities,
the influence of long-scale changes such as ENSO and
radiant flux on tropical cyclones in the Northwest
Pacific Ocean in the past 100 years was explored, and
comparative analysis was made.
3.2 Influence of ENSO on Typhoon
Activity
Previous analyses have shown that physical quantities
such as vertical wind shear, vorticity, radiation, and
water vapor all have an impact on typhoons, and
ENSO activities may further affect typhoon activities
through the influence of these physical quantity fields.
The main areas of typhoon generation and
development in East Asia and Southeast Asia (105°-
180°E) can be calculated. The time series of the
average vertical wind shear, vorticity, SDLR, and
specific humidity of 5° -30° N, to calculate the
correlation coefficient between these variables and the
Southern Oscillation index (SOI), and calculate the
correlation distribution diagram between the physical
quantity field that passes the 95% significance test and
the typhoon activity frequency at the corresponding
location (Zheng et al 2013).
The SOI index is a representative index to measure
ENSO activities. The correlation coefficient between
the frequency of typhoons in the Northwest Pacific
Ocean since 1884 and the SOI index has reached
0.1337, passing the 90% significance test. The sliding
correlation analysis between the SOI index and the
frequency of typhoons in the Northwest Pacific Ocean
since 1884 is carried out. Thus, the influence of ENSO
activities on the frequency of typhoon generation in
different years was explored (Liang 2021).
As shown in figure 6, 7, 8, in this region, the
typhoon generation frequency in the LaNina year is
the highest, and the typhoon generation frequency in
ElNino year is the lowest, and the typhoon generation
probability in ElNino year is high in the ocean, while
the typhoon generation probability in LaNina year is
high in the offshore.
DAML 2023 - International Conference on Data Analysis and Machine Learning
84
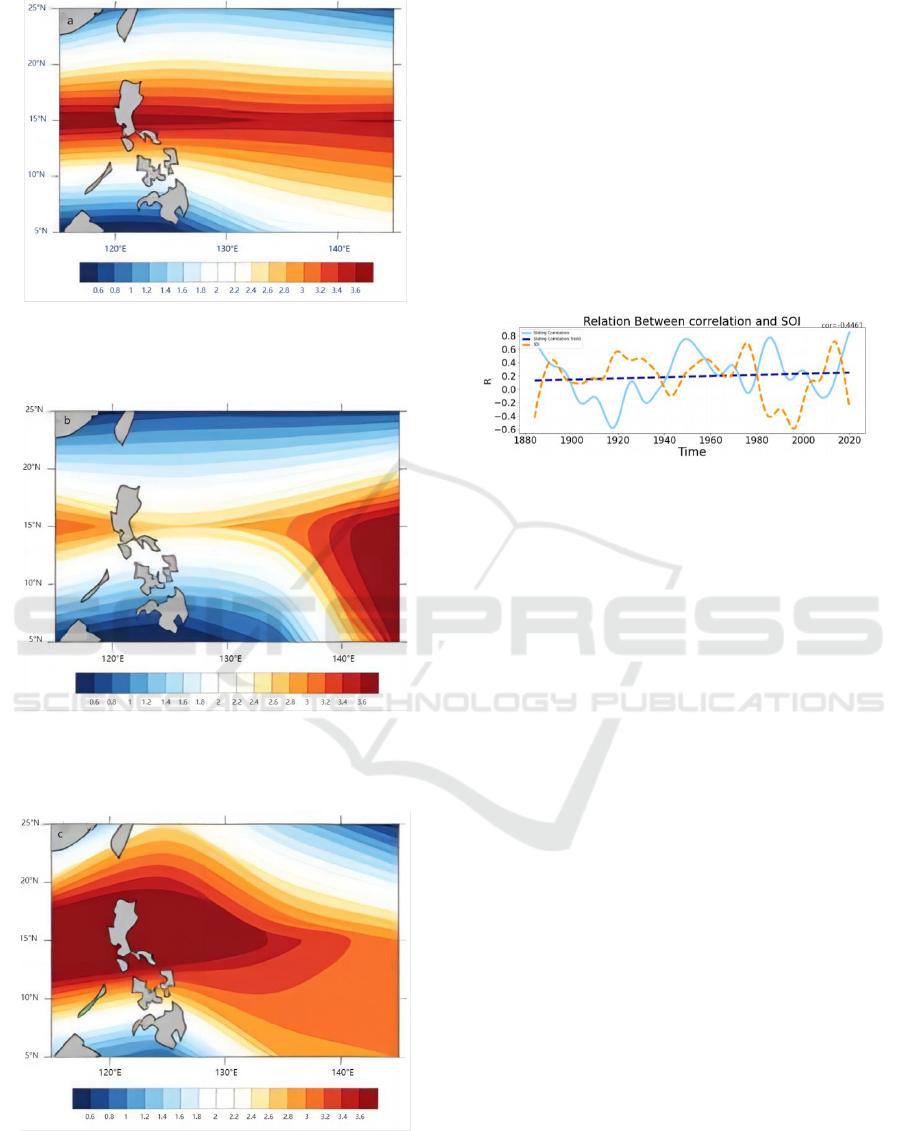
Figure 6: Annual frequency distribution of typhoons in the
main typhoon-generating regions of the tropical Northwest
Pacific perennial LaNina years (Picture credit: Original).
Figure 7: Annual frequency distribution of typhoons in the
main typhoon-generating regions of the tropical Northwest
lNino (Picture credit: Original).
Figure 8: Annual frequency distribution of typhoons in the
main typhoon-generating regions of the tropical Northwest
Pacific LaNina years (Picture credit: Original).
As shown in figure 9, the positive correlation
between SOI and the frequency of typhoon generation
in the Northwest Pacific Ocean is on the rise, and since
1980, except for a short negative correlation in the early
21st century, the remaining time has been positively
correlated, and the positive correlation between the two
has been significantly enhanced since around 2008.
This positive correlation enhancement trend indicates
that when the SOI index is higher, the frequency of
typhoon generation in the Northwest Pacific Ocean is
higher. When the LaNina event occurs, the frequency
of typhoon generation in the northwest Pacific tends to
be higher (Zhang and Lv 2012).
Figure 9: Analysis of the smooth-sliding correlation between
SOI index and typhoon frequency in the Northwest Pacific
Ocean since 1884 (Picture credit: Original).
Combined with figure 6, 7, 8 and 9, it is found that
ENSO activity can affect the location of typhoon
generation, but the influence on typhoon frequency is
uncertain to a certain extent, and further study on the
influence of ENSO on typhoon activity is needed.
4 CONCLUSION
By analyzing the data of the last hundred years and
synthesizing the previous studies, the influence of the
Western Pacific subtropical high and ENSO on the
Pacific typhoon is discussed.
In the past hundred years, the duration and annual
frequency of typhoons after 1930 have increased in all
regions. The average annual impact duration of
typhoons in the Northwest Pacific during 1975-2020
has decreased compared with that during 1930-1975,
but the annual frequency of typhoons has no
significant change. There is no significant change in
the annual influence duration and frequency in South
China. However, the annual average duration and
annual frequency of typhoons in the East China coastal
area have increased significantly, which is
significantly related to the change of WNPSH in the
past 160 years. The annual frequency of typhoons in
East China is significantly correlated with h. The
annual frequency affected by typhoons in South China
is significantly correlated with wh and ww. Moreover,
Statistical Analysis of Typhoons in China and the Western Pacific Ocean
85

using t and h as independent variables to estimate the
curve, the annual frequency of typhoon influence in
East China can be simulated successfully. Using t, wh,
and ww as independent variables, the curve estimation
can successfully simulate the annual frequency of
typhoon influence in South China.
There is a general causal relationship between
radiation flux and ENSO-related variables, some of
which are directly caused and some are indirectly
related. In general, changes in radiative fluxes can
affect changes in ocean heat, and changes in ocean
heat can affect changes in atmospheric circulation,
thus creating a causal relationship between radiative
fluxes and ENSO-related variables. In ElNino years,
typhoons tend to form ocean-going, and the typhoon
tracks tend to be east-north, with large intensity
variance. In LaNina year, typhoons tend to generate
near the coast, the typhoon path is west-south, the
intensity variance is small, and the average impact
time of southeast coastal areas of China is long.
There are still some areas that need to be further
explored in this study. First, the intensity of the
physical quantity field involved in this paper can also
be defined from different angles. How to define the
radiation amount, the intensity of ENSO activity and
the intensity of typhoon activity from various angles,
so as to study the interaction between these elements is
a very worthwhile problem. Second, more
comprehensive studies can be conducted from the
perspective of more physical quantities, such as ENSO
changes over long time scales. There are still many
related physical quantities and the interaction between
ENSO worthy of further study. Moreover, the various
ENSO-related physical quantities mentioned in this
paper, such as radiation flux, are also worthy of further
study, so as to have a deeper understanding of the effect
of ENSO changes on typhoons over a long time scale.
REFERENCES
J. Wang, J. Y. Dai, Y. J. Yang, and Y. Y. Lv, paper title
“Statistical characteristics of typhoons in China from
1977 to 2018”. Marine limnology Bulletin. 2021.
J. P. Kossin, T. L. Olander, and K. R. Knapp, paper title
“Trend analysis with a new global record of tropical
cyclone intensity”. Journal of Climate, vol. 26, no. 24,
pp. 9960-9976. 2013.
M. Ying, W. H. Zhang, X. Lu, J. Feng, Y. Fan, and D. Chen,
paper title “An overview of the China Meteorological
Administration tropical cyclone database”. Journal of
Atmospheric and Oceanic Technology, vol. 31, no. 2,
pp. 287-301. 2014.
Y. Zou, paper title “The relationship between offshore
tropical cyclone activity in China and interannual
variation of East Asian subtropical monsoon
Doctoraldissertation”. Chinese Academy of
Meteorological Sciences, 2009.
F. Zheng, paper title “A Study on Sudden Intensification
and Decline of Typhoons in Offshore China”. Chinese
Academy of Meteorological Sciences, 2015.
Y. H. Hu, paper title “Numerical Experimental Analysis of
SST influence on Typhoon”. Ocean University of
China, 2013.
H. Y. Zheng, L. Wu, Z. P. Wen, and T. M Wang, paper title
“Anomaly of typhoon frequency in Northwest Pacific
Ocean and its relationship with air-sea flux”. Journal
of Oceanography, 2013.
B. Y. Chai, F. Xu, J. J. Xu, L. G. Han, S. Q. Chen, Y. J. Li,
and S.J. Zhang, paper title “Interdecadal variation of
the Northwest Pacific Subtropical High in the last 160
years and its influence on the interannual variation of
typhoons”. Journal of Tropical Meteorology, vol. 39,
no. 2, pp. 1004-4965, 2023.
Q. Z. Mu, S. W. Wang, J. H. Zhu, and D.Y. Gong, paper
title “Changes of subtropical high over the Western
Pacific in summer during the last hundred years”.
Journal of Atmospheric Sciences, vol. 25, no. 6, pp.
787-797. 2001.
D. Y. Gong, and S. W. Wang, paper title “An experiment to
recover the 500hPa altitude field in the Northern
Hemisphere in the last hundred years”. Journal of
Tropical Meteorology, vol. 16, no. 2, pp. 148-154.
2000.
X. S. Liang, paper title “Normalized multivariate time series
causality analysis and causal graph reconstruction”.
Entropy, vol. 23, no. 6, pp. 679. 2021.
L. F. Zhang, and Q.P. Lv, paper title “Joint EOF analysis of
SSTA and SLPA in the North Pacific Ocean during
winter”. S3 focuses on climate change and exploring
a low-carbon future. 2012.
DAML 2023 - International Conference on Data Analysis and Machine Learning
86
