
Customer Churn Prediction: An Empirical Research of
Telecommunications Service Provider in the United States
Yifei Dou
Department of Mathematics, University of Washington Seattle, Seattle, U.S.A.
Keywords: Prediction, Customer Churn, Telecommunications Service.
Abstract: In the competitive landscape of subscription-based industries, like telecommunications services, customer
retention is vital for sustained growth. The dynamic nature of Telecom Industry requires a proactive approach
to address customer churn, which can lead to financial losses and damage to reputation. This research uses
linear regression analysis to predict customer churn within U.S. telecommunications service providers. By
exploring the relationships between customer attributes and churn scores, the study aims to provide actionable
insights for informed decision-making. The methodology involves data collection, hypothesis formulation,
correlation, and constructing a linear regression model. Through meticulous analysis, the study's findings
reveal that longer subscription tenure and extended contracts are associated with lower churn scores,
emphasizing their role in fostering loyalty. Conversely, certain internet service types and higher monthly
charges are linked to elevated churn scores, underscoring the importance of service quality and pricing
considerations. The research contributes to the strategic arsenal of telecommunications providers, equipping
them with a predictive tool to address customer churn and cultivate loyalty.
1 INTRODUCTION
In developed nations, the telecom industry plays a
pivotal role and has seamlessly integrated itself into
the necessities that people need to live. However,
within the landscape of subscription-based business
models, like telecommunications services, ensuring
customer retention stands as a fundamental pillar for
sustained growth. Competition is fierce in the
Telecom market, where customers are presented with
various providers even within a single service
category. The significance of this competition cannot
be underestimated, as even a single instance of
dissatisfaction can prompt a customer to switch
allegiances. The potential repercussions are
substantial, spanning from tangible financial losses to
irreparable damage to reputation. Yet, many telecom
providers concentrate their efforts on acquiring new
customers, inadvertently sidelining the equally crucial
pursuit of nurturing existing ones and capitalizing on
their untapped consumption potential. Reichhold et al.
invalidate this notion by highlighting a positive
correlation between the longevity of a business-
customer relationship and the enterprise's profitability
from its existing clientele (Reichheld et al 2000). This
study notes that just a 5% boost in the customer
retention rate translates to a remarkable 25% to 95%
escalation in the net present value of customers within
the business ecosystem. Therefore, businesses need a
system that can predict customer churn effectively in
the early stages, which is essential for any service
sector. This paper focuses on predicting customer
churn scores within telecommunications service
providers in the United States. This study employs a
versatile statistical method of linear regression to
uncover the underlying patterns and influences on
churn scores. By delving into the nuanced
relationships between customer attributes and churn
scores, this paper intends to provide actionable
insights for informed decision-making.
2 REVIEW OF LITERATURE
According to scholars, customer churn can also be
categorized as customer attrition. It is the tendency of
customers to disengage from a brand or service,
thereby discontinuing their patronage and ceasing to
be paying clients of a particular business (Duan and
Ras 2022). There are many mistakes brands or service
providers can make, ranging from cumbersome
onboarding, where customers do not receive easy-to-
Dou, Y.
Customer Churn Prediction: An Empirical Research of Telecommunications Service Provider in the United States.
DOI: 10.5220/0012802000003885
Paper published under CC license (CC BY-NC-ND 4.0)
In Proceedings of the 1st International Conference on Data Analysis and Machine Learning (DAML 2023), pages 509-514
ISBN: 978-989-758-705-4
Proceedings Copyright © 2024 by SCITEPRESS – Science and Technology Publications, Lda.
509
understand information on product or service usage
and functionalities, to poor communication - such as
providing inadequate feedback or delays when
responding to customer queries. Nevertheless, as
asserted by Payne et al., the reality is that even loyal
customers will not tolerate a brand if they experience
one or several issues with it (Payne and Frow 2016).
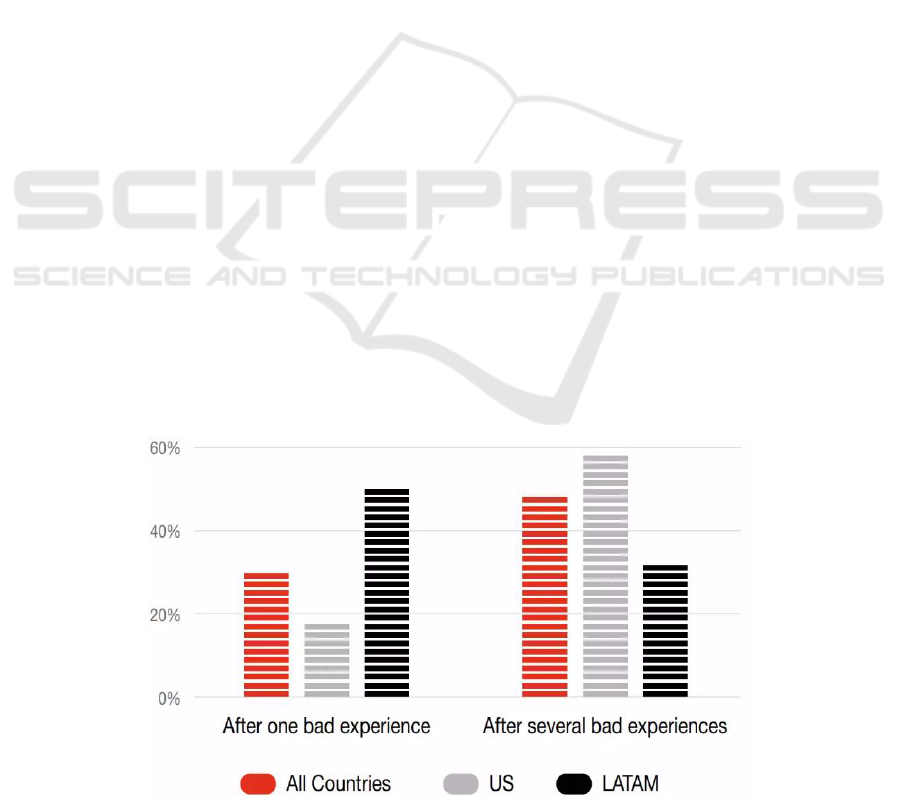
As shown in figure 1, 59 percent of U.S. respondents
who participated in the survey by
PricewaterhouseCoopers noted that they would
abandon a brand or any service after several negative
experiences, and 17 percent of them after just a single
negative experience (Coopers 2018).
Within the context of the telecom industry,
addressing the challenge of customer churn has spurred
scholarly inquiry, with researchers delving into various
facets, including the root causes of churn, strategies for
reclaiming customers, and the construction of
predictive models. Kim and Kwon's investigation has
shed light on the pivotal relationship between the scale
of the network and the churn propensity of telecom
customers (Kim and Kwon 2003). On the other hand,
Lee et al. conducted a comprehensive study exploring
the impact of customer satisfaction and switching costs
on the customer churn phenomenon within French
mobile communications (Lee and Feick 2001). Their
findings illustrate that when customer satisfaction
remains unchanged and switching costs increase
accordingly, customer churn may be less likely (Lee
and Feick 2001).
Delving into the intricate web of churn dynamics,
Ahn et al. discovered key factors influencing customer
churn (Ahn, Han and Lee 2006). Their focus included
monthly internet service provider consumption and
household income as influencing factors for customer
churn rates (Ahn, Han and Lee 2006). Amin et al. also
conducted an in-depth analysis of churn drivers from
the standpoints of enterprises, competitors, and
customers while concurrently proposing strategies for
winning lost customers (Amin et al 2017). This study
figured out the interplay between consumer sentiment,
switching barriers, customer satisfaction, and
customer retention, positing a positive correlation
between customer satisfaction and customer retention.
Advocating for a systematic approach, Davis et al.
emphasize the significance of tracing the root cause of
customer attrition in the quest for effective customer
win-back strategies (Davis and Lemon 2007). Echoing
this sentiment, Nasir posits that understanding the
rationale behind customer churn serves as a pivotal
variable in discerning the viability of customer
reclamation tactics, effectively providing a
fundamental basis for devising successful win-back
approaches (Nasır 2017). Through these scholarly
endeavors, a great understanding of customer behavior
and strategies for enhancing customer retention is
steadily cultivated, empowering businesses to make
well-informed decisions in the quest for sustained
growth while building customer allegiance.
3 METHODOLOGY
3.1 Data Collection and Preprocessing
The foundation of this study lies in a dataset sourced
from the Kaggle dataset (IBM dataset). Specifically,
telco customer churn data has been selected as the
focal point to predict customer churn within the
United States-based telecommunication service
provider. This dataset comprises 7043 observations
and encompasses various variables, capturing
demographic details, subscription specifics, contact
Figure 1: When do consumers stop interacting with brands they love (Picture credit: Original).
DAML 2023 - International Conference on Data Analysis and Machine Learning
510

information, service usage, and churn-related
attributes. However, the features chosen for this study
have been curated to encompass those demonstrating
potential influence on churn outcomes, including:
• Tenure Months: This feature reveals the time a
customer has subscribed to the service, which
may correlate with loyalty and the likelihood of
churn.
• Internet Service: By categorizing internet service
types into DSL, Fiber Optic, Cable, or None, this
classification inherently captures the impact of
internet service on user satisfaction and the
consequent likelihood of churn.
• Contract: This categorical variable denotes the
contract type of customers, namely Month-to-
Month, One Year, or Two Year, which could
play a pivotal role in churn prediction and might
significantly impact customer retention rates.
• Monthly Charge: As a key determinant of the
overall customer expense, the monthly charge
can potentially sway customers' decisions to stay
or leave.
• Churn Score: A continuous variable quantifying
churn likelihood, calculated via IBM SPSS
Modeler incorporating multiple factors. This
comprehensive metric serves as the bedrock for
predictive analysis.
Before analysis, a rigorous preprocessing phase
was undertaken to guarantee data quality and
suitability. This included identifying and treating
missing values, encoding categorical variables, and
conducting exploratory data analysis to identify
potential outliers and anomalies.
3.2 Hypothesis Formulation
In line with the research objectives, specific
hypotheses were formulated to guide the investigation
into the relationships between customer attributes and
churn scores. The hypotheses include:
• Hypothesis 1: Customers with longer tenure
months are expected to exhibit lower churn
scores, indicating higher loyalty.
• Hypothesis 2: Different types of internet service
will be associated with distinct churn scores,
with Fiber Optic service potentially leading to
higher churn scores.
• Hypothesis 3: Increasing monthly charges will
correspond to higher churn scores, suggesting
that cost considerations influence customer
attrition.
• Hypothesis 4: Contract type will impact churn
scores, with longer-term contracts (One Year,
Two Year) leading to lower churn scores.
3.3 Model Development
The research employs linear regression analysis to
elucidate the associations between customer attributes
and churn scores. Linear regression is chosen for its
suitability in modeling continuous outcomes, making
it apt to predict churn scores—a continuous variable
ranging from 0 to 100. The theoretical underpinning
of this model takes the form of a linear equation. As
shown in:
+++
++=
ContracteChMonthly
ServiceInternetMonthsTenureScoreurnC
43
210
arg
h
()
Where:
• Churn Score: The predicted churn score reflects
the estimated likelihood of customer churn.
• β₀: The intercept term representing the churn
score when all predictor variables are zero.
• β₁ to β₄: The coefficients attributed to each
predictor variable, indicating the magnitude of
influence on churn scores.
• Tenure Months: The duration of customer
subscription impacting the baseline churn score.
• Internet Service: The categorical variable
encodes different internet service modes,
contributing to churn score variations.
• Monthly Charge: The monthly financial
commitment of customers, influencing churn
score fluctuations.
• Contract: The categorical variable representing
contract types affecting the churn score.
The model's predictive prowess and explanatory
power are rigorously assessed through F-Statistic and
R-squared (R²) metrics. The F-Statistic gauges the
significance of the model, while the R² metric
quantifies the proportion of churn score variability
explained by the model.
4 RESULTS AND DISCUSSION
4.1 Descriptive Statistics and
Correlations
As shown in table 1, the descriptive statistics provide
insights into the central tendencies and variability of
the variables. Churn scores vary from 5 to 100, with
an average of around 58.7, indicating a moderate
likelihood of churn. Customers' tenure ranges from 0
to 72 months, averaging approximately 32.4 months.
Monthly charges span from 18.25 to 118.75, with an
average of about 64.76, suggesting a wide range of
pricing plans. The contract variable's mean of 1.69
Customer Churn Prediction: An Empirical Research of Telecommunications Service Provider in the United States
511

indicates a prevalence of month-to-month contracts.
Internet service shows a mean of 1.873, suggesting
Fiber Optic is the dominant choice, followed by DSL.
The Correlation analysis shown in table 2 reveals
relationships among variables. For instance, Tenure
Months' exhibits a negative correlation of -0.22 with
'Churn Score,' indicating that as the length of
subscription ('Tenure Months') increases, the
likelihood of churn ('Churn Score') tends to decrease.
Additionally, a slight positive correlation of 0.13
between 'Monthly Charges' and 'Churn Score' suggests
that higher monthly charges might contribute to a
higher propensity to churn. The correlation between
'Contract' and 'Churn Score' is -0.26, implying that
customers with longer-term contracts have lower
churn scores, aligning with the concept of contract-
based loyalty (Parahoo et al 2007). Meanwhile,
'Internet Service' displays a negligible correlation with
'Churn Score,' indicating a weak negative relationship
between the type of Internet service and churn
likelihood."
The scatter plot presented in Figure 2 showcases
the relationship between 'Tenure Months' and 'Churn
Score' within the dataset. Notably, there appears to be
a general trend of decreasing churn scores as 'Tenure
Months' increases, suggesting a potential negative
correlation between these two variables. This visual
representation provides an initial insight into the
potential influence of customer tenure on churn
likelihood."
Table 1: Descriptive Statistics.
Churn Score
Tenure Months
Monthly Charges
Contract
Internet Service
Min.
5.0
0.00
18.25
1.00
1.000
1
st
Qu.
40.0
9.00
35.50
1.00
1.000
Median
61.0
29.00
70.35
1.00
2.000
Mean
58.7
32.37
64.76
1.69
1.873
3
rd
Qu.
75.0
55.00
89.85
2.00
2.000
Max.
100.0
72.00
118.75
3.00
3.000
Table 2: Correlation Matrix.
Churn Score
Tenure Months
Monthly Charges
Contract
Internet Service
Churn Score
1.000000
-0.224987
0.133754
-0.262566
-0.022149
Tenure Months
-0.224987
1.000000
0.247900
0.671607
-0.030359
Monthly
Charges
0.133754
0.247900
1.000000
-0.074195
-0.323260
Contract
-0.262566
0.671607
-0.074195
1.000000
0.099721
Internet
Service
-0.022149
-0.030359
-0.323260
0.099721
1.000000
Figure 2: Scatter Plot (Picture credit: Original).
DAML 2023 - International Conference on Data Analysis and Machine Learning
512

4.2 Linear Regression Results
Table 3: Residuals.
Min
1Q
Median
3Q
Max
Residuals
-54.951
-16.448
-2.419
15.743
49.951
Table 4: Coefficients.
Estimate
Std. Error
T value
Pr(> | t |)
(Intercept)
58.576640
1.176264
49.799
<2e-16
Tenure Months
-0.157767
0.014628
-10.785
<2e-16
Monthly Charges
0.130967
0.009276
14.118
<2e-16
Contract
-3.422196
0.419323
-8.161
3.9e-16
Internet Service
1.306760
0.350031
3.733
0.000191
Gender Male
0.170166
0.487277
0.349
0.726937
The study linear equation is thus given in:
++
+=
ContracteChMonthly
ServiceInternetMonthsTenureScoreurnC
422.3-arg131.0
307.1158.0-h
0
()
As shown in Table 3 and Table 4, the linear regression
model offers insights into the relationships between
predictor variables and churn scores:
• Tenure Months (β₁): The negative coefficient of
-0.157767 indicates that, on average, for every
additional month of tenure, the churn score
decreases by 0.157767. This implies that longer
subscription periods are associated with
increased loyalty and reduced churn likelihood.
• Internet Service (β₂): The positive coefficient of
1.306760 suggests that customers using certain
internet service types (e.g., Fiber Optic) tend to
have higher churn scores, potentially due to
service quality issues. Customers with Fiber
Optic service might be more likely to consider
alternatives.
• Monthly Charge (β₃): The positive coefficient of
0.130967 signifies that for every unit increase in
monthly charge, the churn score increases by
0.130967. This suggests that higher monthly
charges might lead to a higher propensity to
churn, emphasizing the need for a balance
between cost and perceived value.
• Contract (β₄): The negative coefficient of -
3.422196 highlights that customers with longer-
term contracts (One Year, Two Years) exhibit
lower churn scores. This aligns with the notion
that extended contracts foster loyalty and
mitigate churn risks.
4.3 Hypothesis Testing
The hypotheses formulated were subjected to
hypothesis testing:
• Hypothesis 1: The p-value for Tenure Months
(β₁) is < 0.001, which is less than the significance
level (α = 0.05). Therefore, there is evidence to
reject the null hypothesis. Customers with longer
tenure months do indeed exhibit lower churn
scores, signifying higher loyalty.
• Hypothesis 2: The p-value for Internet Service
(β₂) is less than 0.001, providing strong evidence
to reject the null hypothesis. Different internet
service types are associated with distinct churn
scores, with Fiber Optic service potentially
leading to higher churn scores.
• Hypothesis 3: The p-value for Monthly Charge
(β₃) is 0.000191, indicating evidence to reject the
null hypothesis. An increase in monthly charges
does correspond to higher churn scores,
suggesting cost considerations influence
customer attrition.
• Hypothesis 4: The p-value for Contract (β₄) is
less than 0.001, allowing for rejecting the null
hypothesis. Contract type does impact churn
scores, with longer-term contracts leading to
lower churn scores.
4.4 Model Performance Evaluation
The model's predictive performance was evaluated
using the F-statistic and R-squared (R²). The obtained
F-statistic of 154.3, with an associated p-value < 2.2e-
16, signifies the model's overall statistical
significance. This suggests that the model collectively
can explain a substantial amount of the variability
observed in churn scores. The R² value of 0.09818,
while modest, indicates that approximately 9.8% of
the variability in churn scores is accounted for by the
predictor variables in the model.
5 CONCLUSION
In the ever-evolving telecommunications landscape,
where customer churn can significantly impact
business sustainability, the ability to predict customer
attrition emerges as a strategic imperative. This
research embarked on an empirical journey to predict
customer churn scores within a prominent United
States-based telecommunications service provider.
The intricate relationships between customer
Customer Churn Prediction: An Empirical Research of Telecommunications Service Provider in the United States
513

attributes and churn scores were illuminated through
the lens of linear regression analysis.
The findings reveal that subscription tenure,
internet service type, monthly charges, and contract
duration all contribute to the intricate tapestry of
customer churn. Longer tenure and extended contracts
were found to correlate with lower churn scores,
underscoring their role in fostering loyalty.
Conversely, certain internet service types and higher
monthly charges were associated with elevated churn
scores, highlighting the need for service quality and
pricing considerations.
However, this study is not without its limitations.
The linear regression model used in this study, while
effective, may oversimplify the complex relationships
between various factors contributing to customer
churn. Additionally, some factors like Payment
Method, Tech Support, or Online Security that might
affect the results are not considered in the research.
This may lead to an error in the study.
Future research could explore more sophisticated
predictive models or machine learning algorithms that
can capture non-linear relationships and interactions
between variables. Moreover, comparative studies
involving multiple service providers across different
geographical locations could provide more
comprehensive insights into customer churn patterns.
The linear regression model's adeptness in
predicting churn scores, coupled with the insights
derived, equips telecom providers with actionable
intelligence for crafting targeted retention strategies.
By leveraging this predictive tool, providers can
mitigate churn risks and bolster customer loyalty,
thereby navigating the dynamic telecommunications
landscape with acumen. This study serves as a
steppingstone towards more advanced predictive
models and broader comparative studies in the future.
REFERENCES
F. Reichheld, R. G. Markey Jr, and C. Hopton, “The loyalty
effect-the relationship between loyalty and profits”.
European business journal, vol. 12, no. 3, pp. 134, 2000.
Y. Duan, and Z. W. Ras, “Recommendation system for
improving churn rate based on action rules and
sentiment mining”. International Journal of Data
Mining, Modelling and Management, vol. 14, no. 4, pp.
287-308, 2022.
A. Payne, and P. Frow, “Customer relationship
management: Strategy and implementation”. In The
Marketing Book. Routledge, pp. 439-466, 2016.
PricewaterhouseCoopers. “Experience is everything:
Here’s how to get it right”. 2018.
H. S. Kim, and N. Kwon, “The advantage of network size
in acquiring new subscribers: a conditional logit
analysis of the Korean mobile telephony market”.
Information economics and policy, vol 15, no. 1, pp. 17-
33, 2003.
J. Lee, and L Feick, “The impact of switching costs on the
customer satisfaction ‐ loyalty link: mobile phone
service in France”. Journal of services marketing, vol.
15, no. 1, pp. 35-48. 2001.
J. H. Ahn, S. P. Han, and Y. S. Lee, “Customer churn
analysis: Churn determinants and mediation effects of
partial defection in the Korean mobile
telecommunications service industry”.
Telecommunications policy, vol. 30, no. 10-11, pp.
552-568, 2006.
A. Amin, S. Anwar, A. Adnan, M. Nawaz, K. Alawfi, A.
Hussain and K. Huang, “Customer churn prediction in
the telecommunication sector using a rough set
approach”. Neurocomputing, vol. 237, pp. 242-254,
2017.
L. M. Davis, and K. N. Lemon, “The wow factor: Creating
value through win-back offers to reacquire lost
customers”. Journal of Retailing, vol. 83, no. 1, pp. 47-
64, 2007.
S. Nasır, “Customer retention strategies and customer
loyalty”. In Advertising and Branding: Concepts,
Methodologies, Tools, and Applications. pp. 1178-
1201. 2017.
S. K. Parahoo, J. M. Aurifeille, and S. K. Sobhee,
“Contractual loyalty: leveraging partnerships to achieve
customer loyalty in global markets”. Globalization and
Partnerships: Features of Business Alliances and
International Cooperation, 2007.
DAML 2023 - International Conference on Data Analysis and Machine Learning
514
