
Clinical Record Analysis of Heart Failure Identification of Key
Features and Disease Prediction
Xiaoqing Yao
Department of Statistics, University of Illinois Urbana-Champaign, Champaign, U.S.A.
Keywords: Heart Failure, Identification of Features, Disease Prediction, Machine Learning.
Abstract: In contemporary society, disease prediction has become an important healthcare domain. Various advanced
techniques have been utilized to enhance the accuracy and efficiency of disease prediction. This paper
employs machine learning techniques, specifically logistic regression and random forest models, to predict
mortality rates associated with heart failure using a clinical dataset. The findings highlight the importance of
key physiological measures in predicting outcomes, including age, ejection fraction, serum creatinine, serum
sodium, and time. Both models showed highly accurate predictive power, with logistic regression slightly
better than random forest on the Area Under the Curve (AUC) indicator. The study contributes to the existing
literature on heart failure risk prediction and underscores the transformative potential of machine learning for
improving patient outcomes via precise risk stratification and early intervention. This study plays an essential
role in understanding how machine learning technology can be used to investigate the key features and disease
prediction of heat failure based on the previous clinical record.
1 INTRODUCTION
The burgeoning prevalence of heart failure as a severe
cardiovascular disease has compelled healthcare
professionals to seek more accurate methods for
patient prognosis. In the United States, about 6.5
million people aged over 20 years have heart failure,
which accounts for around 8.5% of heart disease
deaths (Heart Failure Society of America).
Undeniably, focusing on the study of heart failure is
critical for devising personalized and effective
treatments. Fortunately, notable strides have been
made in this regard, particularly through the
integration of machine learning algorithms for
predictive modeling.
In recent years, machine learning has been widely
used in various areas regarding heart failure issues;
research to date has identified key variables
influencing heart failure outcomes. For instance,
Chicco and Jurman applied machine learning
techniques to pinpoint serum creatinine and ejection
fraction as vital risk factors, demonstrating that
focusing on these alone could enhance predictive
accuracy (Chicco and Jurman 2020). Meanwhile,
Wittenbecher et al. identified specific lipid
metabolites as potential biomarkers for heart failure
risk in a lipidomics study (Wittenbecher et al 2020).
Furthermore, machine learning algorithms, such as
those employed by Li et al., have been instrumental
in predicting mortality rates in ICU-admitted patients
with heart failure, using advanced techniques like
XGBoost and LASSO regression for feature selection
(Li et al 2021). Goals et al. developed a Deep Unified
Network (DUNs) -based machine learning model that
uses longitudinal electronic medical record data to
predict readmission risk in patients with heart failure
within 30 days of discharge (Golas et al 2018). By
using percussion techniques and effective data
mining techniques, Ishaq et al. successfully improved
the accuracy of predicting the survival of patients
with heart failure. Among many models, they found
that the Extra Tree Classifier (ETC) model excelled
at predicting survival of heart disease patients with an
astonishing accuracy of 0.92622 (Ishaq et al 2021).
Nagavelli, Samanta, and Chakraborty explore a
machine learn-based heart disease detection model,
using XGBoost to test different decision tree
classification algorithms aimed at improving the
accuracy of heart disease diagnosis and identifying
risk factors strongly associated with heart failure
(Nagavelli et al 2022). In addition, Rao et al.
developed an interpretable Transformer-based deep
learning model that uses electronic health records to
predict the onset of heart failure within 6 months,
Yao, X.
Clinical Record Analysis of Heart Failure Identification of Key Features and Disease Prediction.
DOI: 10.5220/0012803900003885
Paper published under CC license (CC BY-NC-ND 4.0)
In Proceedings of the 1st International Conference on Data Analysis and Machine Learning (DAML 2023), pages 297-304
ISBN: 978-989-758-705-4
Proceedings Copyright © 2024 by SCITEPRESS – Science and Technology Publications, Lda.
297

revealing known and new heart failure risk factors
(Rao et al 2021). Clearly, professionals have noticed
the great function of machine learning and made
breakthroughs through its application in medical
analysis related to heart failure.
Several machine learning models, such as
Random Forest and Logistic Regression, have
demonstrated their efficacy across domains. For
example, Ishaq et al. utilized Random Forest along
with Synthetic Minority Over-sampling Technique
(SMOTE) to achieve high predictive accuracy (Ishaq
et al 2021), while Karthikeyan et al. and Joo et al.
successfully applied machine learning to COVID-19
mortality and cardiovascular disease prediction,
respectively (Karthikeyan et al 2020 & Joo et al
2020). Those indicate that machine learning could be
an effective approach to recognizing and predicting
medical symptoms and features.
Given the complexity of heart failure as a medical
condition and the promise of machine learning
algorithms in clinical prediction, our study aims to
contribute by developing a comprehensive predictive
model using 12 key clinical features. This approach is
intended to advance the current understanding and to
provide a more robust tool for clinical applications in
heart failure management.
The structure of this study is as follows: Chapter
2 delves into the meticulous selection and preparation
of clinical features for the predictive model through
data analysis. Chapter 3 presents our predictive
outcomes regarding the occurrence of heart failure
based on Logistic Regression and Random Forest
models. Finally, this paper will conclude and discuss
the study’s findings, implications, limitations, and
avenues for future research. Through this research
framework, this paper aims to fortify the arsenal of
predictive tools available for assessing the risk and
management of heart failure mortality.
2 ANALYSIS OF FACTORS
INFLUENCING HEART
FAILURE INCIDENCE
2.1 Data
This paper sourced patient medical records from the
UCI Machine Learning Repository to investigate the
key determinants of heart failure. Specifically, the
dataset encompasses the medical histories of 299
patients diagnosed with heart failure and is structured
to include 12 predictive variables along with a single
target variable labeled as DEATH EVENT. Each
record is thus a compilation of 13 distinct clinical
features. A detailed description of the variables can be
found in Table 1.
For a nuanced analysis, this study adopted
different statistical approaches for categorical and
continuous variables. For the categorical variables,
this paper focused on frequency distribution, detailing
the count and percentage of patients falling into each
category. That offers insights into the prevalence of
specific conditions, such as anemia or diabetes, among
the patient cohort.
As shown in Figure 1 and Figure 2, the cohort
manifests a blend of demographics and medical
conditions. Approximately 57% of the patients do not
exhibit anemia, while around 58% are free from
diabetes. High blood pressure is absent in about 65%
of the patients. The gender distribution leans toward
males, constituting approximately 65% of the dataset.
Non-smokers make up around 68% of the cohort.
As shown in Table 2, patients' ages range from 40
to 95 years, with an average age of about 61 years.
Creatinine Phosphokinase (CPK) levels vary widely
from 23 to 7861 mcg/L, with an average level close
to 582 mcg/L. The Ejection Fraction averages
Table 1: Variables Table.
Variable Name
Role
Description
Units
age
Feature
age of the patient
years
anaemia
Feature
decrease of red blood cells or hemoglobin
creatinine_phosphokinase
Feature
level of the CPK enzyme in the blood
mcg/L
diabetes
Feature
if the patient has diabetes
ejection_fraction
Feature
percentage of blood leaving the heart at
each contraction
%
high_blood_pressure
Feature
if the patient has hypertension
platelets
Feature
platelets in the blood
kiloplatelets/mL
serum_creatinine
Feature
level of serum creatinine in the blood
mg/dL
serum_sodium
Feature
level of serum sodium in the blood
mEq/L
sex
Feature
woman or man
smoking
Feature
if the patient smokes or not
time
Feature
follow-up period
days
death_event
Target
if the patient died during the follow-up
period
DAML 2023 - International Conference on Data Analysis and Machine Learning
298
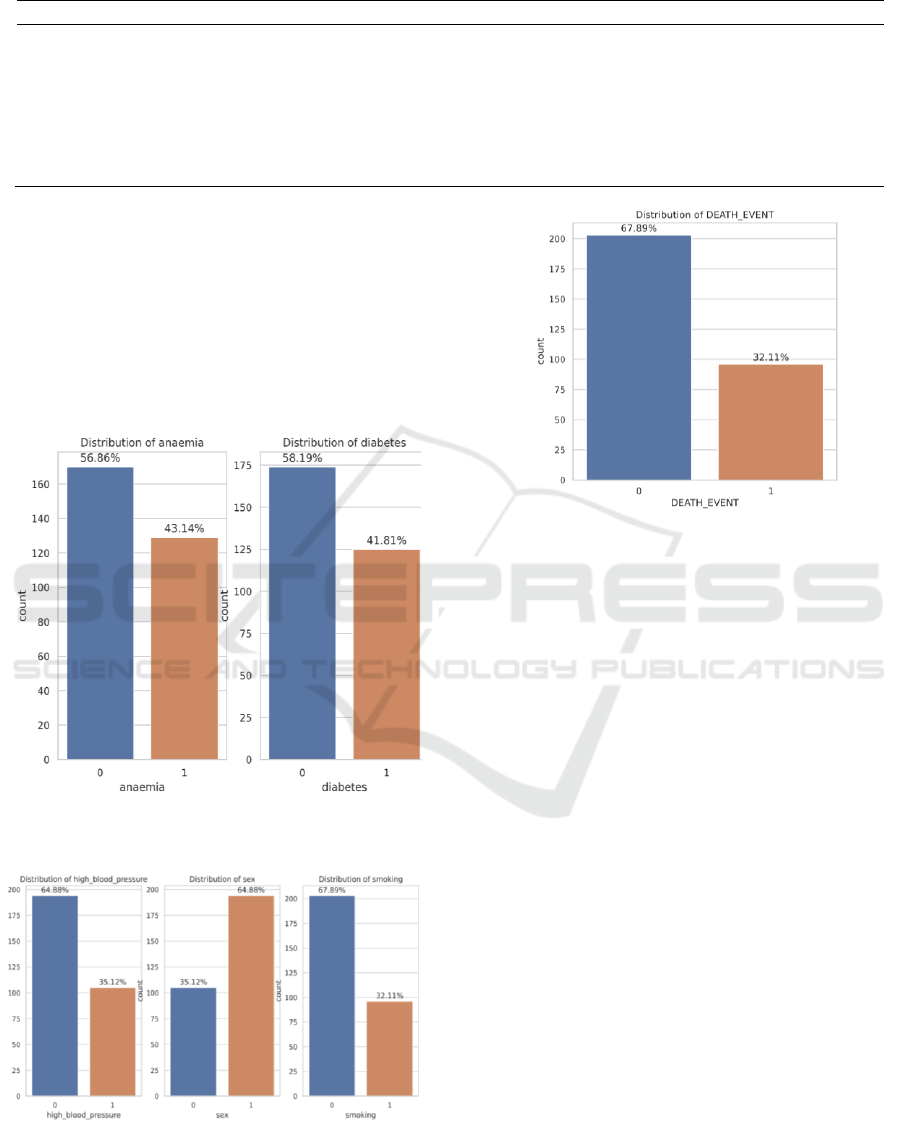
Table 2: Overview of Continuous Predictors.
Variable
Mean
Std Deviation
Min
Q1
Q3
Max
age
60.83
11.87
40
51
70
95
creatinine phosphokinase
581.84
968.66
23
116.5
582
7861
ejection fraction
38.08
11.82
14
30
45
80
platelets
263358
97640.55
25100
212500
303500
850000
serum creatinine
1.39
1.03
0.5
0.9
1.4
9.4
serum sodium
136.63
4.405
113
134
140
148
time
130.26
77.48
4
73
203
285
approximately 38%, ranging between 14% and 80%.
Platelet counts range from 25,100 to 850,000 kilo/mL,
with a mean of around 263,358 kilo/mL. Serum
creatinine and sodium levels display averages of
approximately 1.39 mg/dL and 137 mEq/L,
respectively. The follow-up period varies substantially
among the patients, averaging about 130 days. Most
notably, about 68% of the patients survived the
follow-up period, while approximately 32% did not.
Figure 1: Distribution of anaemia & Diabetes (Picture credit:
Original).
Figure 2: Distribution of high pressure & sex & smoking
(Picture credit: Original).
Figure 3: Frequency Distribution of Target Variables
(Picture credit: Original).
As can be seen from Figure 3, 32.11% of patients
died during the follow-up period, 67.89% of patients
did not die, and the ratio of deaths to non-deaths was
about 3:7. Therefore, this data is not an unbalanced
data set, and there is no need to balance the data.
Finally, the data has no missing values after
examination, so the analysis can continue.
2.2 Methodology and Model
Establishment
At present, there are 12 feature variables in this paper.
Considering that not all features extracted can play a
role in the final classification effect, and too many
redundant features will increase the training time of
the model, this paper will carry out feature selection
next. On the one hand, it is beneficial to improve the
accuracy of the classification algorithm. On the other
hand, it is also of great significance to explore the key
factors causing death by heart failure.
Binary variables: For the screening of Binary
variables, consider using information value (IV value)
to observe the strength of the correlation between the
feature variable and the target variable. It is generally
believed that when the IV value is greater than 0.02, it
is considered that there is a strong correlation between
the feature variable and the target variable. At the
Clinical Record Analysis of Heart Failure Identification of Key Features and Disease Prediction
299

same time, in order to synthesize the results of
comparison, statistical inference is often used. To test
the Chi-square test of the independence of two
categorical variables, taking "anaemia" as an example,
the following hypothesis is established:
H_0: anaemia is independent of whether the
patient is death from heart failure
H_1: anaemia is not independent of whether the
patient is death from heart failure
Given the corresponding significance level α=
0.05, the chi-square value of the χ^2 test and the
corresponding P-value under the corresponding
significance level are observed, and the conclusion of
rejecting or retaining the original hypothesis H_0 is
given, and then the relationship between the two
qualitative variables is judged.
Continuous Variables: To accurately screen the
core quantitative variables that cause heart rate death,
this paper combined the advantages of different
feature selection methods and selected three methods,
point binomial correlation coefficient, generalized
cross-validation, and Boruta method based on random
forest, respectively, to screen quantitative variables
such as age. When variables are selected by two or
more methods, the selection variable is regarded as an
input quantitative variable.
In heart failure dataset, the Point-Biserial
Correlation Coefficient can be employed to assess the
relationship between binomial predictors like
'anaemia' or 'smoking' and continuous outcomes such
as 'age' or 'ejection fraction.' That specialized Pearson
correlation offers insights into how these different
types of variables interact. Then, subset selection will
be performed, and these subsets will be evaluated
using generalized cross-validation (GCV).
Specifically, this paper will traverse all possible
subsets of features, using a ridge regression model for
each subset and calculating its corresponding GCV
value. The number of feature subsets is 2^7=128
possible subsets. Furthermore, the Boruta algorithm
can be utilized to rigorously evaluate the importance
of each feature, including both continuous and
categorical variables, by comparing them with
randomly generated "shadow" features, enhancing the
robustness of our feature selection.
2.3 Analysis of Results
The feature selection process was conducted using
multiple methodologies to ensure robustness and
validity. As shown in Table 3, for continuous
variables, the Point-Biserial Correlation Coefficient,
Generalized Cross-Validation (GCV), and the Boruta
method based on Random Forest were employed. All
these methods consistently highlighted the importance
of age, ejection fraction, serum creatinine, serum
sodium, and time as significant predictors for the
occurrence of a death event. These features were
selected by at least two of the three methods used,
substantiating their relevance in the predictive model.
As shown in Table 4, for the categorical variables,
Chi-square tests and Information Value (IV) were
used for feature selection. The Chi-square tests did not
Table 3: Selection of Quantitative Variables.
Point Biserial
GCV
Boruta
Number of Methods
Final Selected
age
TRUE
FALSE
TRUE
2
TRUE
creatinine phosphokinase
FALSE
FALSE
FALSE
0
FALSE
ejection fraction
TRUE
FALSE
TRUE
2
TRUE
platelets
FALSE
FALSE
FALSE
0
FALSE
serum creatinine
TRUE
FALSE
TRUE
2
TRUE
serum sodium
TRUE
FALSE
TRUE
2
TRUE
time
TRUE
FALSE
TRUE
2
TRUE
Table 4: Selection of Binary Variables.
Chi-square
(p-value < 0.05)
IV (IV >= 0.02)
Num Methods
Final Selected
anaemia
FALSE
TRUE
1
FALSE
diabetes
FALSE
FALSE
0
FALSE
High blood pressure
FALSE
TRUE
1
FALSE
sex
FALSE
FALSE
0
FALSE
smoking
FALSE
FALSE
0
FALSE
DAML 2023 - International Conference on Data Analysis and Machine Learning
300

find any of the categorical variables to be significantly
associated with the death event. Similarly, the
Information Value (IV) analysis identified all the
categorical variables (anaemia, diabetes, high blood
pressure, sex, and smoking) as weak predictors, with
IV values less than 0.02, except for anaemia and high
blood pressure. Based on these analyses, it can be
concluded that the categorical variables are relatively
weak predictors for the occurrence of a death event
compared to the selected continuous variables.
Based on the comprehensive analysis, the final set
of variables chosen for modeling includes the
following continuous variables: age, ejection fraction,
serum creatinine, serum sodium, and time. No
categorical variable was strong enough to be included
in the final model.
3 PREDICTION OF HEART
FAILURE INCIDENCE
3.1 Methodology and Model
Establishment
In the current study focused on predicting heart failure-
related death events, this paper employed two distinct
machine learning models—Logistic Regression and
Random Forest—to assess the predictability of
selected clinical features.
The Logistic Regression model was trained using
the default optimization algorithm and employed for
predicting the test set. Its key advantages lie in model
interpretability and computational efficiency. This
paper evaluated the model's performance using various
metrics, including accuracy, F1 score, precision, recall,
and AUC.
On the other hand, the Random Forest model is
more complex, involving an ensemble of multiple
decision trees. Through the use of grid search and 10-
fold cross-validation, this paper identified the optimal
combination of hyperparameters to achieve the best
predictive performance. The Random Forest model not
only allowed to capture potential nonlinear patterns in
the data but also provides additional insight into feature
importance, help people understand which variables
play a crucial role in predicting heart failure-related
death events.
The Logistic Regression model served as a
straightforward yet robust baseline for our predictions.
However, in order to capture potential nonlinear
relationships and interactions among the features, this
paper also employed a Random Forest model. The
Random Forest model underwent hyperparameter
tuning using grid search with 10-fold cross-validation
to identify the optimal parameter settings. The model
that demonstrated the best performance had
n_estimators=100, max depth=10, min samples
split=5, and min samples_leaf=1. These
hyperparameters indicate the complexity and depth of
decision trees within the Random Forest, tailored to
our specific dataset.
3.2 Analysis of Results
Both Logistic Regression and Random Forest models
were used to predict heart failure-related deaths. As
shown in Table 5, The logistic regression model, as a
linear algorithm, shows quite reasonable predictive
performance, especially in terms of Accuracy (78.3%)
and AUC (0.746).
On the other hand, the random forest model, as an
ensemble learning method, is inferior to the logistic
regression model in many aspects. In particular,
Random Forest fared slightly worse in terms of AUC
(0.703) and Accuracy (73.3%). However, it is
important to note that both models performed equally
in terms of Recall (0.52), meaning that the two models
were similar in their ability to identify positive (death
from heart failure).
As shown in Figure 4 and Figure 5, these
performance indicators further emphasize the
effectiveness of the feature set selected through
rigorous statistical testing (which mainly includes
continuous variables like age, ejection fraction, serum
sodium, serum creatinine and time). In both models,
none of the categorical variables behaved strongly
enough to be included in the final model. This
observation underscores the importance of these
physiological parameters in predicting mortality
associated with heart failure. As a result, this analysis
provides healthcare professionals with valuable
insights to identify key clinical features that
significantly impact patient outcomes.
Table 5: Metrics of Test Data.
Model
TN
FP
FN
TP
Accuracy
F1 Score
Precision
Recall
AUC
Logistic Regression
34
1
12
13
0.7833
0.666667
0.928571
0.52
0.745714
Random Forest
31
4
12
13
0.7333
0.619048
0.764706
0.52
0.702857
Clinical Record Analysis of Heart Failure Identification of Key Features and Disease Prediction
301
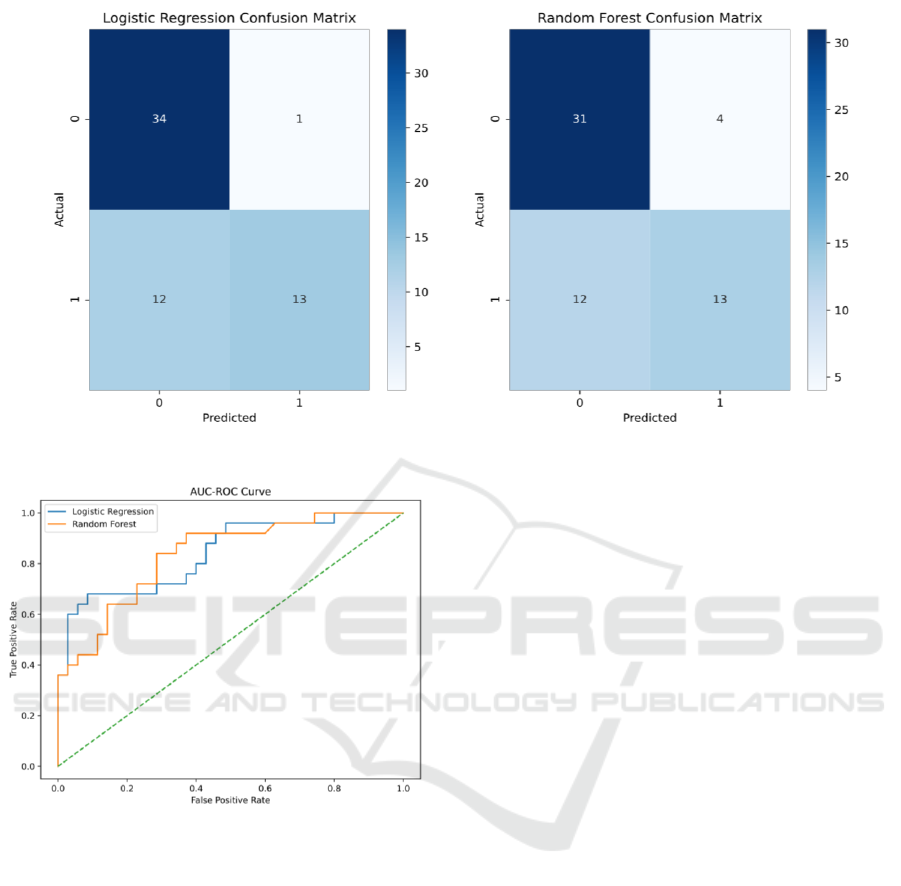
Figure 4: Confusion Matrix (Picture credit: Original).
Figure 5: ROC Curve (Picture credit: Original).
5 CONCLUSION
This study applied machine learning algorithms to
predict factors influencing mortality rates associated
with heart failure. Utilizing a clinical dataset, we
employed both logistic regression and random forest
modeling techniques to explore the predictive power
of specific indicators. This paper emphasizes the
critical roles of certain physiological variables,
including age, serum creatinine, serum sodium,
ejection fraction, and time. Both models exhibited
robust performance in terms of predictive accuracy;
however, the logistic regression model slightly
outperformed the random forest model in AUC
metrics. This enhanced performance suggests that
machine learning models may be more effective in
handling big data and nonlinear relationships, while
traditional logistic regression models appear superior
in capturing interdependencies between various
clinical features.
Not only does this study expand the existing body
of knowledge in the area of heart failure risk
prediction, but it also highlights the transformative
potential of machine learning in improving patient
outcomes through precise risk stratification and early
intervention. While this study provides a solid
foundation, it's crucial to acknowledge certain
limitations. The dataset used may not capture the full
spectrum of influencing variables, and the issue of
model interpretability remains a significant challenge,
which could hinder the seamless translation of our
research findings into actionable clinical decisions.
REFERENCES
Heart Failure Society of America. Heart failure facts &
information. https://hfsa.org/patient-hub/heart-failure-
facts-information
D. Chicco, and G. Jurman, Machine learning can predict
survival of patients with heart failure from serum
creatinine and ejection fraction alone. BMC Medical
Informatics and Decision Making, vol. 20, no. 1, pp. 16,
2020.
C. Wittenbecher, F. Eichelmann, E. Toledo, et al. Lipid
Profiles and Heart Failure Risk: Results from Two
Prospective Studies. Circulation Research, vol. 127, no.
12, pp. 1591-1601. 2020.
DAML 2023 - International Conference on Data Analysis and Machine Learning
302

F. Li, H. Xin, J.-D. Zhang et al. Prediction model of in-
hospital mortality in intensive care unit patients with
heart failure: machine learning-based, retrospective
analysis of the MIMIC-III database. BMJ Open, vol. 11,
no. 7, pp. 044779. 2021.
S. Golas, T. Shibahara, S. Agboola, et al. A machine
learning model to predict the risk of 30-day
readmissions in patients with heart failure: a
retrospective analysis of electronic medical records
data. BMC Medical Informatics and Decision Making,
vol. 18, no. 1, 2018.
A. Ishaq, S. Sadiq, M. Umer, et al. Improving the Prediction
of Heart Failure Patients’ Survival Using SMOTE and
Effective Data Mining Techniques. 2021, IEEE Access.
U. Nagavelli, D. Samanta and P. Chakraborty, Machine
Learning Technology-Based Heart Disease Detection
Models. Journal of Healthcare Engineering, 2022.
S. Rao, Y. Li, R. Ramakrishnan et al. An Explainable
Transformer-Based Deep Learning Model for the
Prediction of Incident Heart Failure. IEEE Journal of
Biomedical and Health Informatics. 2021.
A. Ishaq, S. Sadiq, M. Umer, et al. Improving the Prediction
of Heart Failure Patients’ Survival Using SMOTE and
Effective Data Mining Techniques. IEEE Access, vol.
9, pp. 3064084-3064095, 2021.
A. Karthikeyan, A. Garg, P. Vinod, U. Priyakumar,
Machine Learning Based Clinical Decision Support
System for Early COVID-19 Mortality Prediction.
Frontiers in Public Health, vol. 9, pp. 626697-626710.
2020.
G. Joo, Y. Song, H. Im, J. Park, Clinical Implication of
Machine Learning in Predicting the Occurrence of
Cardiovascular Disease Using Big Data. Nationwide
Cohort Data in Korea, vol. 8, pp. 148493-148503, 2020.
APPENDIX
Table 6: Test the Predicted Results of the Set.
ID
True Label
Logistic Regression Prediction
Random Forest Prediction
281
0
0
0
265
0
0
0
164
1
0
0
9
1
1
0
77
0
0
0
278
0
0
0
93
1
1
0
109
0
0
0
5
1
1
0
173
0
0
0
97
0
0
0
195
1
0
0
184
1
0
0
154
0
0
0
57
0
0
0
60
1
0
0
147
0
0
0
108
0
0
0
63
1
0
0
140
1
0
0
155
0
0
0
104
0
0
0
247
0
0
0
46
1
1
0
42
1
1
0
275
0
0
0
280
0
0
0
116
0
0
0
213
1
0
0
236
0
0
0
17
1
1
0
239
0
0
1
33
0
1
1
24
1
1
1
Clinical Record Analysis of Heart Failure Identification of Key Features and Disease Prediction
303

45
1
1
1
7
1
0
0
113
1
0
0
194
1
0
0
111
0
0
0
92
0
0
0
75
1
1
0
82
1
1
0
118
0
0
0
76
0
0
0
129
0
0
0
197
0
0
0
210
0
0
0
288
0
0
1
219
0
0
1
178
0
0
1
129
0
0
0
197
0
0
0
210
0
0
0
288
0
0
1
219
0
0
1
178
0
0
1
144
1
1
1
186
1
0
1
84
1
0
1
248
0
0
1
277
0
0
1
73
0
0
1
244
0
0
1
25
1
1
1
209
0
0
1
59
1
1
1
DAML 2023 - International Conference on Data Analysis and Machine Learning
304
