
Machine Learing-Based Heart Disease Prediction: Insights and
Comparative Analysis
Yawen Chang
1
, Xiaoyi Chen
2
and Lingzhi He
3
1
Chemical and Biological Engineering, Faculty of Applied Science, University of British Columbia, Vancouver, Canada
2
School of Mathematics and Applied Mathematics, University of Chinese Academy of Sciences, Beijing, China
3
School of Mathematics, Nanjing University of Science and Technology, Nanjing, China
Keywords: Heart Disease, Machine Learning, Data Analysis, Prediction Model.
Abstract: The incidence of heart attacks has increased rapidly all over the world. This research offers an in-depth
discussion of the performance and implications of various machine learning methods for heart disease
prediction, despite the existing comparative analyses in the literature. In this research, three machine learning
algorithms, K-Nearest Neighbor (KNN), Support vector machine (SVM) and Adaptive Boosting, were
evaluated. They were used to deal with the data about heart disease. The dataset comprised 303 patient records
with 14 distinct attributes, including age, sex, chest pain type etc. Key findings included the influence of age
and sex on heart disease risk, with females showing a higher susceptibility. Various chest pain types and
exercise-induced angina were linked to different heart attack probabilities. Moreover, the study highlighted
the significance of maximum heart rate, ST segment slope, and ST depression values in risk assessment.
Among three machine learning algorithms, SVM achieved the highest accuracy while KNN exhibited better
sensitivity for detecting patients with heart disease. The research underscored the importance of selecting
appropriate algorithms based on specific goals, offering insights for early heart disease diagnosis and
treatment.
1 INTRODUCTION
In modern society, the incidence of heart attacks has
increased rapidly all over the world. For example, in
developed regions such as North America, many
people died from heart attack, which is widely caused
by acute myocardial infarction (AMI) or myocardial
infarction (MI) in the last century. In 1975, the case-
fatality rate of AMI was 40.4% among patients no
younger than 75 years old in Massachusetts, USA
(Goldberg, et al 1989). Despite the improved medical
conditions and treatments of MI during 1975-1984,
the case-fatality rate was still 22.7% (Goldberg, et al
1989), meaning MI was still challenging to the
medical field. In Canada, there were a total of 1286354
(5%), 536548 (2.1%), 483260 (1.9%) and 264060
(1.0%) people (no younger than 12 years old) who had
heart disease, MI, angina and congestive heart failure
correspondingly within 25787334 dominators (Chow
et al 2005). In 1999, 36% of all deaths in Canada were
due to cardiovascular disease (CVD), and CVD was
the top 1 cause of mortality nationally (Chow et al
2005). The examples from North America represented
the high risk of heart attack and the high prevalence of
heart problems. To address this challenge, numerous
scholars and researchers have explored factors that
may be predictive or potentially linked to the risk of
heart attacks. A lot of research focused on the impacts
of age, sex, angina history etc., and some researchers
introduced the increased risk of heart attack due to
medicines, such as hormonal contraceptive mentioned
by Zakharova et al 2011.. Moreover, some novel
research also considered potential markers of risk for
cardiovascular occlusion then heart attack, for
example, lipoprotein(a) levels, total plasma
homocysteine, fibrinolytic capacity, fibrinogen, and
high-sensitivity C-reactive protein (Ridker 1999).
This research aims to provide directions to clinical
treatments and effective prevention through
mathematical and statistical modelling and analyses of
an open-source dataset, recording 14 attributes of 303
patients, obtained from Kaggle.
In similar directions, scholars conducted the
following research. Support vector machine (SVM) is
a good method to separate data without large
quantities. Wang et al. used a model of SVM (Wang,
Chang, Y., Chen, X. and He, L.
Machine Learing-Based Heart Disease Prediction: Insights and Comparative Analysis.
DOI: 10.5220/0012805000003885
Paper published under CC license (CC BY-NC-ND 4.0)
In Proceedings of the 1st International Conference on Data Analysis and Machine Learning (DAML 2023), pages 305-314
ISBN: 978-989-758-705-4
Proceedings Copyright © 2024 by SCITEPRESS – Science and Technology Publications, Lda.
305

Guo and Yan 2022), which eventually aimed at
finding the optimal hyperplane that could divide
different classes of data. Moreover, the radial basis
kernel function was selected to construct SVM
classifier. However, the algorithm equally considered
13 characteristic variables, leading to a rather complex
model. Zhang used logistic regression and decision
tree. Logistic regression could be used to interpret the
relationship between groups of variables (Zhang
2023), and a decision tree is an effective method of
supervised learning. The model showed the key
factors in the diagnosis of heart attack but did not go
further to obtain an accurate model which could be
directly used for classification. Xin et al. applied the
feature selection algorithm (Xin et al 2022), and they
combined diverse types of machine learning
algorithms. They aimed at obtaining the optimal
feature crosses and provided two different methods of
feature ordering. The orders of feature could help in
dimensionality reduction, attributing to a more
accurate model. The model was exhaustive but relied
tremendously on the exactitude of former research.
Zhang et al. also used an algorithm based on the
feature selection algorithm (Zhang and Hu 2022).
Moreover, they innovatively proposed the usage of a
probabilistic neural network (PNN) and genetic
algorithm (GA) in the establishment of the model. GA
could patently improve the accuracy of the model.
Also, more complex combinations and
comparisons of different methods and algorithms are
introduced. One of the datasets from the UCI
repository on heart disease is widely used by
researchers. Ramesh et al. used the dataset with the
isolation forest method to select the most important
features and indicators from the dataset and
standardized the data to improve accuracy. The
research was based on supervised learning algorithms
such as Naive Bayes, Support Vector Machine,
Logistic Regression, Decision Tree Classifier,
Random Forest, and K-Nearest Neighbor (KNN) to
predict the probability of heart disease. They
compared the performance, sensitivity, precision,
accuracy, and F_1score of different algorithms and
found that the KNN algorithm gave the highest
accuracy of 86.89% with eight neighbors (TR e al
2022). However, Shaji also used similar data mining
techniques. The research compared the performance,
sensitivity, precision, accuracy, and F_1 score of
different algorithms and found that the SVM
algorithm gave the best results (Mamatha and Shaji
2019). Bharti et al. used different machine learning
and deep learning models to diagnose and predict
heart disease. The research used the isolation forest
method to deal with some irrelevant features and
normalized the data to get better results with deep
learning methods and achieved an accuracy of 94.2%
(Bharti et al 2021). And Raju et al. used decision tree,
neural network, Bayesian classifier, SVM, association
rule, SVM classification, etc. The research claimed
that the SVM algorithm gave the best results (Raju et
al 2018).
In this regard, this research aimed to find a suitable
dimensionality reduction method, using machine
learning related methods, training the data set, and
finding a better prediction method.
2 METHODS
2.1 Data Sources
The dataset used in this research was obtained from
the Kaggle website. This dataset Heart Attack
Analysis and Prediction Dataset was updated in 2021.
The original dataset was saved in .CSV format.
2.2 Variable Selection
The dataset used in this research has 303 observations
and 14 variables with no missing value. Among all 14
variables, 13 variables are predictive variables, and a
discrete variable is the predictor in this research (Table
1).
The variable “output”, which is the predictor,
refers to the chance of the heart being attacked. The
value 0 denotes low chance whereas 1 denotes high
chance. The values are related to the angiographic
disease status where value 0 indicates “less than 50%
diameter narrowing” and value 1 indicates “more than
50% diameter narrowing”. Moreover, a specific
description of 13 predictive valuables is presented in
Table 1.
As for “sex”, value 1 stood for male and value 0 stood
for female. As for “cp”, value 0 stood for typical
angina, value 1 stood for atypical, value 2 stood for
non-anginal pain and value 3 stood for asymptomatic.
As for “fbs”, value 1 denoted true whereas value 0
denoted false. As for “restecg”, value 0 stood for
normal, value 1 stood for having ST-T wave
abnormality and value 2 stood for showing probable
or definite left ventricular hypertrophy by Estes’
criteria. As for “exng”, value 1 stood for yes and value
0 stood for no. As for “slp”, value 0 denoted increase,
value 1 denoted flat whereas value 2 denoted decrease.
DAML 2023 - International Conference on Data Analysis and Machine Learning
306

Table 1: Data set description.
Term
Type
Meaning
age
sex
cp
trtbps
chol
fbs
restecg
thalachh
exng
oldpeak
slp
caa
thall
numeric
categorial
categorial
numeric
numeric
categorial
categorial
numeric
categorial
numeric
categorial
numeric
categorial
Age of the patient
Sex of the patient
Chest pain type
Resting blood pressure (in mm Hg)
Cholesterol in mg/dl fetched via BMI sensor.
Fasting blood sugar > 120mg/dl
Resting electrocardiographic results
Maximum heart rate achieved.
Exercise induced angina.
ST depression induced by exercise relative to rest.
The slope of the peak exercise ST segment
Number of major vessels colored by fluoroscopy.
Thal rate
2.3 Method Introduction
2.3.1 Preprocessing
This research aimed to transform the raw data into a
suitable format for data mining, using data
preprocessing techniques, which could improve the
data quality and efficiency, and the model
performance and reliability. This research used z-
score normalization to standardize the data set, as it
applied methods like SVM, KNN, and K-means. This
method made the data follow a standard normal
distribution, with zero mean and one standard
deviation. The formula was:
(1)
Where was the mean and was the standard
deviation of the sample data.
This research proposed to use information gain to
rank and filter the dimensions by their importance for
a relatively small and high-dimensional data set,
which could improve the training efficiency.
Information gain was the change of information
before and after splitting the data set. To calculate
information gain, the research first defined the
information of symbol
as:
(2)
Entropy described the uncertainty of an event,
measured in bits. If each event had a probability of
, then the entropy of the event was
defined as:
(3)
Conditional entropy measured the uncertainty of
event Y under a certain condition X, denoted as
. It is defined as:
(4)
Information gain was the degree of decrease in the
uncertainty of an event after knowing a certain
condition. It was written as
, which was
calculated by subtracting the conditional entropy from
the entropy, as follows:
(5)
2.3.2 Model Construction
This research proposed to use three machine learning
methods to build models for predicting the condition
of patients with heart disease and comparing their
prediction accuracy. The methods were: KNN, SVM,
and Adaptive Boosting (Adaboost).
KNN was a method that classified or predicted
based on the distance between feature values. It used
the training data to divide the feature space and used
the result as the model. The output was the label or
value of the input vector. SVM was a supervised
algorithm that found an optimal hyperplane to
separate the data, maximizing the margin between
classes, and improving generalization. It solved a
convex quadratic problem, finding the hyperplane
parameters and support vectors. Adaboost was an
ensemble algorithm that built a strong classifier by
combining weak classifiers and enhancing accuracy
and robustness.
Machine Learing-Based Heart Disease Prediction: Insights and Comparative Analysis
307
3 RESULTS AND DISCUSSION
3.1 Descriptive Data Analysis
The dataset contained 14 categories, 13 predictive
variables and a discrete variable, for 303 observations.
Ahead of the implementation of methods mentioned
in Section 2.3, descriptive data analysis was presented
in this section.
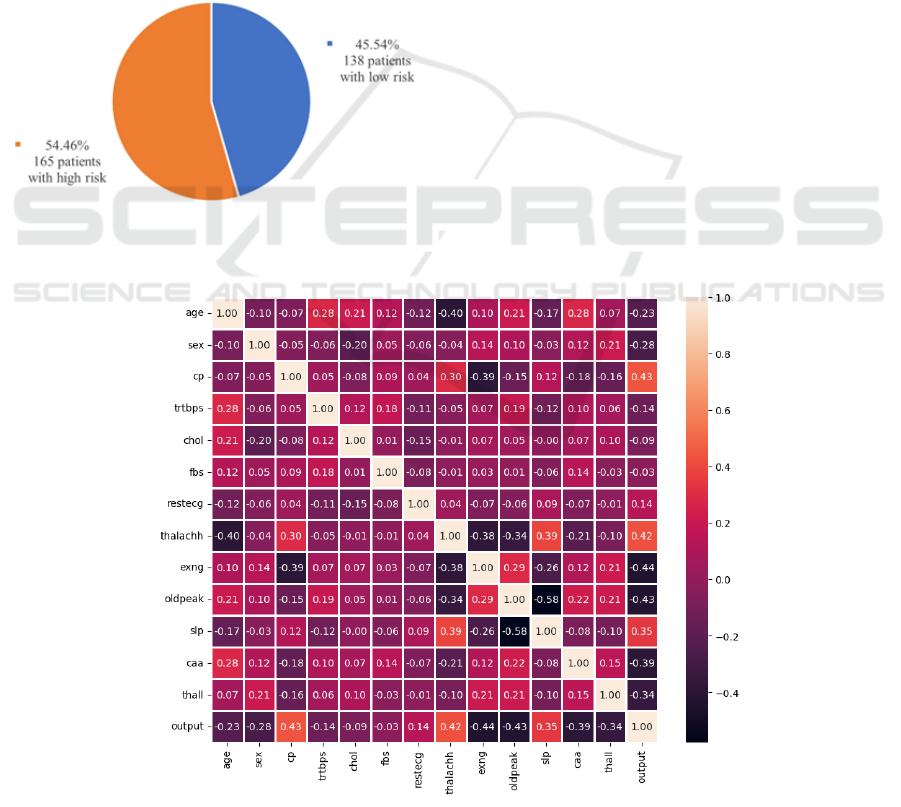
3.1.1 Overall data
Among 303 observations, 138 patients (45.54%) were
evaluated for a low risk of heart attack, and 165
patients (54.46%) were evaluated for a high risk of
heart attack. Figure 1 showed the overall distribution
of risk distributions.
Figure 1: Overall distribution of risk levels among 303
observations (figure credits: original).
A heat map including 14 categories was generated
using Python and was shown in Figure 2. The positive
values indicated positive correlations, while negative
values indicated negative correlations. Meanwhile, the
larger the absolute values in the cell, the stronger the
correlation between the two variables.
From the Figure 2 below, there were several
observations worth noticing. ‘cp’ (chest pain type),
‘thalachh’ (maximum heart rate achieved) and ‘slp’
(the slope of the peak exercise ST segment) had strong
positive correlations with the output; ‘exng’ (exercise
induced angina occurrence), ‘oldpeak’ (ST depression
induced by exercise relative to rest), ‘caa’ (number of
major vessels colored by fluoroscopy) and ‘thall’ (thal
rate) had strong negative correlations with the output.
3.1.2 Age and Sex Categories
There were two general categories of each observation
in the dataset: age and sex.
In the dataset, the patients who participated in the
research were from age 29 to 76. The average age of
patients who had a high risk of heart attack was 52.50
years old with a standard deviation of 9.55. From
Figure 3, most patients having a high risk of heart
attack were from 42 to 59 years old. The risk of heart
attack didn’t have an obvious trend as the age of
patients increases, which might differ from the
common sense.
Figure 2: Heat map of 14 variables from the dataset (figure credits: original).
DAML 2023 - International Conference on Data Analysis and Machine Learning
308
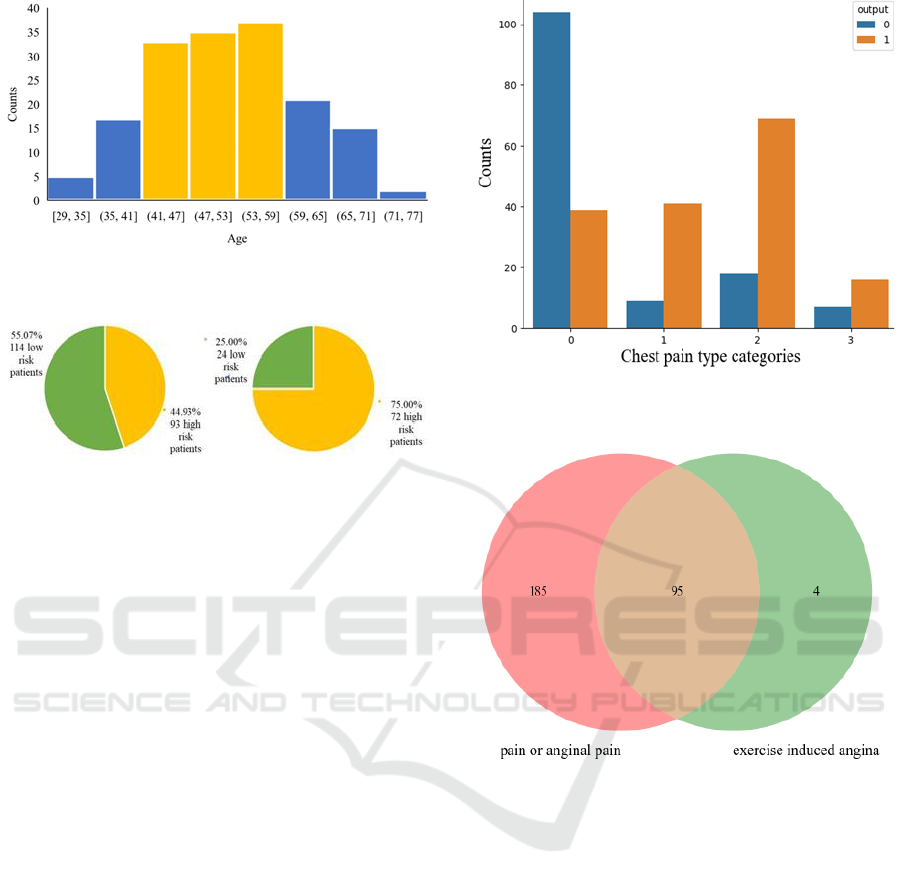
Figure 3: Age distribution of patients who have high heart
attack risk (figure credits: original).
Figure 4: Distribution among male and female patients
(figure credits: oringinal).
The 303 patients in the dataset were made up of 96
female patients and 207 male patients, which were
more than twice of female patients. Through the
comparison illustrated in Figure 4, the chance of high
heart attack risk was 75.00% among female patients,
however, 44.93% of patients in the male group were in
high risk, indicating that female patients were more
likely to have a higher risk of heart attack.
3.1.3 Correlation Between Chest Pain Type
and Heart Attack Risk
To further study the correlation, a histogram listed the
counts of patients with high or low heart attack risk
categorized by chest pain types. From Figure 5,
patients with chest pain type 2 (non-anginal pain)
seemed to have more chance of heart attack, compared
with other groups. As types 0, 1 and 2 referred to
different types of pain and type 3 referred to
asymptomatic, patients with pain or anginal pain
symptoms had a higher probability of suffering heart
attack.
Besides, from the Venn diagram shown below, it
was distinct that pain or anginal pain and exercise
induced angina had strong interactions (Figure 5 and
Figure 6).
Figure 5: High and low risk patient counts categorized by
chest pain types (figure credits: original).
Figure 6: Venn diagram for patients with pain and exercise
induced angina (figure credits: original).
3.1.4 Maximum Heart Rate Achieved and
Heart Attack Risk
From Figure 7, patients with a maximum heart rate
between 140 and 180 had a higher probability of heart
attack. Also, as the maximum heart rate increased, the
ratio of patients having more chances of heart attack to
those having less chances of heart attack increased.
Besides, Figure 2 indicated that there was a strong
correlation between age and the maximum heart rate.
Machine Learing-Based Heart Disease Prediction: Insights and Comparative Analysis
309
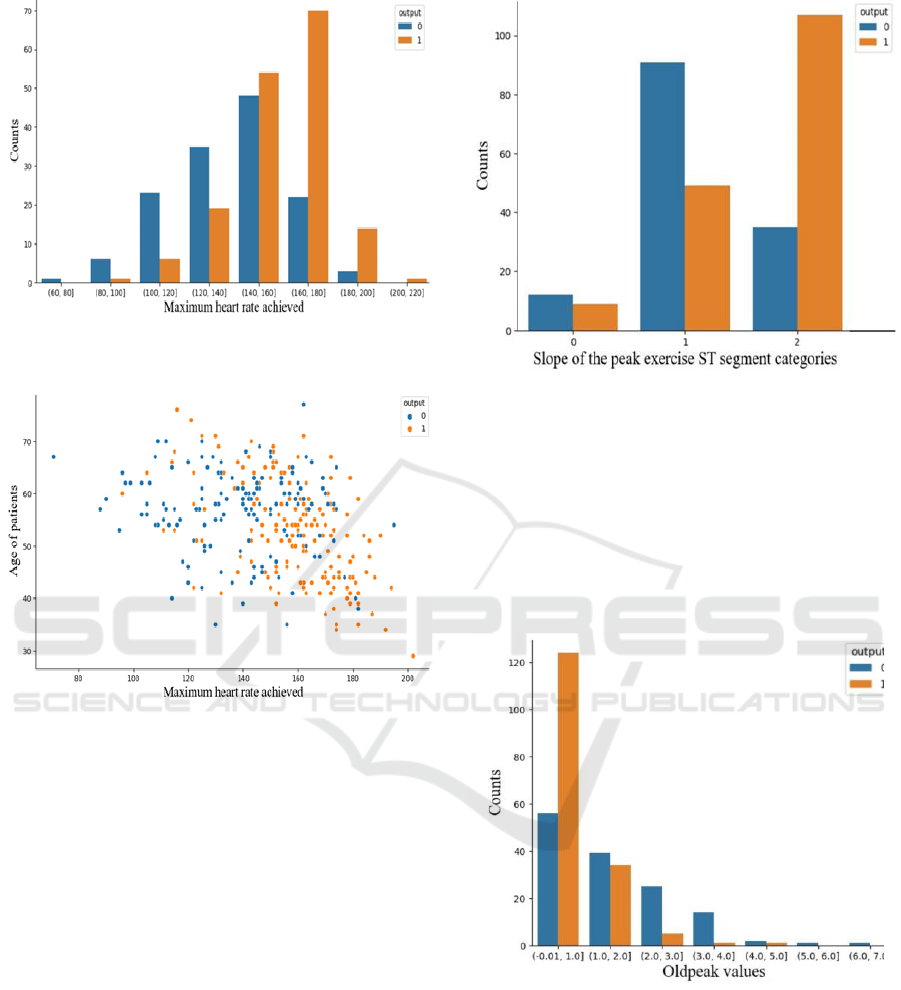
Figure 7: Patient counts categorized by maximum heart rate
achieved (figure credits: original).
Figure 8: Correlation between age and maximum heart rate
of patients (figure credits: original).
In Figure 8, the age of the patient and the maximum
heart rate achieved were negatively related for patients
regardless of heart attack risk. The maximum heart rate
distribution for patients with low risk was relatively
uniform. However, the data points of patients with a
high risk of heart attack focused on the area where the
maximum heart rate was between 150 to 190 and the
age was between 30 and 60. Patients with a high risk
of heart attack tended to have higher maximum heart
rates at relatively young ages.
3.1.5 Slope of Peak Exercise ST Segment and
ST Depression Induced by Exercise
Figure 9 showed that the probability of heart attack was
highest when the slope type was 2, i.e., the slope of the
peak exercise ST segment decreased. Patients having
the characteristic of type 2 slope had more chance of
heart attack.
Figure 9: Counts grouped by slope types of the peak exercise
ST segment (figure credits: original).
All 'oldpeak' values were non-negative in Figure 9.
The lowest ‘oldpeak value’ was 0 and the highest was
6.2. From Figure 10, the probability of heart attack was
highest when ‘oldpeak’ values were at low levels and
decreased as the ‘oldpeak' values increased.
Also, according to Figure 2, the interaction
between slope and ‘oldpeak’ (ST depression induced
by exercise relative to rest) was valuable.
Figure 10: ST depression values induced by exercise relative
to rest (figure credits: original).
In Figure 11, the slope of the peak exercise ST
segment showed the opposite trend as ST depression
induced by exercise relative to rest. The lines
connecting data points illustrated the decreasing
trends. At the same slope type value, the average
‘oldpeak’ value was lower for patients who had a high
risk of heart attack.
DAML 2023 - International Conference on Data Analysis and Machine Learning
310
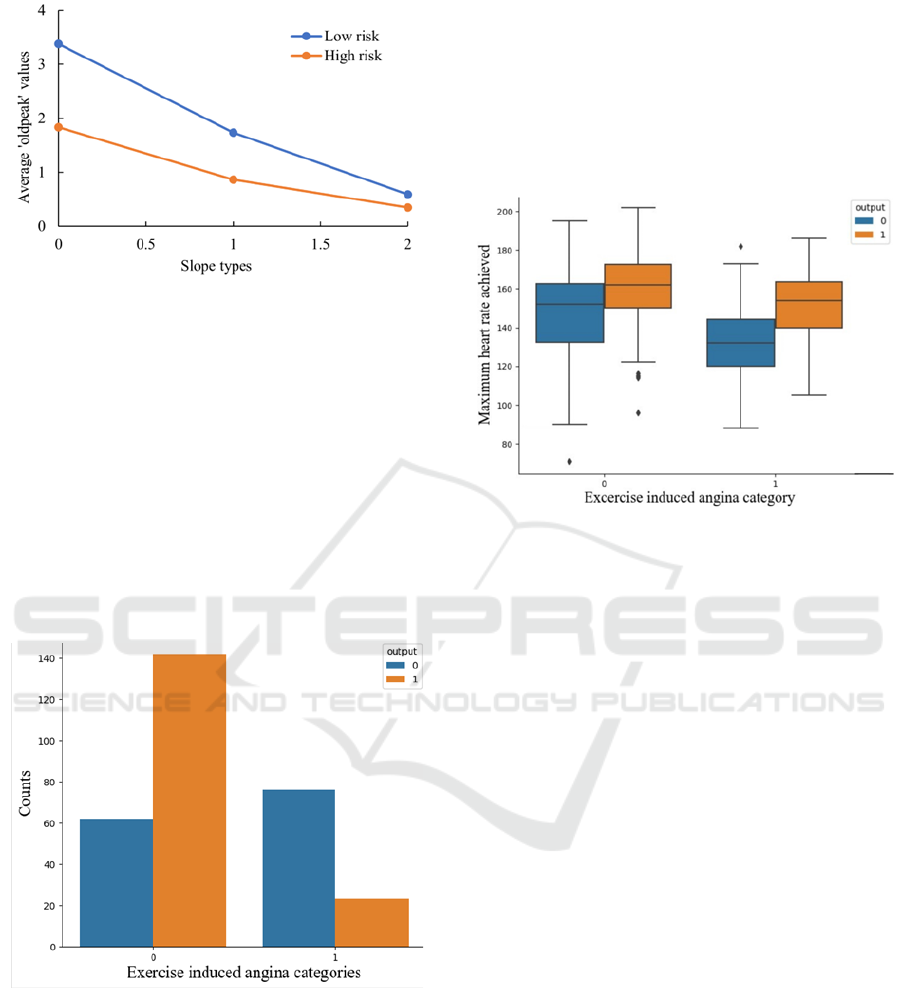
Figure 11: Interactions between ‘oldpeak’ and slope types
(figure credits: original).
3.1.6 Relation Between Exercise Induced
Angina and Heart Attack Risk
In Figure 12, the horizontal axis represented whether
the patient had exercise induced angina symptoms,
where 0 denoted ‘no’ and 1 denoted ‘yes’. From this
figure, patients without exercise induced angina were
more likely to suffer heart attacks, compared with
those who have exercise induced angina. From Fig. 12,
the interactions between exercise induced angina
occurrence and maximum heart rate were shown
below.
Figure 12: Exercise induced angina case counts (figure
credits: original).
The average maximum heart rate values of patients
with exercise induced angina were slightly lower than
those of patients without exercise induced angina. A
significant negative association was observed between
exercise induced angina and the average maximum
heart rate values during exercise, implying that a
higher average maximum heart rate value during
exercise was associated with a lower likelihood of
angina. This could be attributed to the fact that the
average maximum heart rate values during exercise
indicated the functional status and health level of the
heart. Moreover, individuals without heart disease
tended to have higher average maximum heart rate
values during exercise, which demonstrated that the
average maximum heart rate values during exercise
could reflect the health level of the heart (Figure 13).
Figure 13: Maximum heart rate and exercise induced angina.
(figure credits: original).
3.2 Information Gain Analysis
As Figure 14 showed, based on the dataset provided,
the features “cp”, “thalachh”, “oldpeak”, “caa”, and
“thall” exhibited relatively high information gain,
indicating their significant contribution to the
classification task. On the other hand, the features
“age”, “trtbps”, “chol”, “fbs”, and “restecg”
demonstrated relatively low information gain,
suggesting that they might have less discriminatory
power in distinguishing between different classes.
These features with higher information gain could
potentially provide more valuable insights for the
classification task at hand. However, it was important
to note that the information gain analysis was based on
the current dataset, and further analysis and
experimentation might be required to validate the
significance of these features in a specific
classification context.
In the actual model analysis, two methods were
employed to generate models for comparison. One
method involved removing the variables with lower
information gain, namely “age”, “trtbps”, “chol”,
“fbs”, and “restecg” from the dataset before training
the model. This approach aimed to assess the impact of
excluding these variables on the model's performance.
Machine Learing-Based Heart Disease Prediction: Insights and Comparative Analysis
311

Figure 14: Information gain of the variables in dataset.
(figure credits: original).
Another method involved keeping all variables,
including the ones with lower information gain, in the
dataset for model training. This approach aimed to
evaluate the contribution of these variables, even
though their information gain was relatively low.
By comparing the performance of the models
generated using these two methods, we could gain
insights into the importance and relevance of the
variables with lower information gain. This analysis
allowed us to determine whether these variables
provide any meaningful information for the
classification task or if their inclusion has a negligible
impact on the model's performance.
3.3 Model Data Analysis
In this study, the performance of three classification
methods was compared, namely KNN, SVM and
Adaboost, on two data sets: the original data set and
the processed data set. The processed data set was
obtained by information gain as a feature selection
technique to the original data set, which reduced the
dimensionality and noise of the data, and enhanced the
quality and interpretability of the data. Features with
information gain below 0.05 were removed from the
original dataset.
Table 1: Accuracy of each test.
1st
2nd
3rd
4th
5th
mean
KNN initial
0.750
0.921
0.868
0.803
0.908
0.850
KNN processed
0.790
0.868
0.868
0.763
0.882
0.834
SVM initial
0.750
0.895
0.855
0.829
0.934
0.853
SVM processed
0.816
0.895
0.868
0.829
0.908
0.863
Adaboost initial
0.737
0.855
0.855
0.750
0.921
0.824
Adaboost processed
0.803
0.868
0.829
0.776
0.908
0.837
This research used five-fold cross-validation as the
evaluation method and reported the accuracy of each
method on each fold, as well as the average accuracy
over all folds. The results were shown in Table 2. From
the table, we could observe that SVM outperformed
both KNN and Adaboost on both data sets, achieving
an average accuracy of 0.853 on the original data set
and 0.863 on the processed data set. KNN ranked
second, with an average accuracy of 0.850 on the
original data set and 0.834 on the processed data set.
Adaboost ranked last, with an average accuracy of
0.824 on the original data set and 0.837 on the
processed data set. At the same time, the processed
data set did not lose much accuracy in classification,
and might even be improved, which showed that
information gain was an effective feature selection
method. Based on these results, if only the team took
the accuracy of model prediction into consideration,
this research would recommend using SVM as the best
classification method for this problem.
In the problem of heart disease prediction, it was
always preferred to minimize the false negative rate,
which meant the probability of misclassifying a patient
with heart disease as healthy. This is because false
negatives can lead to serious medical consequences,
such as delayed treatment or missed diagnosis.
Therefore, the classification method that had a high
sensitivity and a low specificity was more popular,
even if this resulted in some false positives, which
meant the probability of misclassifying a healthy
person as one having heart disease. This way, it could
be ensured that the high-risk patients were identified
and treated promptly and reduced the mortality or
morbidity caused by missed diagnoses. Consequently,
this research took 3 machine learning methods that
dealt with.
Table 2: Performance of classification methods on binary
classes.
precision
recall
score
support
KNN 0
0.9062
0.8056
0.8529
36
KNN 1
0.8409
0.925
0.8810
40
SVM 0
0.8800
0.7586
0.8148
29
SVM 1
0.8627
0.9362
0.8980
47
Ada 0
0.8333
0.6897
0.7547
29
Ada 1
0.8269
0.9149
0.8687
47
This table 3 showed the performance evaluation
results of three classification methods, namely KNN,
SVM and Adaboost, on a binary classification
problem, where 0 denoted having a high risk of heart
disease and 1 denoted having a low risk of heart
DAML 2023 - International Conference on Data Analysis and Machine Learning
312

disease. The table reported the precision, recall, F
1
score and supported for each class and each method.
According to the table, KNN had a high average F1
score in both classes and a better performance in the
positive class than the negative class. It could
sensitively identify the patients with heart disease and
avoid false negatives. SVM had the highest average F1
score in both classes and a better performance in the
negative class than the positive class. It could
accurately identify healthy people and avoid false
positives. Adaboost was the worst method, as it had the
lowest average F1 score in both classes, and a
consistent performance in both classes. It could not
effectively distinguish between the two classes or
avoid errors.
If the target was to minimize the false negative rate,
which meant the probability of misclassifying a patient
with heart disease as healthy, a classification method
that had a high recall on the positive class was favored.
According to the table, KNN had a recall of 0.8056 on
the positive class, which was 0.0470 higher than SVM
and 0.1159 higher than Adaboost. This indicated that
KNN could better identify the patients with heart
disease, and thus avoided the false negatives.
4 CONCLUSION
This research aimed to explore the prediction of heart
disease using various machine learning methods and
data preprocessing techniques. The research also
compared different machine learning methods to find
a better prediction method. The dataset used contained
303 patient observations with 14 different variables.
Several key findings and insights emerged from the
analysis. Age and sex played significant roles in
disease assessment. Female patients were more likely
to have a higher risk of heart disease. However, the risk
of heart attack didn't exhibit a straightforward trend
with age. Different chest pain types were associated
with varying probabilities of heart attacks. Patients
with non-anginal pain (type 2) were more prone to
heart attacks. Patients with higher maximum heart
rates during exercise had a higher risk of heart attack,
especially at younger ages. The slope of the peak
exercise ST segment and ST depression values induced
by exercise relative to rest were indicative of heart
disease risk. Type 2 slope (decrease trend) and lower
ST depression values correlated with higher risk.
Patients without exercise-induced angina were more
likely to suffer from heart attacks. Moreover, the more
major vessels checked, the lower the risk of heart
attack.
The study then evaluated the performance of three
machine learning algorithms (KNN, SVM, and
Adaboost) on both the original and processed datasets.
SVM emerged as the best-performing algorithm based
on accuracy. KNN, on the other hand, had a higher
sensitivity, making it suitable for minimizing false
negatives, which is crucial in heart disease prediction.
In conclusion, the choice of machine learning
algorithm depends on the specific goals of the
prediction model. SVM excelled in overall accuracy,
while KNN showed a higher sensitivity for identifying
patients with heart disease. Further research could
explore ensemble methods and hybrid models to
combine the strengths of different algorithms and
improve predictive accuracy while minimizing false
negatives, ultimately helping in the early diagnosis and
treatment of heart disease, increasing survival rates of
patients.
4.1 Authors Contribution
All the authors contributed equally and their names
were listed in alphabetical order.
REFERENCES
R. J. Goldberg, et al. “The impact of age on the incidence
and prognosis of initial acute myocardial infarction: The
Worcester Heart Attack Study,” American Heart
Journal, 1989, vol. 117, no. 3, pp. 543–549.
C.-M. Chow, L. R. Donovan, D. Manuel, H. Johansen, and
J. V. Tu, "Regional variation in self-reported heart
disease prevalence in Canada," Canadian Journal of
Cardiology, 2005.
M. Y. Zakharova, R. M. Meyer, K.R. Brandy, Y. H. Datta,
M. S. Joseph, P. J. Schreiner et al., “Risk factors for
heart attack, stroke, and venous thrombosis associated
with hormonal contraceptive use,” Clinical and Applied
Thrombosis-Hemostasis, 2011, pp. 323–331.
Paul M. Ridker, “Evaluating novel cardiovascular risk
factors: Can we better predict heart attacks?,” Annals of
Internal Medicine, 1999, vol. 130, no. 11, pp. 933.
C. Wang, Z. Guo, J. Yan, “Research on improved support
vector machine in heart disease prediction,” Computer
Technology and Development, 2022, vol. 32, no. 03, pp.
175-179.
X. Zhang, “Analysis of diagnostic factors of heart disease
based on logistic regression and decision tree,” Modern
Information Technology, 2023, vol. 7, no. 7, pp. 117-
119+123.
R. Xin, Z. Dong, F. Miao, T. Wang, Y. Li, X. Feng,
“Research on heart disease prediction model based on
machine learning,” Journal of Jilin Institute of Chemical
Technology, 2022, vol. 39, no. 9, pp. 27-32.
Z. Zhang, W. Hu, “Heart disease prediction based on feature
selection approach and probabilistic neural network,”
Machine Learing-Based Heart Disease Prediction: Insights and Comparative Analysis
313

Modern Electronic Technique, 2022, vol. 45, no. 1, pp.
95-99.
R. TR, U. K. Lilhore, P. M, S. Simaiya, A. Kaur, and M.
Hamdi, “Predictive analysis of heart disease with
machine learning approaches,” Malaysian Journal of
Computer Science, 2022, pp. 132–148.
Mamatha Alex P. and Shaicy P Shaji, “Prediction and
diagnosis of heart disease patients using data mining
technique,” in 2019 International Conference on
Communication and Signal Processing (ICCSP),
Chennai, India, 2019, pp. 848-852.
R. Bharti, A. Khamparia, M. Shabaz, G. Dhiman, S. Pande,
and P. Singh, “Prediction of heart disease using a
combination of machine learning and deep learning.,”
Computational Intelligence and Neuroscience, 2021, pp.
1–11.
C. Raju, E. Philipsy, S. Chacko, L. Padma Suresh, and S.
Deepa Rajan, “A survey on predicting heart disease
using data mining techniques,” in 2018 Conference on
Emerging Devices and Smart Systems (ICEDSS),
Tiruchengode, 2018.
DAML 2023 - International Conference on Data Analysis and Machine Learning
314
