
Analysis of Common Indicators and Unidentified Factors of Heart
Disease Based on Two Machine Learning Models
Jincheng Guo
School of Science, China University of Petroleum (East China), Qingdao, China
Keywords: Heart Disease, Unidentified Factors, Logistic Regression, Random Forest.
Abstract: In recent years, heart disease had caused great attention in the medical and health field. Many researchers
continuously care about common key indicators that directly related to heart disease. However, some
researchers have found that some unidentified non-direct indicators were also potential factors that affect
early heart disease. Therefore, the research theme in this paper is the impact of multiple direct and indirect
indicators on the prevalence of heart disease. And research method is downloading a large data set from
Kaggle website, which includes 18 variables and 320 thousand samples, before using logistic regression
model and random forest model to perform categorical prediction. It is found that the random forest model
performs very excellent in the training set, but the comprehensive classification effect on the logistic
regression model turns out to be better. Through analysis of these model results, it showed that in addition to
well-known indicators such as age and physical health, whether a person have diabetes, stroke, asthma or
some other indirect illnesses would also affect whether that person suffer from heart disease. Hence, the
prevention and treatment of heart disease patients should start from the early stage of other minor diseases
and potential latent factors, and patients should take their physical and psychological state seriously in a
comprehensive assessment.
1 INTRODUCTION
As early as the beginning of the last century, people
have taken emphasis on heart disease’s
seriousness. Surprisingly, about 17.5 million deaths
all around the world each year was caused by heart
disease and its complications, accounting for 1/3 of all
deaths (Liu and Qiao 2019). It is reported that there
were 300 million people in total suffering from heart
disease in China, and the number of hospitalizations
for heart disease has increased fourfold in the past 10
years (Tian et al 2019). Compared to Western
countries, where heart disease patients are people over
the age of 70, the patients in China whose age was 40
to 64 account for a large proportion. Firstly, this is due
to the fact that with the development of China's
economy, people are living more and more
prosperously, and their diet is biased towards high
cholesterol, heavy oil and salt. Secondly, the pressure
of work and life for modern people is numerous, but
their diet and rest are irregular (Qun et al 2016).
Thirdly, some diseases are asymptomatic or mild. If
latent patients cannot be screened and detected in time,
they may have further deterioration of the condition.
Additionally, some large gaps between China's
medical level and that of advanced countries are still
existing, as well as the problem of uneven economic
level between different areas. Therefore, the detection
and treatment of heart disease has become an urgent
issue on Chinese people and has become the focus of
attention in the medical field (Qun et al 2016).
At present, most medical institutions still perform
the detection of heart disease according to doctors'
personal experience and physical examination
results. It not only costs a lot on labor, but also delays
the optimal treatment time of patients. However, using
machine learning prediction methods as an auxiliary
diagnosis to provide effective guidance for clinical
diagnosis is a great way to improve the accuracy of
prediction and diagnosis (Yang et al 2016). Since the
technology convergence in this big data era is
commonplace nowadays, using machine learning to
contribute to the diagnosis and prediction of heart
disease will be a valuable and meaningful studying
(Liu and Qiao 2019). Machine learning takes
advantages of computers to build probabilistic
mathematical models on the basis of given data and
utilize these models to predict and analyze (Wang
2018).
Scholars all over the world have carried out
numerous research on the use of machine learning
Guo, J.
Analysis of Common Indicators and Unidentified Factors of Heart Disease Based on Two Machine Learning Models.
DOI: 10.5220/0012805200003885
Paper published under CC license (CC BY-NC-ND 4.0)
In Proceedings of the 1st International Conference on Data Analysis and Machine Learning (DAML 2023), pages 315-320
ISBN: 978-989-758-705-4
Proceedings Copyright © 2024 by SCITEPRESS – Science and Technology Publications, Lda.
315

methods to predict and treat heart disease. Comak et
al. constructed a system of decision support for the
identification of this disease by support vector
machine (SVM) in 2007 (Arslan, et al 2007).
Tantimongcolwat et al. identified ischemic heart
disease using self-organization mapping with back
propagation (BP) neural networks in 2008
(Tantimongcol, et al 2008). Arabasadi et al. proposed
a hybrid algorithm of genetic algorithm and neural
network, and the prediction accuracy of heart disease
reached 93.85% (Arabasa, et al 2017). In 2017, Zhu
knotted Combine deep belief networks (DBN) grid
and long and short memory neural network (LSTM)
grid to build the model (Zhu 2017) to improve
prediction effect (Sun and Wang 2020) predicted heart
disease through two stages. The first stage trains a
sparse auto encoder (SAE), the next stage utilizes an
artificial neural network (ANN) for prediction of
health condition based on learning records. These two-
stage methods effectively improve the classification
effect of neural networks and has stronger robustness
than other methods. These scholars have studied a
particular method in depth, but they may have used
different datasets. Due to the large differences in the
classification and prediction effects of various models
on different datasets, the classification prediction
effect of no algorithm can be better than that of other
algorithms on any other data set (Ding 2019).
Therefore, their models cannot be directly compared
with each other. Additionally, some datasets have little
data which may have weak generalization capabilities.
Above all, two machine learning methods of
logistic regression and random forest will be used to
build different models based on the same large
datasets to analyze the most crucial indicators that lead
to heart diseases.
2 METHODS
2.1 Data Sources
The data set for this paper is downloaded from the
Kaggle website, which was compiled by American
Centers for Disease Control and Prevention and
updated in 2022 for 319797 individuals. Due to the
huge amount of data, this paper uses the first 30000
data to analyze.
2.2 Variable Selection
The data set used in this paper has 18 variables.
Among them, 5 variables are numerical and 11
variables are binary type. The meaning of all the
variables in this data set is presented in Table 1:
Table 1: Description of variables.
Variables
Type
Meaning
Heart Disease
Binary
Respondents who have reported coronary heart disease or myocardial infarction.
BMI
numeric
Body mass index
Smoking
Binary
Smoked at least 100 cigarettes in your life?
Alcohol Drinking
Binary
Heavy drinkers
Stroke
Binary
Two results: “Yes” and “No”
Physical Health
numeric
physical health (0-30 days)
Mental Health
numeric
Mental health (0-30 days)
Diff Walking
Binary
have difficulties walking or climbing stairs?
Sex
Binary
Two results: “Yes” and “No”
Age Category
numeric
Age range
Race
Categorical variables
“White”, “Black”, “American” and “other”
Diabetic
Binary
“Yes” and “No”
Physical Activity
Binary
Adults who have been physically active or exercised in the past 30 days
Gen Health
Categorical variables
What do you think of your health status?
Sleep Time
numeric
How many hours of sleep do you get in a 24-hour period on average?
Asthma
Binary
“Yes” and “No”
Kidney Disease
Binary
“Yes” and “No”
Skin Cancer
Binary
“Yes” and “No”
DAML 2023 - International Conference on Data Analysis and Machine Learning
316
2.3 Variable Processing
In this data set, there are many binary categorical
variables and continues numerical variables. In order
to make it easy to analyze, this paper uses python to
perform pre-processing. For the categorical variables,
converting each circumstance into exact number. For
example, mapping “yes” into 1 and mapping “no” into
0. For the numeric variables, dividing them into
different intervals according to the size of the values,
which means that each interval represents a degree
level. Below are the data visualization of
representative variables.
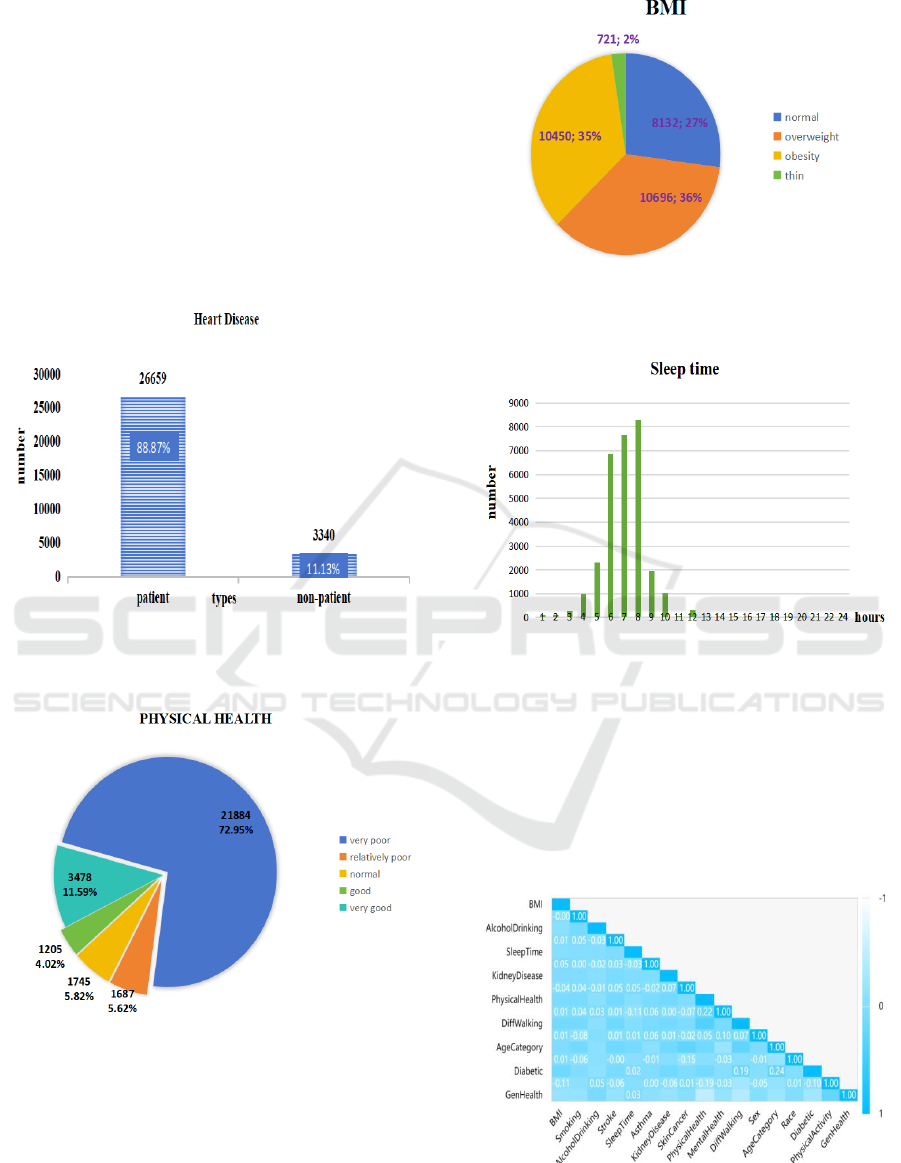
Figure 1: The proportion and number of people who have
and who do not have heart disease in the entire data set
(Picture credit: Original).
Figure 2: Percentage and number of people with different
levels of physical health (Picture credit: Original).
From Figure 1, it is clear that the number of patients
greatly outweigh that of non-patients, accounting for a
large proportion. And in Figure 2, it shows that most
people’s physical health in this data set was under very
poor condition, which compliant with Figure 1’s
information.
Figure 3: The proportion and number of people with
different levels of body mass index (BMI) (Picture credit:
Original).
Figure 4: The number of people with different sleeping time
hours (Picture credit: Original).
From Figure 3, it shows that the BMI of most
people was abnormal, while in Figure 4, it can be seen
that most of people sleep 6 to 8 hours.
Furthermore, before using machine model to fit and
predict, correlation analysis between dependent
variable (heart disease) and independent variables as
well as correlation relationships between each pair of
characteristic variables is needed.
Figure 5: Correlation analysis between each pair of
independent variables (Picture credit: Original).
Analysis of Common Indicators and Unidentified Factors of Heart Disease Based on Two Machine Learning Models
317

From Figure 5, it can be seen that there is no
multicollinearity between independent variables, thus
no filtering is required before building models.
2.4 Method Introduction
This paper selects three models: logistic regression and
random forest. Logistic regression is a kind of
supervised learning which mainly used to resolve
binary classification problems, as well as multiple
classification problems. In this generalized linear
regression analysis model, the regression coefficient
and p-value of each variable are important evaluation
indicators. The random forest model is an ensemble
learning, or to say, it is an improvement of the decision
tree model. The classification result is determined by
the mode of each individual tree’s class output. This
model is generally obtained by diving collected data
into training set and testing set, then classify dependent
variable (Y) on testing set after the training is
completed. Hence, the accuracy, recall rate and F1-
score (the synthesis of accuracy and recall) are
important evaluation indicators.
3 RESULTS AND DISCUSSION
3.1 Logistic Regression
This paper uses SPSSAU to get the logistic regression
model of 17 characteristic variables, below are the
results of their regression coefficients, standard errors,
p-values and OR values. Through this model, the
impact of each independent variable on the dependent
variable can be divided into three categories based on
the regression coefficient and whether the p-value is
less than 0.05 or not.
Table 2: Analysis of logistic regression results (n=29706).
Variables
Regression
coefficient
Standard
error
p value
OR
value
Smoking
0.309
0.041
0.000
1.362
Alcohol
Drinking
-0.293
0.089
0.001
0.746
Stroke
1.082
0.063
0.000
2.952
Physical Health
0.022
0.015
0.145
1.023
Mental Health
-0.021
0.016
0.185
0.979
Diff Walking
0.182
0.050
0.000
1.200
Sex
-0.652
0.042
0.000
0.521
Age Category
0.269
0.009
0.000
1.308
BMI
0.041
0.026
0.109
1.042
Variables
Regression
coefficient
Standard
error
p value
OR
value
Sleep Time
-0.031
0.011
0.007
0.970
Asthma
0.017
0.053
0.746
1.017
Kidney Disease
0.430
0.067
0.000
1.538
Skin Cancer
0.069
0.054
0.200
1.071
Race
-0.091
0.017
0.000
0.913
Diabetic
0.508
0.046
0.000
1.662
Physical
Activity
0.086
0.045
0.057
1.090
Gen Health
-0.419
0.024
0.000
0.658
From the analysis of table 2, a representative
variable in each of three categories are listed below for
detailed illustration.
The regression coefficient value of Smoking is
0.309 and the p value is less than 0.05, which means
that Smoking has a significant positive effect on Heart
Disease. The odds ratio (OR) value of it is 1.362,
meaning that when Smoking increases by one unit, the
corresponding increase in Heart Disease is 1.362 times.
Reversely, Alcohol Drinking’ s regression
coefficient value is -0.293 and its p value is less than
0.05, which means that Alcohol Drinking has a
significant negative impact on Heart Disease. The OR
value of it is 0.746, meaning that when Alcohol
Drinking increases by one unit, the corresponding
decrease in Heart Disease is 0.746 times.
Interestingly, the regression coefficient value of
Asthma is 0.017, but it does not show significance
(p=0.746>0.05), which means that Asthma does not
affect Heart Disease. The OR value of it is 1.017,
meaning that when Asthma changes by one unit, there
is almost no change in Heart Disease.
In the same way, it can be argued that Smoking,
Stroke, Diff Walking, Age Category, Kidney Disease,
Diabetic will have a significant positive effect on Heart
Disease. Reversely, Alcohol Drinking, Sex, Sleep
Time, Race, Gen Health will have a significant
negative impact on Heart Disease. However, Physical
Health, Mental Health, BMI, Asthma, Skin Cancer,
and Physical Activity do not have an obvious impact
on Heart Disease.
3.2 Random Forest
This paper uses SPSSAU to get the feature weight of
17 characteristic variables, and their feature weights
show the importance of each variable's contribution to
the random forest model.
DAML 2023 - International Conference on Data Analysis and Machine Learning
318
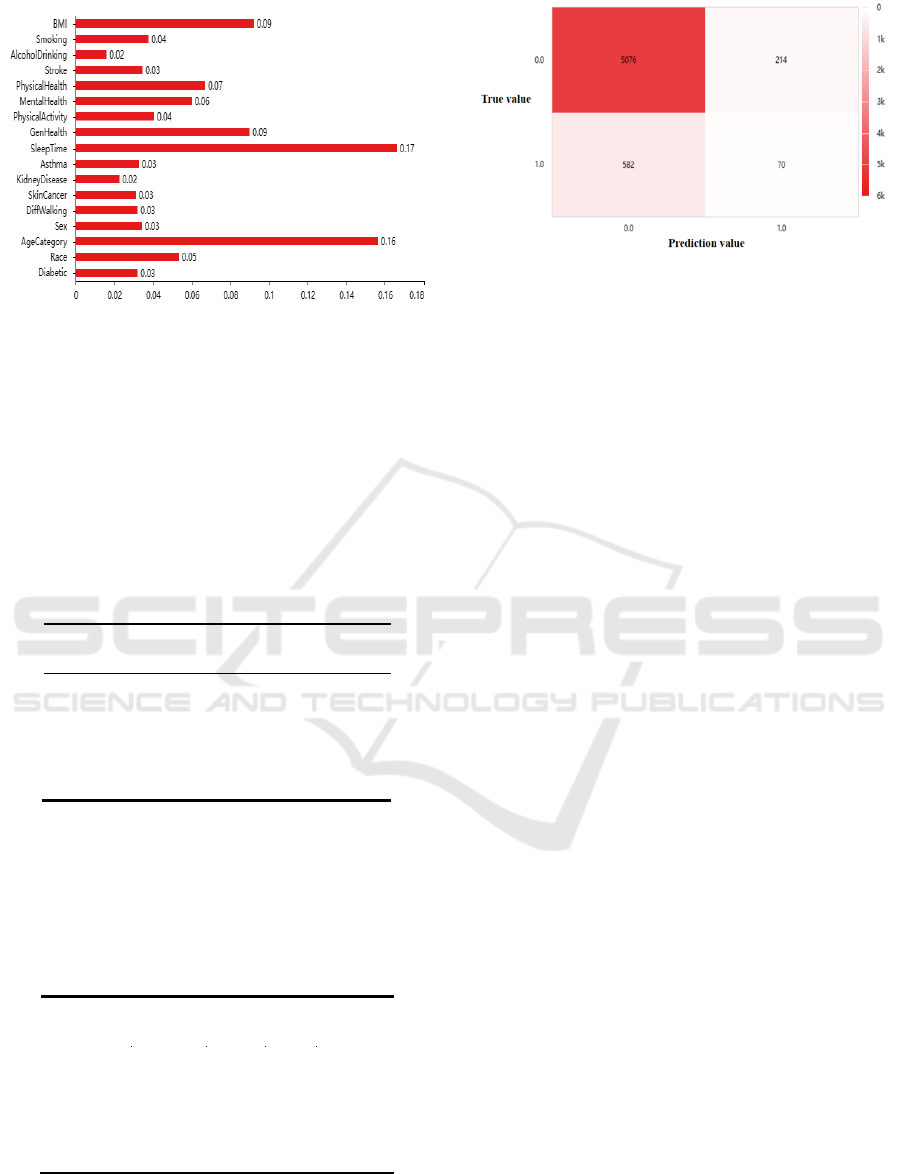
Figure 6: Feature weight of each characteristic variable
(Picture credit: Original).
From Figure 6, it can be seen that the sum value of
all the feature weight is 1. Significantly, Sleep Time,
Age Category, BMI, Gen Health, Physical Health,
Mental Health, Race, Smoking and Physical Activity
accounted for a large proportion, and the proportion of
the above 8 characteristics accounted for 76.59%,
which means they greatly influence the classification
result.
Table 3: the training set model evaluation results.
Term
Accuracy
Recall
F1-
score
Number of
samples
Patient
0.99
1.00
0.99
21089
Non-patient
0.97
0.88
0.92
2675
Average
(synthesis)
0.99
0.99
0.98
23764
From table 3, it is clear that the accuracy, recall and
F1-score are all over the high value of 0.98 in average
(synthesis), which means the classification effect is
excellent on training set. Thus the model gets a
desirable training result.
Table 4: the testing set model evaluation results.
Term
Accuracy
Recall
F1-
score
Number of
samples
Patient
0.90
0.96
0.93
5290
Non-patient
0.25
0.11
0.15
652
Average
(synthesis)
0.82
0.87
0.84
5942
Figure 7: Confusion matrix for test set results (Picture credit:
Original).
From table 4 and Figure 7, the accuracy, recall and
F1-score of patients are over 0.90, but for non-patient,
these indicators are undesirable.
In summary, the model obtained on the test set has
an accuracy (synthesis) of 82%, a recall rate (synthesis)
of 87%, and an F1-score (synthesis) of 0.84. Model
effects are acceptable.
3.3 Model Evaluation
Comparing these two models of logistic regression and
random forest, it is found that the effect on the training
set in random forest is particularly excellent. However,
this model gets unsatisfactory effect on the testing set,
which may be caused by the large difference between
the proportion of sick and non-sick people. In general,
the logistic regression model turns out to be more
stable and effective.
4 CONCLUSION
This paper selects a large data set and pay attention to
the broad influencing indicators that may cause heart
disease. Through machine learning model of logistic
regression and random forest, it founded that apart
from well-known key indicators of sleep time, physical
health, mental health and age category, having heart
disease may be also related to stroke, asthma, kidney
disease, skin cancer, diff walking, sex and diabetic,
most of which have always been ignored before. And
it also shows that some bad living habits and other
diseases that not related to heart disease are also
potential factors that could lead to heart disease.
Besides, in the very early period of heart disease,
which means that heart disease can be prevented and
avoided, these indicators are easy to be ignored,
resulting in a large part of patients did not detect
themselves in time, missing the golden time to recover.
Therefore, this paper suggests that in the early stage of
the emergence of a disease, people should pay much
Analysis of Common Indicators and Unidentified Factors of Heart Disease Based on Two Machine Learning Models
319

attention to it and have effective detection and
treatment in time in order to avoiding causing other
disease.
More detailed information of these non-direct
factors of heart disease requires further medical
investigation, which means that these findings point a
new way to further relevant research for workers in the
medical investigation field. Once a new causative
factor other than those already identified is discovered,
this can help lots of people discover heart disease
earlier.
Admittedly, these models may have disadvantages.
To be more specific, the accuracy and recall in testing
set are relatively low in random forest model, meaning
the prediction accuracy is not desirable. And the
samples did not cover all ages and races, which may
miss some possibly special conditions. In the future,
researchers can explore more potential factors that are
not directly related to the occurrence of heart disease,
and synthesize multiple prediction models to achieve
more accurate and more efficient predictions.
REFERENCES
Y. Liu, M. Qiao, “Heart disease prediction based on
Clustering and xgboost algorithm,” Computer system
application, pp. 228-232, 2019.
M. Tian, D. Zhang, C. J. Mei, “Current status and future of
Congenital heart disease in adults,” Chinese Clinical
Journal of Thoracic and Cardiovascular Surgery, pp,
590-600, 2019.
M. Qun, Y. Xin, L. Chen, “Development status and thinking
of internet medical care in China,” Chinese Journal of
Health Information Management, pp. 356-363, 2016.
X. Yang, M.Y. Li, C.Y. Yan, “Building and application of
Nursing risk early warning model based on Electronic
medical record,” China Digital Medicine, 2016.
H.R. Wang, “On-line auxiliary diagnosis system for heart
disease based on K-nearest neighbor algorithm,”
Electronic production, pp. 49-51+76, 2018.
A. Arslan, et al, “A decision support system based on
Support vector machines for diagnosis of the heart valve
diseases,” Compute biology med, pp. 217, 2007.
W. Tantimongcol, et al, “Identification of Ischemic heart
disease via machine learning analysis on Magnet
ocardiograms,” Computers in biology and medicine, pp.
817-825, 2008.
D. Arabasa, et al, “Computer aided decision on making for
heart disease detection using hybrid neural network-
Genetic algorithm,” Computer methods and programs in
bio-medicine, pp. 19-26, 2017.
J. Y. Zhu, “Study on heart disease risk model based on
LDBN,” Zhengzhou University, 2017.
Y. X. Sun, Z. H. Wang, “Improved sparse auto-encoder
based artificial neural network approach for prediction
of heart disease,” Informatics in medicine unlocked,
2020.
W. J. Ding, “Research on Classification algorithm in heart
disease pre diagnosis,” Xi Dian University, 2019.
DAML 2023 - International Conference on Data Analysis and Machine Learning
320
