
Analysis of the Factors Influencing Streaming Video Services'
Business Performance
Ruonan Sun
Department of Mathematics, University of California, Irvine, Irvine, U.S.A.
Keywords: Streaming Video Services, Business Performance, Visualize.
Abstract: People are not satisfied with the limited programs available on cable TV, and with the popularity of the
internet and the common use of electronic devices, as well as the constant technological innovations of video
companies, people can now watch any performance they want in their homes in very high definition. The
video streaming industry is one of the hottest and most profitable industries today. But it's not yet clear when
the big video service media players gained their strong leading position in the market and how they divide up
the mainstream video service media market. Therefore, this paper examines the trends in the number of
subscribers of video streaming platforms with more than 60 million subscribers over the seven years from
2017 to 2023. Through data visualization and data comparison, it is straightforward to see that in the three
years starting in 2017, the number of subscribers grew rapidly, but starting in 2020, some established
platforms started to stagnate as some emerging platforms entered the market and were full of potential. Then
this paper analyzes the reasons behind the trends, like market saturation, the support of technology, users’
demand, social background, and market opportunity.
1 INTRODUCTION
Video streaming service has revolutionized the TV
market. One decade ago, people still needed to watch
programs through cable TV, and radio, rent DVDs or
go to the theater, and their choices were very limited.
Nowadays, with the development of technology,
streaming services area achieved great progress and
become a hot industry. Also, with the improvements
in people's living conditions, electronic devices are
more easily available. People do not need to go to the
theater or rent a TV disk to watch a TV performance.
As long as people have an Internet connection and
electronic devices, whenever and wherever people
want, they just need to switch on their device and
press the button and then can watch their favorite TV
series, shows, and movies and any time, and space.
Streaming services, or more exactly, over-the-top
video services have greatly facilitated people’s lives.
over-the-top video services is also called OTT video
services, meaning access via the Internet or networks
which is independent of those dedicated to the
transmission of programs like cable or radio (Radio-
television and Commission 2011).
OTT services have become an integral part of
people's lives. Statistical data show, that until 2023,
OTT video services have an enormous market, having
more than 3.5 billion global users and continuously
increasing (Stoll 2023). Even in some countries, like
Canada and the United Kingdom, video streaming
service’s penetration rate is 90 percent in terms of
population (Keenan 2023). Also, the global video
streaming market was valued at $455.45 billion in
2022 and $554.33 billion in 2023. Based on
prediction, the number will be increased to $1,902.68
billion by 2030 (Software 2023). So, the video
streaming area is a profitable field and keeps
increasing. Thus, the streaming services industry is
becoming increasingly competitive. To retain and
even gain more users, streaming service providers do
their best to be more competitive and unique and
stand out from the competition to satisfy users’
demands such as higher video quality, more available
programs, and more customizable content.
In this article, several comparisons and contrast of
the business performance of 7 major platforms will be
done by data visualizing the last 7 years' subscriber
data to analyze the impact of some macro-
environment factors in the video streaming industry,
as well as the impact of micro-events on different
streaming platforms.
98
Sun, R.
Analysis of the Factors Influencing Streaming Video Services’ Business Performance.
DOI: 10.5220/0012808600003885
Paper published under CC license (CC BY-NC-ND 4.0)
In Proceedings of the 1st International Conference on Data Analysis and Machine Learning (DAML 2023), pages 98-102
ISBN: 978-989-758-705-4
Proceedings Copyright © 2024 by SCITEPRESS – Science and Technology Publications, Lda.
2 METHOD
While many video platforms have a free trial period,
it if attractive enough then many users will convert to
subscribers. Most of the video streaming service so
far is paid service and have gained profit from it, so
the number of subscribers indicates the overall
business performance, customer loyalty, and even
brand influence of the platform.
The study focuses on current global major video
streaming platforms that have more than 60 million
subscribers (Netflix, Amazon Prime Video, Disney
Plus, Paramount+, Max and Discovery, Tencent
Video, and Iqiyi). The paper wants to know the
number changes of subscribers of these platforms
over the last seven years from 2017 to 2023. The
study visualizes the data by making line graphs of it.
It clearly shows the general and gradual trend in the
number of subscribers over time, as well as a change
in the growth rate. Also, the comparison is made by
visualizing different platforms' data in a single chart.
To reflect the impact of the emergence of new
platforms on the market as well as their change in
market share, this paper has also done a market share
pie chart comparison.
3 RESULTS AND DISCUSSION
3.1 Result
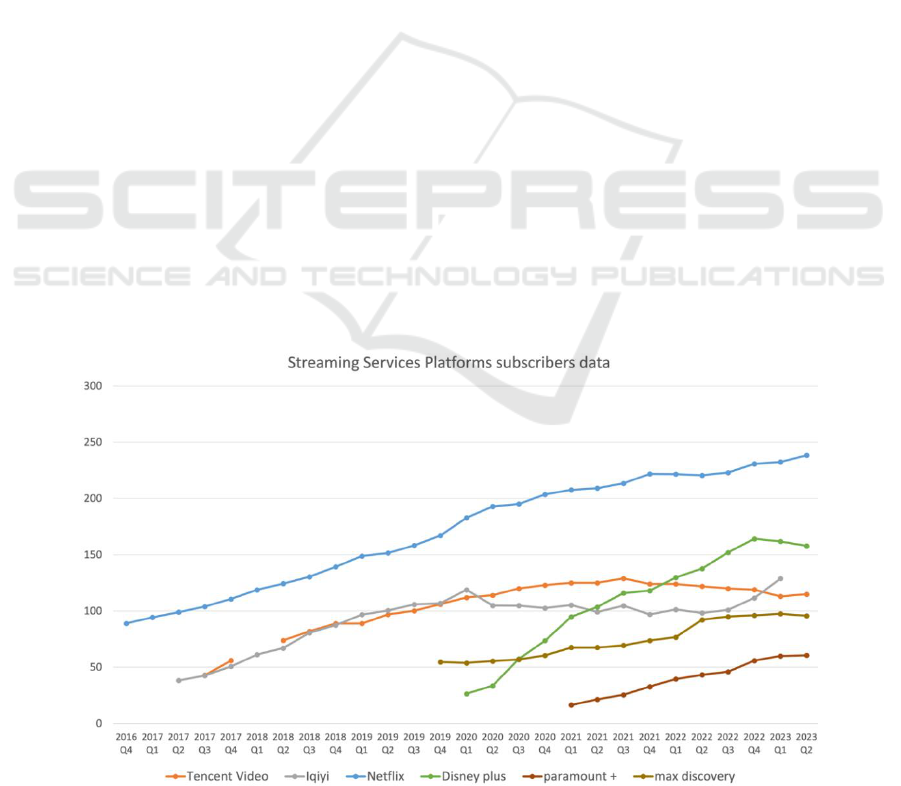
In Figure 1, all the data are collected from the
platform company official quarterly financial report
that shows global platform subscribers. The chart
clearly shows that between 2017 and 2020, there were
only a few video streaming platforms that existed in
the early market such as Netflix, Tencent Video, and
Iqiyi, the number of subscribers grew very rapidly
year by year, but the increase slowed down and even
tends to decline between 2020 and 2023, but there is
still a huge base of user numbers. During this time,
many emerging video streaming providers which are
growing extremely rapidly such as Disney Plus,
Paramount+, Max, and Discovery have entered the
market.
Data in Fig. 2 is collected on the change in the
number of Amazon Prime users in the United States
over seven years from 2017 to 2023. Since U.S.
Amazon Prime users make up 74% of the total
number of users worldwide, it is very representative
to study the change in the number of U.S. users
(Woodward 2023). It can be seen from Figure2 that
Amazon Prime Video (Woodward 2023), as a
streaming platform that entered the market early and
has been in the market for a long time, also developed
beamingly between 2017 and 2020, but slowed down
in the latter three years.
The comparison between Figure 3 and Figure 4 is
remarkable (Yujin 2020 & Susic, 2023). It is clear to
see that in the earlier years, Netflix and Amazon
Prime were the major holders of the market but with
the entry of newer platforms into the market, they are
not what they used to be and the market has become
more diverse.
Figure 1: Line chart showing the timely change of subscribers numbers of 6 major platforms in millions.
Analysis of the Factors Influencing Streaming Video Services’ Business Performance
99
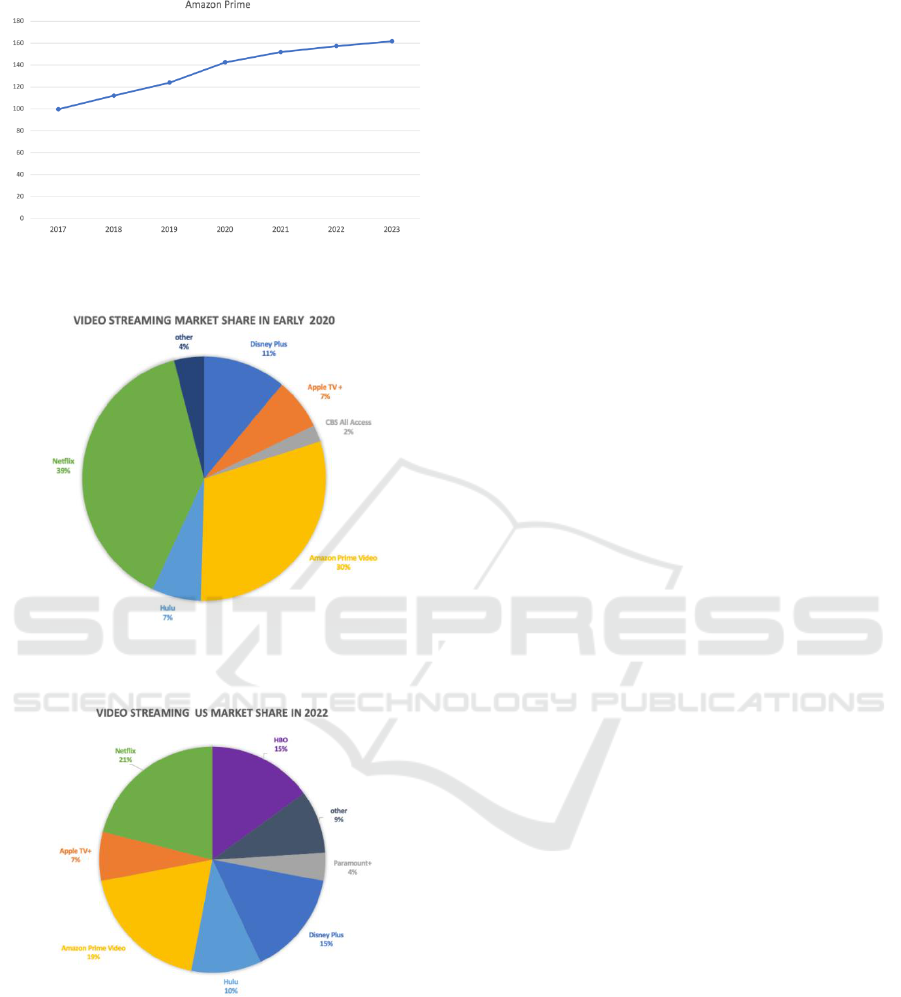
Figure 2: Line chart showing the timely change of Amazon
Prime subscribers numbers in the US in millions.
Figure 3: Pie chart showing major streaming platforms and
their proportion in the market share before pandemic.
Figure 4: Pie chart showing major streaming platforms and
their proportion in US market share after the pandemic.
3.2 Discussion
The main factors for the changes in the market for
streaming service platforms are based on different
technological environments, social environments, and
competitive environments.
In 2017, cable TV was expensive and had only
fixed channels with more commercials, and people
were starting to get bored with it. It is undeniable that
platforms such as Netflix, Amazon, and others have
brought the new service of streaming to the forefront
of people's minds. They changed the way people
watch TV shows. People did not need to watch
advertisements and wait, and there were tons of
programs and movies in the playlist. Thus many
families transfer their cable subscriptions to
streaming services (Blomeley 2021).
After making people aware of video streaming
services, different platforms have chosen different
strategies. For example, Tencent TV and Iqiyi are the
local Chinese video providers who have focused on
the features of China's large population base. So, they
created unprecedented talent shows, like Idol
producer and Producer 101, to appeal to the local
Chinese audience. Based on data, producer 101
received more than 4.3 billion views in total, which
shows a huge success (Jing 2018). While Netflix
chose a very different strategy for expanding the
market. It began to open overseas and international
markets. It works with local companies to provide
content that is more tailored to the preferences of local
people, adds more languages, optimizes its content
library, and works with device manufacturers and
Internet service providers to provide a better user
experience (Barros 2022).
However, the development of platforms cannot
succeed without the development of technology. As
mentioned above, OTT services, including video
streaming services, rely heavily on the open Internet
to deliver content to end users. As broadband
networks continue to evolve, more video content that
needs larger volumes can be presented to users (Lee
et al 2021). Platforms are also constantly improving
their technology to enhance the user experience. For
example, they are improving the delivery chain
technology, which allows users to watch higher-
quality videos by improving the shooting, pipeline
transmission, and high-resolution display (Rehman
2019). Between 2017 and 2020, streaming media is
still in a period of growth.
As shown in Fig. 3 above, only several streaming
platforms are dividing up the entire video streaming
market, so each platform is very profitable, with a
huge and continually soaring number of subscribers.
In the chart, in 2020 many established streaming
leaders will start to stagnate, but at the same time,
many new platforms will join the market. At the
beginning of 2020, the sudden onset of the epidemic
swept across the globe, with many countries
beginning to lockdown and people had to stay at home.
Offline entertainment venues are all closed,
DAML 2023 - International Conference on Data Analysis and Machine Learning
100

traditional movie theaters can't meet the demand for
entertainment. Watching online video programs has
become one of the few recreation people can do. In
the UK, adults spend 40% of their waking hours in
front of a screen during lockdown (Ahead 2023).
Many movie and video companies seized this
opportunity. They released their streaming platform.
Major media companies such as Paramount, HBO,
and Discovery, for example, have developed their
own streaming video services. The streaming wars (a
term used to describe the intense business practices in
the streaming service market) are beginning to be
fought. Companies engage in a variety of behaviors to
make themselves profitable. Fig.1 shows that
Paramount+, Max & discovery, and Disney Plus are
the more dominant platforms in the streaming wars.
This is inextricably linked to their original content.
Companies that have been established in television
for decades have enough content to air on their
platforms. Paramount owns Nickelodeon's content,
and HBO Max owns dozens of shows and movies
from Warner Bros. and Studio Ghibli (Blomeley
2021). For example, Disney retrieved all Marvel-
related content and all animations from Netflix (Yujin
2020). But Netflix is also trying to maintain its strong
position in the streaming market by creating
blockbuster franchises like Star Wars (Blomeley
2021). Many brands have also chosen to work on their
prices, either lowering prices to keep themselves
competitive or raising prices to make themselves
more profitable per user. Netflix's early success
through the integration of content from different
media channels, in the context of the streaming media
war, Netflix’s advantage is no longer obvious, need to
find another way out (Blomeley 2021).
But streaming companies need to make trade-offs
to maximize their profit. For example, to attract more
subscribers, Netflix started producing original content.
The squid game brought 4.38 million new subscribers
to Netflix (ÇEKEBİLİR 2021). But at the same time,
Netflix spent 21.4million to produce this opera (Clark
2021). Apple TV+ costs 6 billion to produce high-
quality content (Leswing 2019). The original series
was undoubtedly an attraction to users, but companies
still have to make a prediction and trade-offs between
the investment and the return. And companies also
need to make a good trade-off between subscription
price increases and the profit they can achieve.
According to the survey, it was found that 49% of
users would cancel their video streaming subscription
if the price went up (Susic 2023). If the price increase
leads to higher profits per subscriber, but results in the
loss of a large number of subscribers, it will be a lose-
lose situation.
4 CONCLUSION
A visualization of the subscriber’s data shows that the
streaming industry boomed in the early years because
of technological advances or because people were
tired of the limitation of cable TV. At the beginning of
2020, with the impact of the pandemic, the video
streaming service market reached its peak, and many
companies entered the industry and started competing.
These companies demonstrated the uniqueness of the
brand by taking back its movie rights, creating
original content, or offering customized services,
making each platform inimitable. Some movie studio
companies seem to have a better edge on the
competition than Netflix, and Amazon Prime Video
which are more like a movie program library. Thus,
these previous streaming leaders should find their
ways to reinforce their position.
However, it's easy to see through the charts that
while the number of subscribers to some of the older
streaming platforms has been declining in recent
years, the overall market, that is, the sum of
subscribers to all of the platforms, has been increasing
- that is, the market as a whole has been continuing to
steadily thrive. While brands continue to innovate and
increase their uniqueness, the industry continues to
progress, providing users with services that make
them more satisfied.
REFERENCES
C. Radio-television and T. Commission, “Results of the
fact-finding exercise on the over-the-top programming
services,” October 2011.
J. Stoll, “Video streaming worldwide – statistics & facts,”
Statista, August, 2023.
M. Keenan, “Top OTT statistics: market, live streaming,
OTT apps, advertising,” uscreen, September 2023.
H. Software, “Video streaming market size, share& covid-
19 impact analysis, by component (software and content
delivery services), by channel ( satellite TV, cable TV,
Internet protocol television (IPTV), and OTT
streaming), by vertical (education/ e-learning,
healthcare, government, sports/ esports, gaming,
enterprise and corporate, auction and bidding, fitness&
lifestyle, music& entertainment, and others
(transportation)), and regional forecast, 2023-2030,”
Fortune business insights, May 2023.
M. Woodward, “Amazon prime statistics: subscribers,
usage & revenue 2023,” Search logistics, July 2023.
A. Blomeley, “The rise of streaming platforms: more shows,
more money, more problems,” The crimson white, June
2021.
Analysis of the Factors Influencing Streaming Video Services’ Business Performance
101

L. Yujin, “The streaming war during the covid-19
pandemic,” Arts management & technology laboratory,
December 2020.
P. Susic, “30+ video streaming services market share,
subscribers, growth (data 2023),” Headphones addict,
February 2023.
C. Jing, “Produce 101 begins a wave of interest in Chinese
idol groups,” Pandaily, July 2018.
I. Barros, “Netflix’s international expansion strategy,”
Synergos, 2022.
S. Lee, S. Lee, H. Joo, “Examining factors influencing early
paid over-the-top video streaming market growth: a
cross-country empirical study,” MDPI, 2021.
A. Rehman, “How technology is improving the video
streaming experience,” Forbes, January 2019.
T. ahead, “The unassailable rise of Netflix”, ACCA, August
2023.
İ. ÇEKEBİLİR, “Squid game frenzy lures new subscribers
to Netflix,” Aljazeera, October 2021.
T. Clark, “Netflix reportedly spent $21 million on ‘Squid
game,’ its all-time biggest hit. Here’s how that
compares to other show budgets,” Business insider,
October 2021.
K.Leswing, “Apple is spending $6 billion on original shows
and trying to beat Disney + to market, reports FT,”
CNBC, C 2019.
DAML 2023 - International Conference on Data Analysis and Machine Learning
102
