
Study for Urals Oil Price Based on ARIMA Model
Meixuan Lou
Meadowvale Secondary School, Ontario, Canada
Keywords: Oil Price Prediction, ARIMA Model, Short-Term Forecasting, Time Series Analysis.
Abstract: In time series forecasting, oil price forecasting is one of the most famous studies. That is because oil price
forecast is essential, for the price of oil is related to transportation cost, stock market, and consumer purchasing
power. Under the Russian-Ukrainian conflict and COVID-19 pandemic circumstances, the oil of Russia has
been influenced a lot. However, nowadays, there is research on the oil price combined with the Russia-Ukraine
conflict and the COVID-19 pandemic. In this paper, both the Autoregressive Integrated Moving Average
Model (ARIMA) (p, d, q) model and the auto_ARIMA model are used to analyze the time series. The short-
term estimate for the ural oil price is based on the ARIMA (0, 1, 1) model, which is clarified in detail. The
findings demonstrated that in the short-term prediction area, the ARIMA (0, 1, 1)model has a strong and
reliable potential. In addition, the price of Urals oil is expected to increase shortly. Besides this model can
also be used in different situations.
1 INTRODUCTION
Vehicles, ships, and airplanes without oil, will lead to
transportation paralysis, boilers, and heating furnaces
without oil, will lead to factory shutdown. For most
people in the world fuel oil is one of the necessities.
In addition to being people's everyday commodity, oil
is also a vital strategic resource. As a consequence, a
secure supply of oil is linked not only to the daily lives
of individuals but also to the country's economic
progress and stability in society. In general, the price
of oil has always been intertwined with international
political struggles, competing interests in the global
war effort, and even social ideologies, human rights,
and ethnoreligious conflicts and contradictions
(Marbuah 2017).
Russia has the largest land area in the world,
covering 12 climatic zones. One of the most important
oil-producing regions of Russia is the Siberian Plain
and Siberian Lowland. Here, petroleum resources
exist in the form of deep underground deposits of oil
and natural gas. In addition, Russia's climatic
conditions are favorable for oil production (Shaw and
Oldfield 2007). The short summers at high latitudes,
lead to additional time for photosynthesis and
promote the accumulation of biomass. This also
provides conditions for the formation of oil.
The Russian-Ukrainian conflict ensued after the
outbreak of the COVID-19 (Ibendahl 2022 &
Nerlinger and Utz 2022). In June 2022, the EU
imposed successive embargoes on Russian crude oil
exports by sea, and in December, together with the G7
and Australia, imposed price restrictions on Russian
crude oil exports by sea to third countries (Martinho
2022, Razek et al 2023 & Ha 2023).
The fluctuation of the oil will affect economic
decisions, and knowing roughly where oil price is
going in advance will help people make decisions. This
essay uses the ARIMA model to help investigate
whether the Russian oil industry will be affected in the
context of the Russo-Ukrainian conflict or not by
predicting the price of the Ural oil shortly which is
considered as using the Autoregressive Integrated
Moving Average Model (ARIMA) model to conduct a
short period prediction to help people make decisions.
2 THE ARIMA MODEL
ARIMA models have been confirmed to produce
accurate forecasts for the immediate future. It
routinely outperforms models with complex structural
in terms of prediction in a short period. The future
value of a variable in the ARIMA model is the result
of the linear combination of values in priority and
errors in the past.
The mathematical expressions of the Auto-
Regressive (AR), Moving Average (MA), and
10
Lou, M.
Study for Urals Oil Price Based on ARIMA Model.
DOI: 10.5220/0012808900003885
Paper published under CC license (CC BY-NC-ND 4.0)
In Proceedings of the 1st International Conference on Data Analysis and Machine Learning (DAML 2023), pages 10-13
ISBN: 978-989-758-705-4
Proceedings Copyright © 2024 by SCITEPRESS – Science and Technology Publications, Lda.
ARIMA models are the following:
11 2 2
:
ttt ptpt
AR Y c Y Y Y
φφ φ ξ
−− −
−+ + + + +
(1)
112 2
:
tttt qtq
MA Y
μθ θ θ
−− −
=+∈+∈ +∈ + + ∈
(2)
11 2 2
112 2
ttt ptpt
tt qtq
Yc Y Y Y
φφ φ
θθ θ
−− −
−− −
=+ + + + +∈
+∈+∈++ ∈
(3)
Box and Jenkins created the ARIMA model in
1970 (Ariyo et al 2014 & Contreras et al 2003). This
model is one of the most frequently employed
strategies in future projection.
The ARIMA model is one of the most commonly
utilized prediction models. And the core of ARIMA (p,
d, q) model is the combination of the variations in
procedure and the ARIMA (p, q) model, thus, the
ARMA (p, q) model becomes the ARIMA (p, d, q)
model shortly after d times of difference. The
methods' complete steps are as follows:
Step 1: to check for stationarity, locate the data set
and use the Augmented Dickey-Fuller test.
Step 2: if the p-value turns out to be smaller than
0.05, then the data set until the p-value is no longer
larger than 0.05.
Step 3: calculate the optimal value of parameters
p, d, and q using the ACF plot, PACF plot, and
auto_ARIMA model.
Step 4: forecast the price of oil.
3 METHOD
3.1 Find the Data Set
The oil is considered to be used as the data set for,
Russia is one of the countries that was affected greatly
by the Russia-Ukraine Conflict. The reference oil
brand used to price Russia's export mixed oil is Ural
oil. It's a mixed oil that consists of both light oil from
Western Siberia and a mixture of heavy sour oil from
the Urals and the Volga region. As a result, the prices
of oil from August 2017 to July 2023 are chosen from
Trading Economics to carry on research and forecast.
Ural oil data used in this paper includes 1559
observations. After collecting those data, the time
series is then cut by week to obtain the average price
for each week.
3.2 Stationary Test
To predict the oil’s future price, the ARIMA model
algorithm is considered to be used.
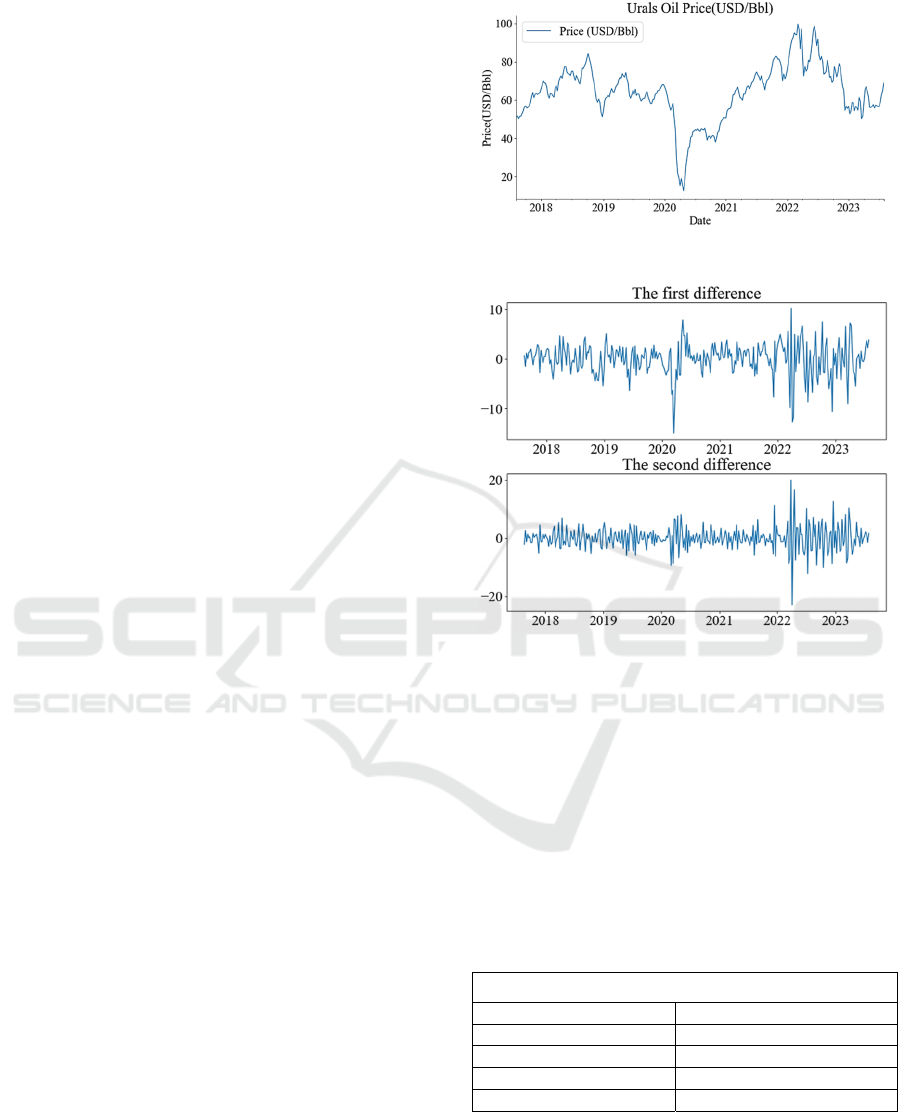
Figure 1 shows the data set of Urals oil weekly
average
price
on
the
opening
day
of
the
market
Figure 1: Urals oil price plot (Photo/Picture credit: Original).
Figure 2: First difference plot and second difference plot
(Photo/Picture credit: Original).
between August 2017 and July 2023. From the line
graph, it can be seen that the raw data is very unstable,
so the flowing step that needs to be introduced is to
differentiate the raw data set in order to get a smoother
data set.
Stationarity is one of the very important
components in the time series. Before the ARIMA
model forecasting model is used, the data set that is
being used needs to pass the ADF test.
Table 1: Adf Test Result of the Original Data Set.
ADF test result
ADF Test Statistic -1.979935560233871
P-value 0.29543935300876867
Critical Values
(
1%
)
-3.4521175397304784
Critical Values (3%) -2.8711265007266666
Critical Values (5%) -2.571877823851692
Through the ADF test in Table I, the p-value =
0.29543935300876867 > 0.05, which means that the
data set is not stationary. So, the next step is to
transform this time series into a stationary series by
differencing it.
Study for Urals Oil Price Based on ARIMA Model
11
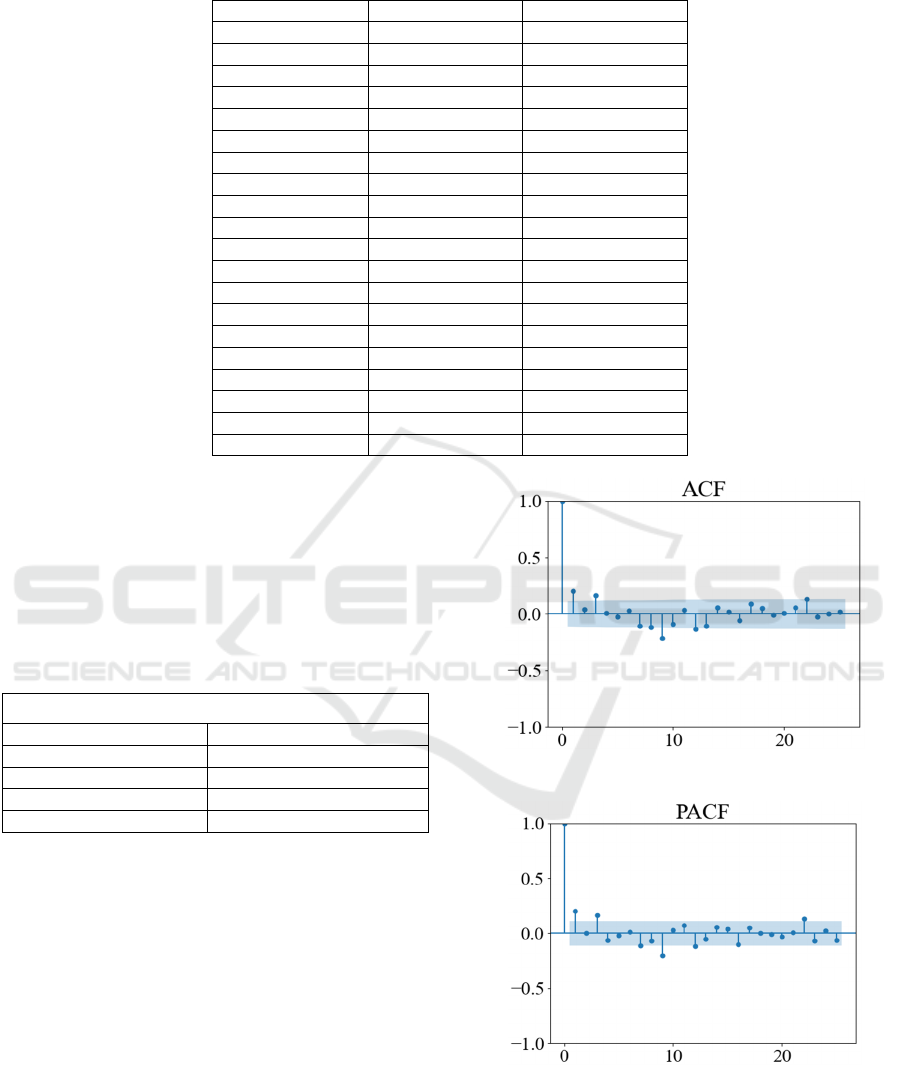
Table 3: Samples of the Actual Values, Predicted Values of ARIMA (0,1,1) and Their Difference Value.
Date Actual Values Predicted Values
2023/3/27 52.05 48.58
2023/4/3 64.65 52.4
2023/4/10 66.32 60.4
2023/4/17 65.79 66.92
2023/4/24 63.93 67.1
2023/5/1 62.2 63.89
2023/5/8 58.53 61.13
2023/5/15 56.46 55.08
2023/5/22 56.78 56.37
2023/5/29 57.37 56.75
2023/6/5 58.27 57.92
2023/6/12 57.37 55.37
2023/6/19 58.08 57.88
2023/6/26 55.74 56.9
2023/7/3 58.61 56.5
2023/7/10 61.53 56.8
2023/7/17 61.51 59.54
2023/7/24 67.41 63.47
2023/7/31 70.23 65.36
2023/8/7
?
69.67
Figure 2 shows a plot of the data after the first-
order difference and second-order difference which
shows that the data after the first-order difference is
much more smoother than the raw data set. To
determine whether the data after the first-order
difference is smooth enough. The result of the data
after the first difference is then tested for its p-value.
Table 2: Adf Test Result of the First Difference.
ADF test result
ADF Test Statistic -7.6390610799093315
P-value 1.917481762349957e-11
Critical Values
(
1%
)
-3.4521175397304784
Critical Values (3%) -2.8711265007266666
Critical Values (5%) -2.571877823851692
Table 2 contains the values of the ADF test of the data
set after the first difference. Through the ADF test, the
𝑝𝑣𝑎𝑙𝑢𝑒 1.917481762349957𝑒11 0.05 ,
which signifies that the time series following this
treatment is deemed stationary. As a result, the value
of the parameter d can be calculated to be 1.
3.3 Determine the Values of
Parameters P and Q
The following step is to find the autocorrelation
coefficient and partial correlation coefficient which
are shown in the ACF plot of Figure 3 and the PACF
plot of Figure 4. When modeling ARIMA(p, d, q) for
time series, one of the most troublesome things is to
Figure 3: ACF plot (Photo/Picture credit: Original).
Figure 4: PACF plot (Photo/Picture credit: Original).
determine the hyperparameters p, d, and q. The
conventional practice is to use the stationarity test to
determine parameter d first, and then observe p and q
through ACF and PACF plots (Ahmed and Shabri
DAML 2023 - International Conference on Data Analysis and Machine Learning
12
2014). This combination of machine and manual
methods often takes a long time to develop and it's
error-prone.
A more convenient way is to call auto_ARIMA
directly. It turns out that when the values of the
parameters are (0, 1, 1), the AIC value equals
5014.207, which is the smallest value in all the test
models. When comparing the AIC of several models
for a given data set, the "best" model among all those
available for the data set is the one with the lowest
AIC score. Even if only subpar models are taken into
account, the AIC will still be able to choose the best
one. As a consequence, the ARIMA (0, 1, 1) is the best
algorithm for this collection of data (Mazerolle 2006
& Gasper and Mbwambo 2023).
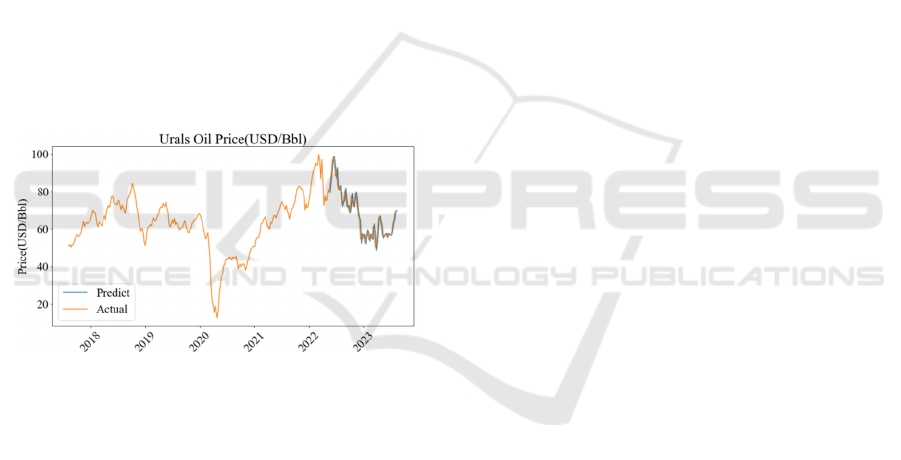
3.4 The Comparison Between Actual
Values and Predicted Values
Figure 5 and Table III show the actual values of the
weekly data set and predicted values of the ARIMA
(0, 1, 1) model. As it is shown in the plot and table,
the Urals oil’s price will rise next week.
Figure 5: Plot of comparison with real and anticipated
values (Photo/Picture credit: Original).
4 CONCLUSIONS
The price of Urals oil is not stationary and it can be
affected by several factors, such as oil commodity and
financial attributes, supply and demand in the oil
market, the international economic situation,
fluctuations in the US dollar's exchange rate, and the
role of the law of value on the five major factors
affecting it. According to the study’s findings, the
Autoregressive Integrated Moving Average Model
(ARIMA) (0, 1, 1) is the best model used for the
future value prediction of the oil and it presented that
the average price in the next week will increase.
The study of oil price trends and the development
and application of forecasting models are both
important tools for financial strategy development
and important macroeconomic management tools.
However, at the same time, various models also have
certain limitations and risks, which need to be flexibly
selected in light of the specific market environment
and needs.
Besides, this model can also be used to conjecture
the price of another object in the future. The
seasonality of the data can also be taken into account
when constructing the model. BIC can be introduced
in addition to AIC to help provide a more
comprehensive view.
REFERENCES
G. Marbuah, Understanding crude oil import demand
behaviour in Africa: The Ghana case. Journal of
African Trade, vol.4, no.1-2, 2017, pp. 75-87.
D. J. Shaw, J. D. Oldfield, Landscape science: a Russian
geographical tradition. Annals of the association of
american geographers, vol.97, no.1, 2007, pp. 111-
126.
G. Ibendahl, The Russia-Ukraine conflict and the effect on
fertilizer. Department of Agricultural Economics,
Kansas State University: Manhattan, KS, USA. 2022.
M. Nerlinger, and S. Utz, The impact of the Russia-Ukraine
conflict on energy firms: A capital market perspective,
vol.50, 2022, pp.103243.
V. J. P. D Martinho, Impacts of the COVID-19 pandemic
and the Russia–Ukraine conflict on land use across
the world. Land, vol.11, no.10, 2022, pp.1614.
A. Razek, N. H. Galvani, V. et al. Can US Strategic
Petroleum Reserves Calm a Tight Market
Exacerbated by the Russia-Ukraine Conflict? 2023,
pp.4441644.
L. T. Ha, Dynamic interlinkages between the crude oil and
gold and stock during Russia-Ukraine War: evidence
from an extended TVP-VAR analysis. Environmental
Science and Pollution Research, vol.30, no.9, 2023,
pp. 23110-23123.
A. Ariyo, A. Adewumi, et al. Stock price prediction using
the ARIMA model. In 2014 UKSim-AMSS 16th
international conference on computer modelling and
simulation, IEEE. 2014, pp. 106-112.
Contreras, J., Espinola, R., et al. ARIMA models to predict
next-day electricity prices. IEEE transactions on
power systems, 2003, 18(3), pp. 1014-1020.
R. A. Ahmed, A. B. Shabri, Daily crude oil price forecasting
model using arima, generalized autoregressive
conditional heteroscedastic and support vector
machines. American Journal of Applied Sciences,
vol.11, no.3, 2014, pp. 425.
M. Mazerolle, Improving data analysis in herpetology:
using Akaike's Information Criterion (AIC) to assess
the strength of biological hypotheses. Amphibia-
Reptilia, vol.27, no.2, 2006, pp. 169-180.
L. Gasper, H. Mbwambo, Forecasting crude oil prices by
using ARIMA model: evidence from Tanzania. 2023.
Study for Urals Oil Price Based on ARIMA Model
13
