
Short-Term Metro Daily Passenger Flow Prediction Using Machine
Learning
Leyang Liu
School of Science, Renmin University of China, Beijing, China
Keywords: Time Series Analysis, Machine Learning, Passenger Flow Prediction.
Abstract: The prediction of daily passenger flow in the metro would be meaningful to the construction and operation of
urban rail transit, which is common in megacities of China. The study takes the daily passenger flow of the
Beijing metro as an example and tries to make a short-term prediction of it based on its historical data. Since
the data volume is relatively small, resulting in an overfitting problem when applying mainstream time series
models like Recurrent Neural Network (RNN) and Long Short Term Memory (LSTM), four selected machine
learning models are applied to this topic. Their prediction performance is compared by not only the common
indicator like Mean Squared Error (MSE) and their comprehensive performance. The result shows that the
machine learning models considering both seasonality and holiday factors perform best and have the strongest
interpretability. For future research, it’s possible that the combination of multiple machine learning models
would achieve better results or with stronger interpretability in this topic.
1 INTRODUCTION
With the acceleration of urbanization in China, many
people are flooding into megacities. A common
solution to transport such a large volume of passengers
is establishing a transportation system based on rapid
rail transit, with conventional public transportation and
multiple transportation modes coordinating, where
urban rail transit is the top priority. Passenger flow is
the basis of the planning, design, construction, and
operation of urban rail transit. Therefore, passenger
flow prediction is an important link in the construction
and operation of urban rail transit, which to a
considerable extent determines the form and cost of the
line, the selection of operating vehicle models, and the
size of train stations. With the improvement of the
urban rail transit network and the increasing intensity
of passenger flow, it is particularly important to grasp
the trend of passenger flow changes in the short term
in the future. Since the total length of metro lines
accounted for 77.8% of the total length of urban rail
lines, the metro passenger flow prediction is a vital part
of the urban rail passenger flow prediction and an
emerging research field that triggers significant social
attention.
The study will use the Beijing metro as an example
to predict the daily overall metro passenger flow, a
typical time series prediction problem. The passenger
flow will be influenced by historical data, holidays,
and other factors (Zheng et al 2021). The basic idea is
to divide the dataset into the training set and the test
set, using the training set data to train the model and
capture periodic and holiday features in the data, then
compare and analyze the predicted passenger flow by
the model and the true value in the test set. The study
hopes to provide a reasonable method to predict daily
passenger flow according to historical data and
holiday information.
2 DATA SOURCE AND
COLLECTION
The study used the daily passenger flow of the Beijing
Metro from February 13 to August 10, 2023, for
approximately half a year. Due to the COVID-19
epidemic, Beijing was in a state of long-term
lockdown from the beginning of 2020 to December
2022, with subway passenger flow at a low level in the
past three years; from December 2022 to January
2023, despite the unblocking of China, nearly 90% of
the people are infected with COVID-19, which means
the metro passenger flow was at an even lower level.
The data during that period is of limited reference
significance since the public has a stronger confidence
to travel and stronger resistance toward COVID-19.
Although the passenger flow before the epidemic
faced a similar social situation and public travel
confidence, the reference value of passenger flow
Liu, L.
Short-Ter m Metro Daily Passenger Flow Prediction Using Machine Learning.
DOI: 10.5220/0012809800003885
Paper published under CC license (CC BY-NC-ND 4.0)
In Proceedings of the 1st International Conference on Data Analysis and Machine Learning (DAML 2023), pages 349-355
ISBN: 978-989-758-705-4
Proceedings Copyright © 2024 by SCITEPRESS – Science and Technology Publications, Lda.
349
before the epidemic was not significant due to the
opening of some new metro lines in Beijing during the
epidemic period. The study only selected metro
passenger flow data from February 2023 onwards.
Since long-term prediction may be affected by subway
construction planning and has little application value,
the study aims at short-term prediction. Therefore the
six-month dataset should be sufficient.
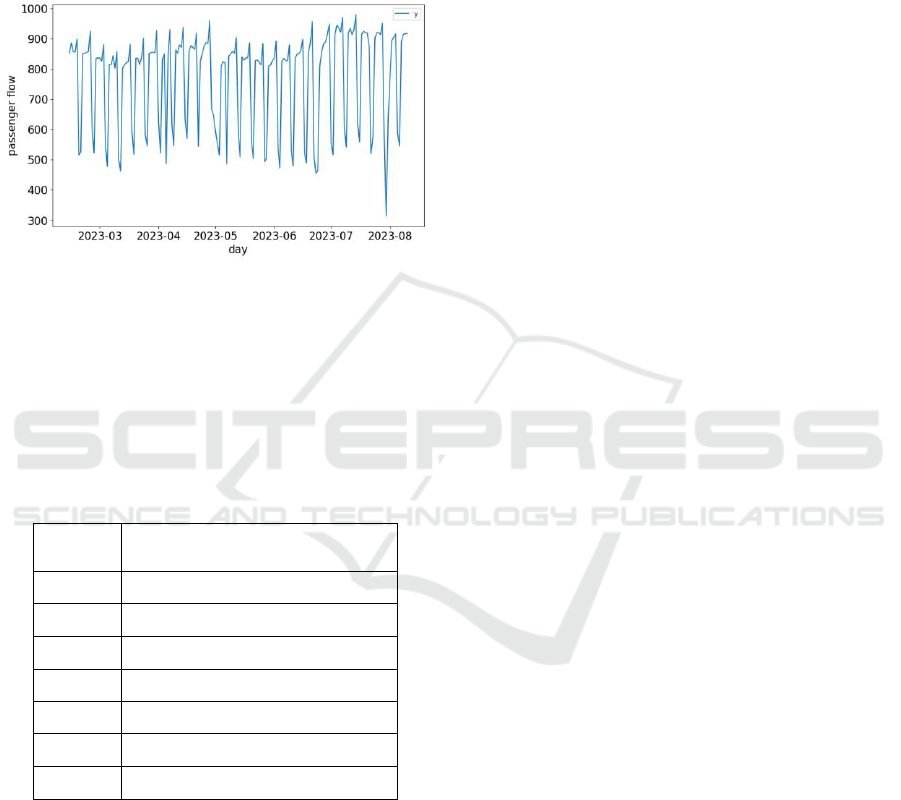
Figure 1: Daily passenger flow of Beijing metro
(2023.2.13-2023.8.10) (Original).
The data is collected from the official Weibo
account of Beijing Metro. Daily traffic data is filtered
and stored in an Excel file by crawling down all posts
on the official Weibo account. The format of the data
is presented in Table 1 and the data is visualized in
Figure 1.
Table 1: Example of the Passenger Flow Data.
Date
Passenger Flow(ten thousand people)
2023-2-13
851.06
2023-2-14
885.72
2023-2-15
856.93
2023-2-16
855.13
2023-2-17
897.63
2023-2-18
514.52
2023-2-19
524.49
3 ANALYTICAL METHODS
Zeng (2021) indicates that because historical
passenger flow data can reflect future passenger flow
trends, time series models are widely used in
passenger flow prediction (Zeng et al 2021).
Meanwhile, in megacities like Beijing, the metro is the
first commuting choice for many office workers.
Therefore, commuter passenger flow is an important
component of metro passenger flow, which endows
daily subway passenger flow with significant
periodicity, that is, the passenger flow on weekdays is
significantly greater than that on weekends, and the
cycle is one week (7 days). It should also be noted that
metro passenger flow is significantly affected by
holidays, especially during large and long holidays
such as summer vacations.
Based on the above considerations, the selected
time series model should be suitable for periodic data.
Limited by the data volume, some mainstream, more
complex passenger flow prediction models, such as
Long Short Term Memory (LSTM) and Transformer
neural networks, risk overfitting and weak
interpretability (Haimin et al 2019, Yuanhong et al
2023 & Yun 2022). Thus the study selected the
following four more explanatory models for
comparative analysis.
3.1 SARIMA
The basic idea of the ARIMA (Auto Regressive
Integrated Moving Average) model is to use the
historical information of the data itself to predict the
future. It extracts the patterns of time series hidden
behind the data through autocorrelation and
differentiation and then uses these patterns to predict
future data, which can better capture the trend changes
of the data (Taylor and Letham 2021, Triebe et al 2021
& Qingmei and Xiping 2020). The formula is as
follows.
φ
φ
θ
θ
. Where Y is the time
series under consideration, φ
the parameters
of the AR (Auto Regressive) model, describing the
correlation between the current value and the values
of p past ttimepoints; θ
are the
parameters of the MA (Moving Average) model,
describing the correlation between the current value
and the error at q past time points. C is the constant
term and ε
is the error term. Y should be a stationary
sequence, and when the data is a non-stationary
sequence, it can be transformed into a stationary
sequence through differentiation.
SARIMA (Seasonal Auto Regressive Integrated
Moving Average) is a seasonal time series prediction
model based on the ARIMA model (Hahn 2023,
Tiwari et al 2022 & Chatterjee et al 2021). It first
performs seasonal differentiation, which removes
seasonal components from the time series.
Specifically, a n-order differentiation is performed
when the seasonal period is n. Then the ARIMA
model is fitted with the differential sequence. Due to
the significant periodicity of metro passenger flow
data, the study adopted the SARIMA model.
DAML 2023 - International Conference on Data Analysis and Machine Learning
350

3.2 Holt-Winters
Holt Winters is an optimization of the MA (Moving
Average) method, which uses the cubic exponential
smoothing method to input historical time series data
into three recursive sequences, then calculate the
predicted data values from the recursive values of the
three sequences (Chatterjee et al 2021). This method
can effectively predict non-stationary sequences with
linear trends and periodic waves. A "cumulative"
exponential smoothing will be used for subway
passenger flow data. The formula is as follows.
(1)
(2)
(3)
(4)
(5)
(6)
Where is the data smoothing factor and ;
is the trend smoothing factor and ; is
the seasonal change smoothing factor and
. m is the length of time that needs to be predicted and
L is the length of the cycle.
3.3 Prophet
Prophet is a Facebook open-source time series model
that takes trend lines, seasonality, periodicity, and
exogenous variables into account during the modeling
process. It has good predictive performance and
significant advantages over traditional time series
models. The formula of the model is as follows.
(7)
Where g(t) is the trend term, s(t) is the seasonal or
periodic term and h(t) is the holiday term or mutation
caused by the big event. The trend term includes linear
growth models and logistic growth models. For
periodic changes, the model uses the Fourier series to
simulate.
(8)
The values of N and P vary depending on the
period. The paper recommends using P=7 and N=3 for
weekly seasonality (Taylor and Letham 2021). The
combination of seasonal and trend terms includes
addition and multiplication. For the collected data,
after testing, it is better to use linear trend terms and
additive combinations.
Meanwhile, the Prophet model allows for the
inclusion of holiday terms, so holiday changes in metro
passenger flow caused by summer vacation are
considered based on trends and periodic changes.
Particularly, two columns of Boolean variables are
added to the Data Frame of the original data to
determine whether it is in the summer season. The
judgment criteria are that when the months are July and
August, it is considered to be in the summer season.
Table 2: Example of the Data Format after Adding Boolean
Variables that Determine whether It Is in the Summer
Holiday.
Date
Passenger
Flow
On
Summer
Holiday
Off
Summer
Holiday
2023-2-13
851.06
False
True
2023-2-14
885.72
False
True
2023-8-9
915.99
True
False
2023-8-10
916.31
True
False
3.4 Neural Prophet
Neural Prophet is a decomposable time series model
just like Prophet (Triebe et al 2021). Compared to the
previous version of the Prophet model, it has similar
components such as trend, seasonality, and special
events. The difference lies in the introduction of auto-
regression terms, future regression terms, and lagged
regression terms. The trend is modeled by a linear or
combined model of multiple linear trends that includes
various change points. Seasonality is modeled using
Fourier terms, and autoregression terms are processed
using AR Net, an autoregression feed-forward neural
network used for time series. Lagged regression terms
are also modeled using a single feed-forward neural
network. Future regression terms and special events
are both covariant of the model.
For a classic AR model, the modeling process
p-order autoregression can be understood as a linear
combination of several past data.
(9)
When modeling autoregression terms using AR
Net, Neural Prophet directly imitates the expression of
Classic AR in the first layer, adding several hidden
layers to achieve more accurate predictions. The
learning process still uses MSE as the loss function,
also to maintain consistency with Classic AR.
For the prediction of subway passenger flow, the
settings of trend, season, and holiday items will be
Short-Term Metro Daily Passenger Flow Prediction Using Machine Learning
351
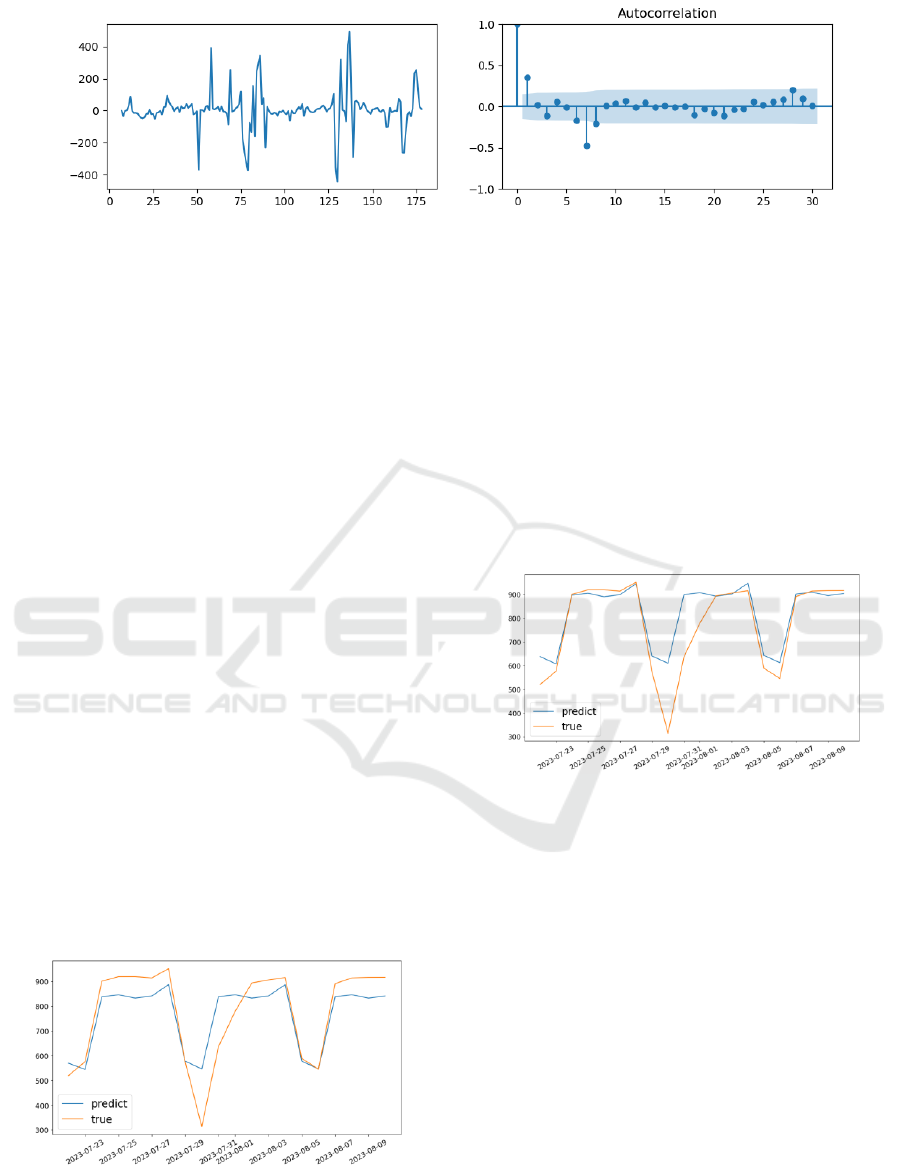
Figure 2: Result of the ADF test after removing seasonality (Original).
consistent with Prophet. Based on this, a lagged
regression term will be added as a comparison.
4 RESULT ANALYSIS
Since the Prophet and Neural Prophet need to consider
the effects of summer vacation, a part of the data on
summer holidays needs to be included in the training
set. Therefore, the data from the last 20 days is divided
into the test set, and the remaining data is divided into
the training set. Use the trained model to predict the
passenger flow of the validation set for the 20th day
and compare it with real data, using MSE as the
evaluation indicator.
4.1 SARIMA
After removing seasonality, an ADF test was
conducted on the data, as shown in Figure 2. The
sequence is relatively stable, thus the ARIMA model
can be applied to the sequence.
After establishing the ARIMA model, the predicted
results are shown in Figure 3. It’s clear that the model
reflects a cyclical trend within a week. Still, the
predicted values are significantly lower than the true
values in weekday data. Considering that all the test set
data are within the summer vacation, it is reasonable to
speculate that the model did not consider the rise of
passenger flow in summer vacation.
Figure 3: Performance of SARIMA model on the test set
(Original).
4.2 Holt-Winters
The prediction result of the Holt-Winters model is
shown in Figure 4. Compared to the SARIMA model,
Holt-Winters not only reflects periodic changes but
also fits better with the original data. Notably, there are
two days when the true values are significantly lower
than predicted. Considering the rainstorm in Beijing
from July 30 to August 1, 2023, a reasonable
explanation is that people's travel was blocked in the
heavy rain, and the passenger flow was significantly
reduced, which is an accidental incident. Overall, the
model has good prediction performance.
Figure 4: Performance of Holt-Winters on the test set.
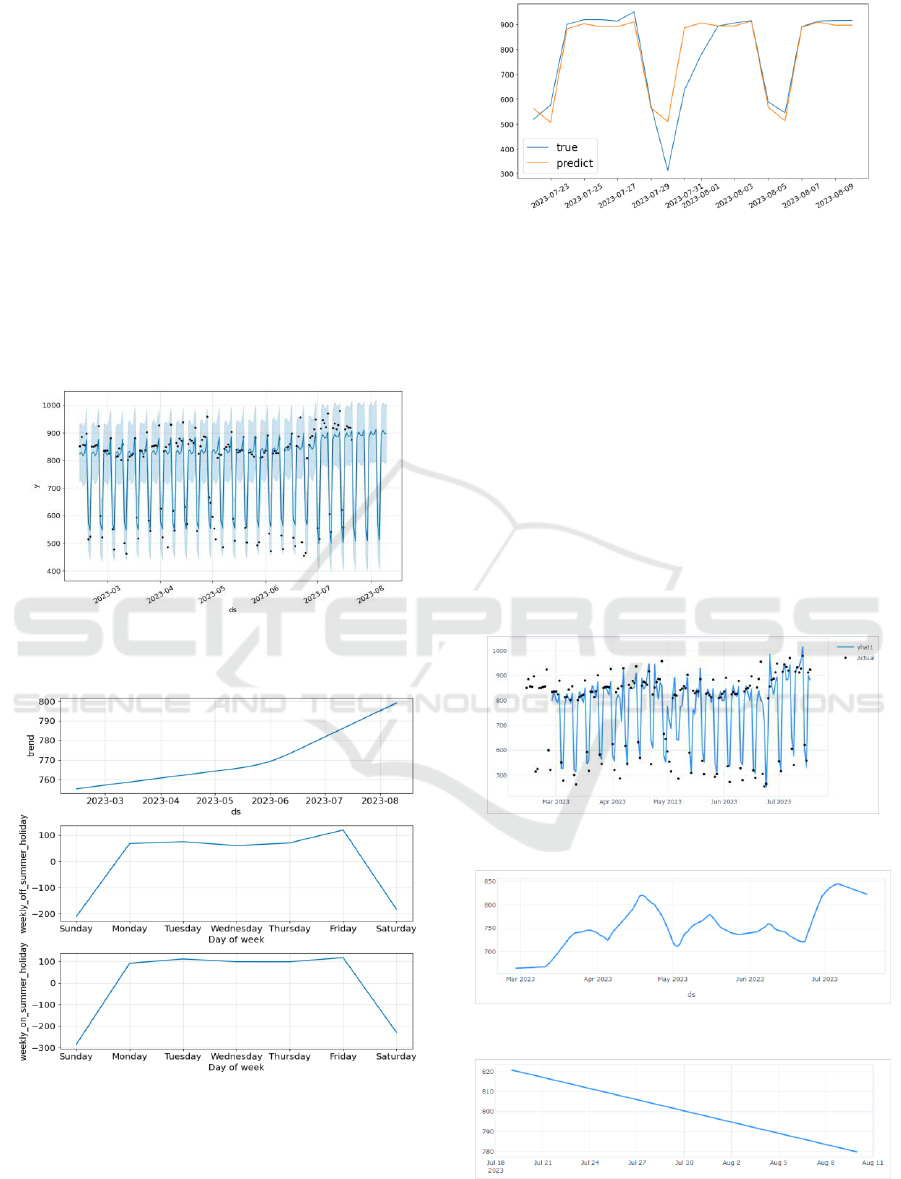
4.3 Prophet
After considering the impact of summer vacation on
passenger flow, the result is shown in Figure 5, the
contribution of each component to the passenger flow
is shown in Figure 6, and the performance on the test
set is shown in Figure 7. It can be seen that the trend
term went upwards generally. Considering that with
the loose of epidemic policies, public confidence in
travel significantly increased, and China's economic
development is gradually stabilizing, the overall
growth trend can be expected. As for the periodic
change term, there is a clear periodic feature that
passenger flow stays relatively high on weekdays and
relatively low at weekends in both summer and
nonsummer seasons, which truly reflects the impact of
commuting passenger flow. Another noteworthy
feature is the greater fluctuation in passenger flow on
summer vacation. One possible explanation is that
DAML 2023 - International Conference on Data Analysis and Machine Learning
352
during the summer vacation, due to increased ecdemic
tourists, local people in Beijing travel less on
weekends. These people contribute to the total
passenger flow on weekends off summer vacation, but
do not contribute to passenger flow on weekends on
summer vacation; During the summer vacation, the
passenger flow on weekdays is jointly contributed by
commuters and ecdemic tourists, while during
nonsummer vacation, there are almost no ecdemic
tourists on weekdays. In conclusion, the delta of
passenger flow between weekdays and weekends on
summer vacation mainly results from the commuters.
In contrast, off summer vacation, the delta needs to
consider the decrease of commuting passenger flow
and the increase of local tourists. Therefore, there’s
an Increased fluctuation in passenger flow on summer
vacation.
Figure 5: The results of the model fitting the data after
considering the impact of summer vacation (Original).
Figure 6: The contribution of different components in the
Prophet (Original).
Figure 7: Performance of Prophet on the test set (Original).
4.4 Neural Prophet
After making corresponding settings, the performance
of the model on the test set is shown in Figure 8, the
contribution of trend term on the train set is shown in
Figure 9, the contribution of trend term on the test set
is shown in Figure 10, and the comparison between the
test set and the true value is shown in Figure 11. It can
be seen that although the predicted values on the test
set are more in line with the true values and capture
periodic features in the data, the fluctuation of the trend
term is very severe and weird, and it seems to be overly
affected by the fluctuation of the data. Even on the test
set, the trend term saw an unusual downward trend,
significantly different from the actual situation. It is
inferred that the model has been overfitting.
Figure 8: Result of Neural Prophet fitting the data (Original).
Figure 9: Contribution of trend term on train set (Original).
Figure 10: Contribution of trend term on test set.
Short-Term Metro Daily Passenger Flow Prediction Using Machine Learning
353
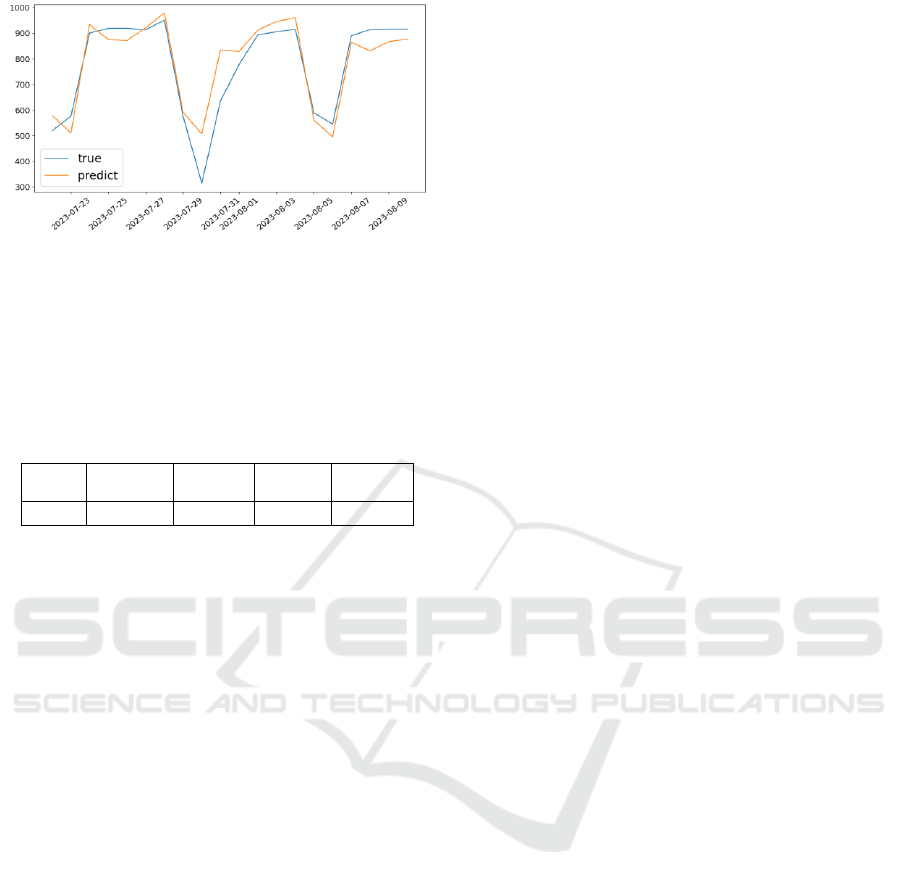
Figure 11: Performance of Neural Prophet on test set
(Original).
4.5 Overall Comparison
The MSE of the four models on the test set is shown
in Table 3.
Table 3: MSE of Four Models on the Test Set.
Model
SARIMA
Holt-
Winters
Prophet
Neural
Prophet
MSE
7912.78
10120.70
6489.86
5616.15
Due to the influence of the outliers resulting from
the rainstorm from July 30 to August 1, the MSE of
each model is relatively large and is seriously affected
by the outliers, which cannot be directly used as the
standard for judging the quality. Overall, the best-
performing model is Prophet, followed by Holt-
Winters and SARIMA, while Neural Prophet exhibits
significant overfitting when the autoregressive term is
included.
5 CONCLUSION
The traditional SARIMA and Holt-Winters models
capture the periodic characteristics of Beijing subway
passenger flow within a week. Still, it is difficult to
reflect the impact of holidays or other big events.
Therefore, prediction accuracy, especially during
holidays, is relatively low; The Prophet model takes
holidays into account and can customize the start and
end dates of holidays. It achieves good results
regardless of whether the predicted period is during
holidays or not, with higher prediction accuracy. The
Neural Prophet model incorporates the autoregressive
term. Judging from the MSE, it performs best on the
test set, but from the component decomposition
graphs, it is clear that the model overfits the data.
Currently, some mainstream passenger flow
prediction models have adopted relatively complex
combination neural networks. However, from the
results, for daily passenger flow prediction, due to the
complexity of the data, complex models are not the
most suitable models. Instead, simple machine
learning models are sufficient to capture important
features in the data of daily passenger flow. As shown
in the results, the models that consider holiday factors
perform better than those that only consider cyclical
and seasonal features.
The study has provided a general daily passenger
flow prediction method and shown the result of some
single machine learning models. It’s still worth
exploring whether combining multiple machine
learning models would achieve better results or
stronger interpretability in this topic. Another
direction worth exploring is how to reduce the
problem of overfitting complex models like neural
networks and enhance their interpretability in this
topic. Also, an important factor that is widely
overlooked is weather. It would be advisable to take
the weather into account. For example, when the
weather is very hot, people are likely to choose the
subway as a means of transportation due to the cooling
effect of the air conditioning in the subway and the
comfortable environment.
REFERENCES
Z. Cheng, W. Jiayuan, L. Xia. Literature Review of Short-
term Passenger Flow Forecast for Urban Rail Transit.
Railway Transport and Economy, 2021, vol.43, no.08,
pp.105-111+125.
Y. Haimin, P. Zhisong, B. Wei.Review of Time Series
Prediction Methods. Computer Science, 2019, vol.46,
no.01, pp.21-28.
M. Yuanhong, S. Chenchen, X. Luyu, L. Xi, C. Bo, H.
Pengchao. A survey of time series forecasting methods
based on deep learning. Microelectronics & Computer,
2023, vol.40, no.4, pp.8-17.
S. Yun. A Review of Time Series Classification Methods
Based on Deep Learning. Electronic Technology &
Software Engineering, 2022, no.14, pp.259-262.
SJ. Taylor, B. Letham. Forecasting at scale. PeerJ Preprints,
2021, vol.5, pp. e3190v2.
O. Triebe, H. Hewamalage, P. Pilyugina, N.P. Laptev, C.
Bergmeir, and R. Rajagopal. NeuralProphet:
Explainable Forecasting at Scale, 2021. vol.2111,
pp.15397.
Z. Qingmei, H. Xiping. Review of Methods for Short-Term
Prediction of Subway Passenger Flow. Journal of
Chongqing Technology and Business University
(Natural Sciences Edition), 2020, vol.37, no.1, pp.25-
32.
L. Hahn. Forecasting seasonal criminality using SARIMA:
an application to monthly aggravated assaults in
California, 2023.
S. Tiwari, R. Chandra, and S. Agarwal. Forecasting
COVID- 19 cases using Statistical Models and
DAML 2023 - International Conference on Data Analysis and Machine Learning
354

Ontology-based Semantic Modelling: A real time data
analytics approach, 2022, vol.2206, pp.02795.
A. Chatterjee, H. Bhowmick, and J. Sen. Stock Price
Prediction Using Time Series, Econometric, Machine
Learning, and Deep Learning Models. 2021 IEEE
Mysore Sub Section International Conference
(MysuruCon), 2021, pp.289-296.
Short-Term Metro Daily Passenger Flow Prediction Using Machine Learning
355
