
Prediction of the Probability of Stroke Based on the Random Forest
Bowen Tang
Wuchang Anglo Experimental High School, Wuhan, China
Keywords: Stroke, Predict, Probability, Random Forest.
Abstract: As stroke is becoming more and more popular worldwide range among elderly people, it is found that having
it brings irreversible damage to the human body and also a commercial burden to families and the medical
resources of a country. According to studies, about 6 million patients died after experiencing stroke and most
of them had previous symptoms before having it while they ignored them. Predicting the probability of
avoiding the disease comes out to be the only and the most effective solution for stroke. In this paper, the
contributions of stroke will be found while figures of correlations with stroke will be produced using Python
and a random forest model. The aim of this paper is to use Python to predict the probability of stroke based
on a random forest model, which is necessary for preventing stroke in advance and has a chance to save
millions of lives from having stroke.
1 INTRODUCTION
2.1 Background Research
Stroke, also known as Cerebral stroke, refers to the
death of brain cells caused by cerebral ischemia. It is
also often referred to in the medical literature as a
cerebrovascular event (CVE), cerebrovascular
accident (CVA), cerebrovascular incident (CVI), or
brain attack.
In 2020, approximately 20 million people
worldwide experienced stroke, and about 5 million
people had a history of stroke and still survived.
Between 2015 and 2018, the annual incidence of
stroke decreased by about 10%~15% in developed
countries and increased by about 15% in developing
countries (Qiang et al 2020). In 2015, stroke remained
the second most common cause of death in humans.
After coronary disease, accounting for about 12% of
the total (6, in total), about 3 300 000 died from
ischemic stroke and 3,200,000 due to hemorrhagic
stroke (Wenlong 2018 & Rui et al 2021). Overall, two-
thirds of strokes occur in people over 65, and about
half of those who have had a stroke have an average
life of less than one year (Paray 2023).
According to the data from the World Health
Organization (WHO), 70%~80% of stroke survivors
have different degrees of body or mental disability,
which not only increases the economic burden of the
family and society but also puts the Healthcare
Industry under enormous pressure (Wenlong 2018).
It is estimated that the treatment cost and indirect
economic loss of a stroke patient in that year reached
about 10,000 yuan, and scientific prediction and
timely prevention and treatment of stroke can save
tens of billions of yuan of expenditure every year. Due
to the lack of obvious clinical symptoms before the
onset of stroke, how to effectively prevent it has
become a world-class problem.
Stroke usually occurs and progresses very quickly,
usually within seconds to minutes, but can also be a
symptom of slow progression. Some patients will have
mild symptoms in the early stage of stroke, such as
memory loss, sensory (hearing, vision, etc.) decline,
confusion, and abnormal behavior, if not properly
treated as soon as possible, can lead to serious
consequences, causing irreversible damage to the
patient, and the chance of stroke within three months
can reach 30% to 50%. Therefore, stroke prevention
can save research on the prediction of stroke is crucial
and meaningful to stroke prevention, which can save
millions of lives.
In this paper, the project aims to predict the patient
stroke possibility using the current database and
Python to visualize the data, to help people have better
awareness about the causes of stroke and reduce the
risk of getting a stroke.
42
Tang, B.
Prediction of the Probability of Stroke Based on the Random Forest.
DOI: 10.5220/0012809900003885
Paper published under CC license (CC BY-NC-ND 4.0)
In Proceedings of the 1st International Conference on Data Analysis and Machine Learning (DAML 2023), pages 42-46
ISBN: 978-989-758-705-4
Proceedings Copyright © 2024 by SCITEPRESS – Science and Technology Publications, Lda.

2 METHOD
The method and theory adopted by the prediction is
the model of random forest, which is a commonly used
machine learning algorithm trademarked by Leo
Breiman and Adele Cutler, which combines the output
of multiple decision trees to reach a single result. The
advantage of the ease of use and flexibility of the
model is the main contribution to its adoption, as it
provides solutions for both classification and
regression problems.
3 GENESIS ANALYSIS
To predict the probability of stroke, the contribution
of stroke is necessary to be analyzed.
According to the research, the causes and
contributions of stroke are complicated while most of
them are chronic diseases except for variables such as
gender and age (Wenlong 2018, Rui et al 2021 &
Wang et al 2023).
3.1 Hypertension
Hypertension accounts for 35%~50% of the risk of
having a stroke (Wenlong 2018). Epidemiological
studies have shown that if blood pressure is reduced
by 5~6 mmHg systolic blood pressure, 2~3 mmHg
diastolic blood pressure will also reduce the risk of
stroke by 40% (Rui et al 2021). Studies have further
shown that lowering blood pressure is effective in
preventing both ischemic and hemorrhagic stroke
(Xiaoxia et al 2022). Antihypertensive therapy is
beneficial for both elderly patients over 80 years of
age and isolated systolic hypertension (Yewen 2020).
Recent studies have shown that high-intensity
antihypertensive therapy reduces the risk of stroke
even more (Leal et al 2020).
3.2 Heart Disease
Atrial fibrillation, which is a type of heart disease, is
the most common arrhythmia in clinical practice, with
a 5% risk of induced stroke per year, and an even
higher risk of stroke in patients with valvular atrial
fibrillation (Rowan et al 2019). Atrial fibrillation can
cause poor blood flow, so the blood in the atria will
clot more easily, causing blood clots and blood clots
in the atrium, when the blood clots flow to the brain
with the blood circulation, it will block the cerebral
arteries, resulting in stroke. Studies have shown that
patients with atrial fibrillation are 5 times more likely
to have a stroke than normal people, the recurrence
rate of stroke caused by atrial fibrillation is high, and
the prognosis is poor. Statistics show that 1 in 20
patients with atrial fibrillation will have a stroke
within 1 year (Paray 2023 & Rowan et al 2019).
Therefore, for patients with atrial fibrillation, how to
effectively prevent stroke is a very important issue
(Wang et al 2023).
3.3 High Cholesterol
The relationship between high cholesterol and stroke
remains unclear (Rui et al 2021). However, data from
meta-analysis has shown that statins reduce the risk of
stroke by about 15% (Seo et al 2017). Other lipid-
lowering drugs have little effect on stroke reduction
(Xiaoxia et al 2022). Recent studies show that statins
may reduce stroke through other mechanisms (Rowan
et al 2019).
3.4 Diabetic
Studies have shown that stroke in diabetic patients is
2~3 times higher than that of ordinary people and
diabetes, is often accompanied by hypertension and
lipids. High-intensity diabetes treatment can be
reduced. Anticoagulant efficacy needs to be
suppressed (Rui et al 2021).
4 RESULTS & DISCUSSION
According to previous research on the contribution of
stroke, most of the contributions are chronic diseases,
which is able to be monitored by BMI and blood
glucose. Also, chronic diseases can be closely related
to age and gender (Seo et al 2017). As the prediction
demands a comparison, it is also necessary to form a
figure of the correlation between stroke patients and
non-stroke patients. Therefore, after collecting
meaningful data from Kaggle about the gender, age,
BMI, and blood glucose index of 200 stroke patients,
forming figures to show the relationships between the
index of stroke patients and non-stroke patients can be
the best solution (Rowan et al 2019). The result of data
visualization can be analyzed to be the foundation for
finding out the probability of stroke. The probability
of stroke is stretched at last as the final result.
According to the contributions above. The codes
aim to analyze the relationship between the variances
and stroke and form correlation figures. By analyzing
the correlation figures based on the Random Forrest
model, the prediction can stand at last.
Prediction of the Probability of Stroke Based on the Random Forest
43
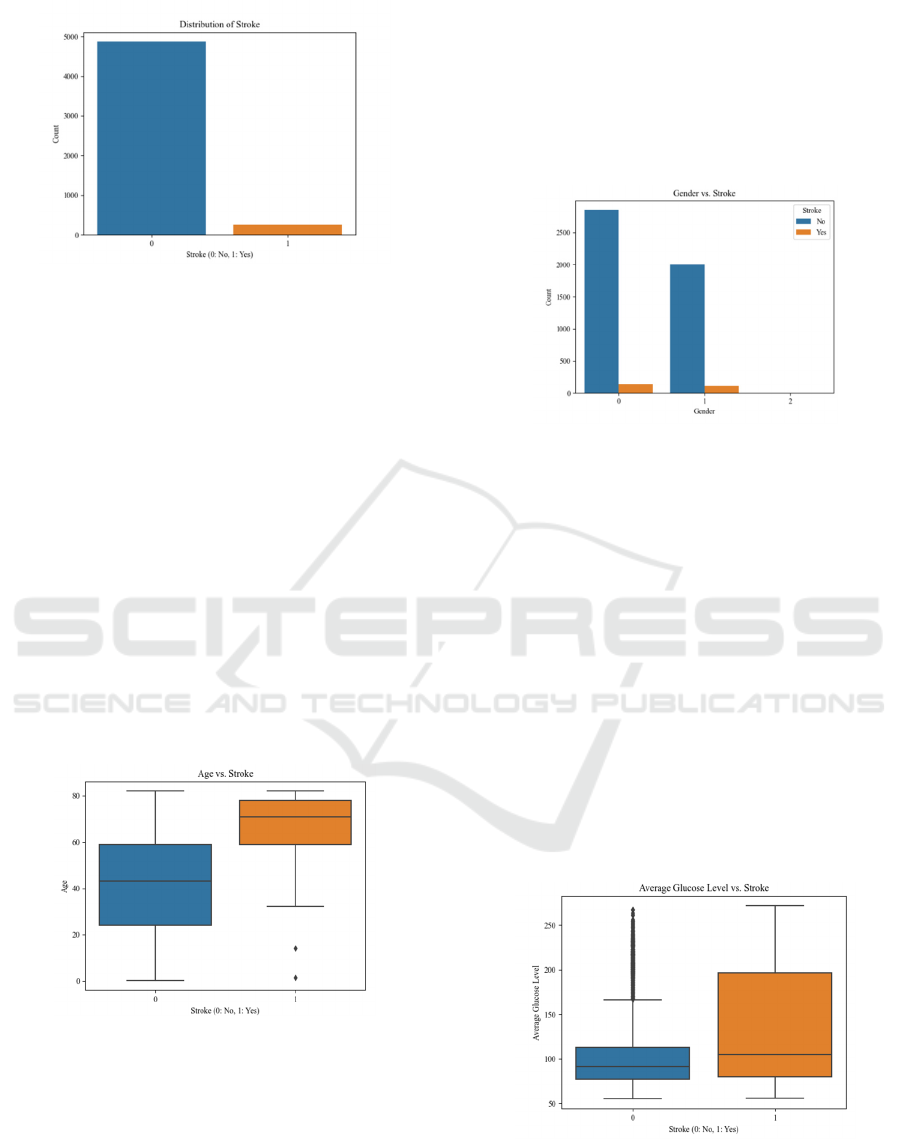
Figure 1: Bar charts about the distribution of Stroke (Figure
credit: Original).
Figure 1 shows the distribution of stroke patients
(Stroke=1) and non-stroke patients (Stroke=0) in the
dataset. The x-axis represents the stroke status (0: No
Stroke, 1: Stroke), and the y-axis represents the count
of patients falling into each category. This
visualization provides insights into the class
distribution of stroke and non-stroke cases in the
dataset. Every 50 people will have one person that it
patient stroke's sufferance while more devastating
results show there 1 in every 4 in the US will have a
stroke in their lifetime. The stroke will cause a heart
attack that kills people.
Therefore, even if you are not a stroke patient, the
people who died because of stroke still substantially
know and acknowledge more knowledge of
prevention and the common symptoms of stroke could
save millions of lives, this is the whole purpose of the
project.
Figure 2: Box plot of the relationship between age and
stroke (Figure credit: Original).
Figure 2 compares the age distribution between
stroke patients (Stroke=1) and non-stroke patients
(Stroke=0). The x-axis represents the stroke status,
and the y-axis represents the age values. The box plot
displays the median, quartiles, and outliers for each
category. This visualization helps in understanding if
age plays a significant role in stroke occurrence.
The bar chart shows a stroke is more commonly
experienced in people that exceed 60 years old. This
is a common international standard for people who an
elderly, which means the probability of getting a
stroke is proportional to the age of people. The chance
of having a stroke doubles approximately every 10
years after 60 years old. Therefore, a greater age will
cause a greater probability of getting a stroke.
Figure 3: Bar chart about the relationship between gender
and stroke (Figure credit: Original).
Figure 3 compares the gender distribution between
stroke patients (Stroke=1) and non-stroke patients
(Stroke=0). The x-axis represents the gender (e.g., 0:
Female, 1: Male), and the y-axis represents the count
of patients falling into each category. The plot shows
the count of stroke and non-stroke cases for each
gender category. This visualization helps in exploring
the relationship between gender and stroke
occurrence.
It is easy to observe that women or females have a
higher count on both stroke and non-stroke people,
which is because women used to have a longer life
span. The probability of having a stroke will increase
proportionally as the time will make them have a
longer time and higher probability to have a stroke.
Besides, having high blood pressure when women are
getting pregnant could also be a typical problem.
Figure 4: Box plot about the relationship between average
glucose level and stroke (Figure credit: Original).
Figure 4 compares the distribution of average
glucose levels between stroke patients (Stroke=1) and
DAML 2023 - International Conference on Data Analysis and Machine Learning
44
non-stroke patients (Stroke=0). The x-axis represents
the stroke status, and the y-axis represents the average
glucose level values. The box plot provides insights
into the central tendency and variability of average
glucose levels for stroke and non-stroke cases.
The fourth box plot represents the patient's glucose
level when they are getting a stroke. As it represents,
a higher glucose level will cause a higher possibility
of getting a stroke. There are 3 times probability you
will get a stroke when the glucose level in your body
is higher than 75. Excessive blood glucose can cause
increased fatty deposits in blood vessels. These clots
can be stuck or block the blood vessels in the brain or
neck, limiting the blood supply, and stopping oxygen
from getting to the brain which causes a stroke.
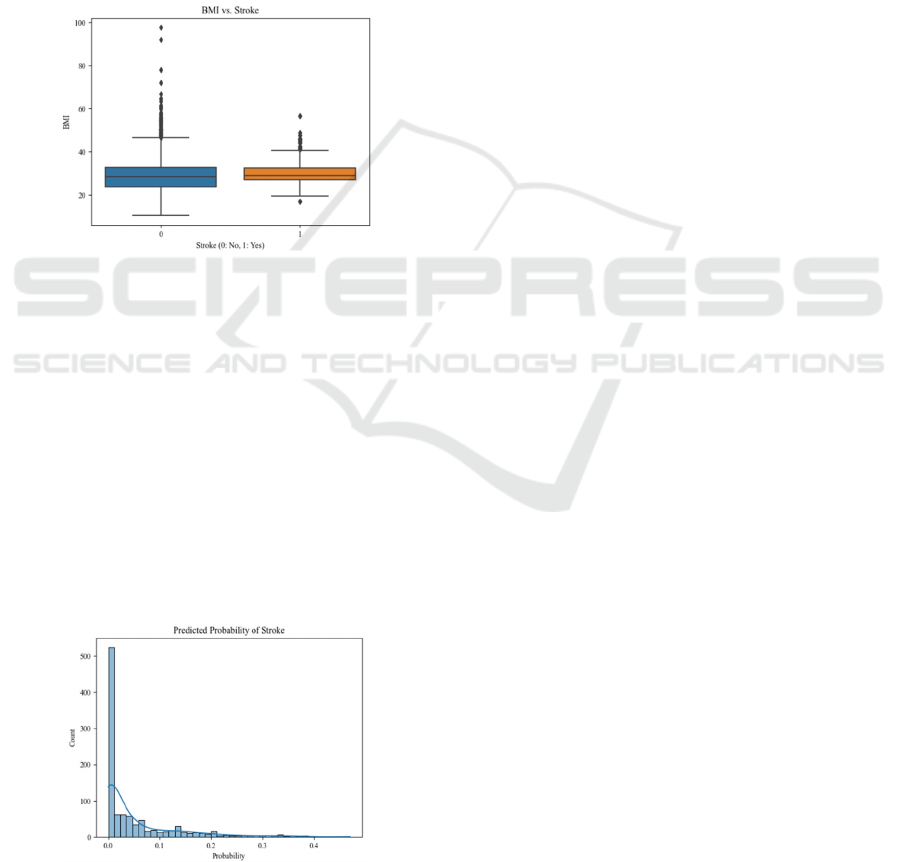
Figure 5: Box plot about the relationship between BMI and
Stroke (Figure credit: Original).
Figure 5 compares the distribution of Body Mass
Index (BMI) between stroke patients (Stroke=1) and
non-stroke patients (Stroke=0). The x-axis represents
the stroke status, and the y-axis represents the BMI
values. The box plot shows the median, quartiles, and
outliers for each category, providing insights into the
BMI distribution for stroke and non-stroke cases. The
fifth box plot is similar to the previous chart. BMI
index is derived from the proportion of height and
mass. A higher BMI means that people are more likely
to have a greater lipid, which could dependently mean
that a person has a higher glucose level. Still, this is an
extension for the fourth result.
Figure 6: Histogram of predicted probability of stroke
(Figure credit: Original).
Figure 6 shows the distribution of predicted
probabilities of stroke for the test dataset. The x-axis
represents the probability values, and the y-axis
represents the count of predictions falling into each
probability bin. The histogram helps in understanding
the model's confidence in its stroke predictions.
The last chart is a collection of many different
experiments for calculating the probability of a stroke
affecting. Due to the graph, it is easily derived that it
is skewed to the right, which means the mean is higher
than the median. Therefore, the value is more likely to
be less than 0.1 by three standard deviations, which
means there are over 99.5% of people who have the
opportunity only have a 10 percent chance of getting
a stroke in life which is a relatively high probability
for all people to be aware of.
5 CONCLUSION
According to the above, the probability of having a
stroke is about 10% for most people, which is not a
relatively low proportion. Therefore, people should
not ignore the potential hazard of this terrible disease,
and is necessary to be aware of the risk of stroke since
everyone can have it. Chronic diseases are required to
be specifically minded as most of the factors of stroke
come from it. Therefore, people should pay attention
to their daily habits and try to live a healthier life. As
long as people increase their awareness of stroke and
try to improve their living habits, they are likely to
avoid stroke and save lives which is exactly the
meaning and goal of this paper.
Although the prediction is successful, there is still
a lot to improve. This paper, only compares the
possible factors that cause a stroke, such as age,
gender, weight, BMI, and glucose level. These are the
possible causes and they show the potential hazard of
chronic diseases. However, there is a possible
improvement from another point of view since it fails
to analyze more different types of strokes to find out
possible factors that will cause any typical stroke and
how it could be prevented. To achieve this, it is
required to gather the common factors of all types of
stroke to give advanced advice to the patients or
people who have bad habits and chronic diseases and
improve awareness, which is a great approach to help
prevent stroke.
In the future, further studies are likely to focus on
one certain stroke but from different views. For
instance, research could compare the extent to which
different variables such as gender or age influence the
probability of stroke.
Prediction of the Probability of Stroke Based on the Random Forest
45

REFERENCES
L. Qiang, L. Lihui, L. Yixin. Read "the clinical guidelines
basis" introduction to stroke prevention. Journal of
clinical medicine literature electron, 2020, vol.7, no.41,
pp.190.
C. Wenlong. Study on recurrence risk factors of ischemic
stroke based on classification tree model. Changchun
University of Chinese Medicine, 2018.
L. Rui, W. Lei, D. Miao, et al. Classification, symptoms of
a stroke, clinical diagnosis and nursing cognition.
Journal of genomics and applied biology, 2021, vol.40,
no.02, pp.929-935.
V. Paray. Stroke: Act FAST, Time Is Brain. Physician
Assistant Clinics, 2023, vol.8, no.1, pp.49-66.
T. Wang, B. Sun, C. Jiang. Kernelized multi-granulation
fuzzy rough set over hybrid attribute decision system
and application to stroke risk prediction. Applied
Intelligence, 2023, vol.53, no.21, pp.24876-24894.
X. Xiaoxia, Y. Zhenning, Y. Zhen. Construction of
prediction model for 9037 patients with stroke. Chinese
journal of experimental formulas of Chinese medicine,
2022, vol.28, no.21, pp.98-103.
H. Yewen. Brain heart health management division formed
in patients with cerebral apoplexy health behavior
performance evaluation research. Neurology academic
conference proceedings in Zhejiang province in 2020,
2020, pp.2.
J. M. Leal, Galliano, L. M. Del, and F. B. Vecchio.
Effectiveness of high-intensity interval training versus
moderate-intensity continuous training in hypertensive
patients: a systematic review and meta-analysis reports,
2020, vol.22, pp.1-13.
M. Taylor-Rowan, G. Cuthbertson, R. Keir, et al. The
prevalence of frailty among acute stroke patients, and
evaluation of a method of assessment. Clinical
rehabilitation, 2019, vol.33, no.10, pp.1688-1696.
J. Y. Seo, B. Y. Choi, S. Kim, et al. The relationship
between multiple chronic diseases and depressive
symptoms among middle-aged and elderly populations:
results of a 2009 Korean community health survey of
156,747 participants. BMC Public Health, 2017, vol.17,
no.1, pp.1-10.
DAML 2023 - International Conference on Data Analysis and Machine Learning
46
