
Evaluating the Directional-Weighted Mean Absolute Error in Long
Short-Term Memory Models for Stock Price Prediction
Shuaiting Li
Center for Languages and International Education, University College London, London, United Kingdom
Keywords: Stock Price Prediction, Long Short-Term Memory (LSTM), Directional-Weighted Mean Absolute Error
(D-MAE), Loss Function.
Abstract: In the intricate landscape of financial forecasting, accurate prediction of stock prices remains a pivotal
challenge, demanding continual innovation in modeling techniques. This paper introduces the Directional-
Weighted Mean Absolute Error (D-MAE) as a potential loss function to refine the predictive capabilities of
Long Short-Term Memory (LSTM) models. Leveraging a comprehensive dataset of leading technology firms,
namely Apple Inc., Alphabet Inc., Microsoft Corporation, and Amazon.com, Inc., spanning from January 1,
2012, to September 1, 2023, the research contrasts the performance of D-MAE against conventional loss
functions. D-MAE's uniqueness stems from its ability to weigh prediction errors differentially based on the
accuracy of directional stock price movements, striving for an equilibrium between numerical prediction
precision and the discernment of price trends. Preliminary assessments, utilizing metrics such as accuracy,
precision, recall, and F1-score, offer insights into D-MAE's potential benefits in the realm of stock price
forecasting. This exploration underlines the evolving nature of financial analytics and the pressing need to
integrate innovative methodologies that can capture the nuanced dynamics of global stock markets.
1 INTRODUCTION
The world of finance has been fascinated by the
prospect of predicting stock prices, a challenging task
that carries immense significance for investors,
traders, and financial institutions (Gandhmal and
Kumar 2019). Over the years, this quest for predictive
power has seen significant advancements, thanks to
the rise of machine learning and deep learning
techniques (Chhajer et al 2022 & Ahlawat 2023). In
this paper, we embark on a journey into the realm of
stock price prediction, armed with a comprehensive
dataset encompassing the stock prices of four of the
most influential technology giants in the world: Apple
Inc (AAPL), Alphabet Inc (GOOG), Microsoft
Corporation (MSFT), and Amazon.com, Inc (AMZN).
Spanning from January 1, 2012, to September 1, 2023,
this dataset offers a rich and extensive repository of
historical stock price data.
Stock markets are dynamic ecosystems influenced
by a multitude of factors, including economic
indicators, geopolitical events, and investor sentiment
(Qiu et al 2022). The ability to anticipate market
movements and stock price fluctuations is not only a
scientific endeavor but also a critical component of
investment decision-making. As such, the intersection
of financial markets and machine learning has become
an area of immense interest and promise.
This paper delves into the multifaceted world of
stock price prediction, dissecting the techniques and
methodologies that drive modern financial
forecasting. The heart of our analysis lies in the
examination of various loss functions and their impact
on the performance of a Long Short-Term Memory
(LSTM) model—a type of recurrent neural network
renowned for its prowess in handling sequential data
(Nabipour et al 2020). Our overarching objective is
not merely to predict stock prices with precision but
also to understand and capture the directional
movements of stock prices. This understanding is
paramount, as investors often base their decisions not
solely on price levels but on whether prices are likely
to rise or fall.
To assess the efficacy of our predictive model, we
employ a range of metrics commonly used in
classification problems. These metrics include
accuracy, precision, recall, and the F1-score. By
adopting these criteria, we gain insights into not only
how well our model predicts stock price levels but also
Li, S.
Evaluating the Directional-Weighted Mean Absolute Error in Long Short-Term Memory Models for Stock Price Prediction.
DOI: 10.5220/0012814700003885
Paper published under CC license (CC BY-NC-ND 4.0)
In Proceedings of the 1st International Conference on Data Analysis and Machine Learning (DAML 2023), pages 171-177
ISBN: 978-989-758-705-4
Proceedings Copyright © 2024 by SCITEPRESS – Science and Technology Publications, Lda.
171

its ability to discern whether prices are poised to
ascend or descend.
This paper will comprehensively present the
dataset under scrutiny, elucidate the intricate steps
taken to preprocess the data, shed light on the
architecture of our LSTM model, delve into the
nuances of the diverse loss functions used, and
delineate the evaluation criteria employed to gauge the
model's performance. In the grand scheme of our
exploration, we do not merely seek to predict stock
prices; we strive to decode the essence of stock market
dynamics—a complex interplay of data, human
psychology, and economic forces.
As we traverse through this analysis, it becomes
evident that the choice of a loss function wields a
profound influence on the predictive capabilities of
our model. Each loss function, whether it is the
traditional Mean Squared Error (MSE), Mean
Absolute Error (MAE), the relative error-centric Mean
Absolute Percentage Error (MAPE), or the innovative
Differenced Mean Absolute Error (D-MAE), carries
its own set of strengths and limitations. In the ever-
shifting landscape of stock price prediction, where
both numeric accuracy and directional insights are
paramount, the selection of an appropriate loss
function emerges as a critical decision.
Furthermore, our investigation reveals that the
performance of our model varies across different
stocks, reflecting the idiosyncrasies of each company's
stock price behavior. This underscores the importance
of tailoring predictive models to suit the specific
characteristics of individual stocks—a lesson that
resonates with investors and financial analysts alike.
In the continuously evolving realm of stock price
prediction, our findings underscore the pivotal role
played by loss functions in achieving optimal results.
As technology advances and data availability
continues to expand, the potential for more accurate
and insightful stock price predictions remains on a
promising trajectory. The confluence of machine
learning and finance holds the promise of unveiling
new horizons in understanding and forecasting
financial markets—an endeavor that continues to
captivate the financial world.
2 METHOD
2.1 Dataset
The author utilizes stock price data from four
prominent technology corporations: Apple Inc.
(AAPL), Alphabet Inc. (GOOG), Microsoft
Corporation (MSFT), and Amazon.com, Inc (AMZN).
This dataset was collected from Yahoo Finance and
covers the time span from January 1, 2012, to
September 1, 2023 (Yahoo 2023). The selected dataset
comprises a total of 11,740 rows and 7 columns of
data. A few illustrative examples from this dataset are
presented in table 1.
2.2 Dataset Pre-Processing
The close price of the stock is selected as the sole input
feature and prediction target for this study. To
facilitate the modeling process, the close price data is
subjected to scaling using a Min-Max scaler, resulting
in values normalized between 0 and 1. This scaling
ensures that the data is within a consistent range for
the LSTM model (Huang 2022).
Table 1: Examples in the Dataset.
Date
Open
High
Low
Close
Adj Close
Volume
company_name
2023-08-18
131.6199951
134.0700073
131.1499939
133.2200012
133.2200012
48469400
AMAZON
2023-08-21
133.7400055
135.1900024
132.7100067
134.6799927
134.6799927
41442500
AMAZON
2023-08-22
135.0800018
135.6499939
133.7299957
134.25
134.25
32935100
AMAZON
2023-08-23
134.5
135.9499969
133.2200012
135.5200043
135.5200043
42801000
AMAZON
2023-08-24
136.3999939
136.7799988
131.8300018
131.8399963
131.8399963
43646300
AMAZON
2023-08-25
132.4700012
133.8699951
130.5800018
133.2599945
133.2599945
44147500
AMAZON
2023-08-28
133.7799988
133.9499969
131.8500061
133.1399994
133.1399994
34108400
AMAZON
2023-08-29
133.3800049
135.1399994
133.25
134.9100037
134.9100037
38646100
AMAZON
2023-08-30
134.9299927
135.6799927
133.9199982
135.0700073
135.0700073
36137000
AMAZON
2023-08-31
135.0599976
138.7899933
135
138.0099945
138.0099945
58781300
AMAZON
DAML 2023 - International Conference on Data Analysis and Machine Learning
172

The entire dataset is then divided into two distinct
segments. The initial 80% of the data is designated as
the training dataset, which serves as the foundation for
training the LSTM model. The remaining 20% of the
data is allocated as the testing dataset, which remains
untouched during training and is reserved for
evaluating the model's predictive performance.
2.3 Algorithm
In this paper, an LSTM (Long Short-Term Memory)
model is selected as a representative model to
demonstrate the impact of various loss functions on the
results of stock price predictions. LSTM network is a
recurrent neuron network. It is widely adopted in
research areas connected to sequential data (Houdt et
al 2020 & Cohen 2020). In this project, the author's
model consists of two LSTM layers with 128 and 64
units, respectively, and two Dense layers with 25 units
and 1 unit, respectively.
2.4 Loss Funtions
Mean Squared Error (MSE) is a widely used metric for
evaluating predictive models. It quantifies the average
squared difference between predicted and actual
values. MSE emphasizes larger errors due to the
squaring operation, making it useful for penalizing
significant deviations from the true values.
Mean Absolute Error (MAE) is a is a widely used
metric for evaluating predictive models. It quantifies
the average squared difference between predicted and
actual values. MSE emphasizes larger errors due to the
squaring operation, making it useful for penalizing
significant deviations from the true values.
Mean Absolute Percentage Error (MAPE) is a
percentage-based measure of error. It is suitable for
comparing the accuracy of models across different
datasets. It is capable when the scale of the data varies
as it is scale independent.
Directional-Weighted Mean Absolute Error (D-
MAE) is a percentage-based measure of error. It is
suitable for comparing the accuracy of models across
different datasets. It is capable when the scale of the
data varies as it is scale independent.
2.5 Evaluation Criteria
While stock price predictions are essentially a
regression problem, it is crucial to note that,
particularly in the short term, investors' decisions are
often influenced more by the directional movements of
stock prices than the precise price figures (Ochiai and
Nacher 2014). Therefore, the author employs a range
of evaluation criteria typically associated with
classification problems to assess the model's
performance in predicting whether stock prices will
rise or fall.
Accuracy is calculated by dividing the number of
correct predictions of stock price movements (both
rising and falling) by the total number of predictions
made. It provides a percentage representing the
proportion of accurately predicted directional
movements in stock prices, indicating the model’s
capacity to anticipate stock price trends.
Precision provides an assessment of the model's
prediction risk. It is calculated by dividing the number
of true positive predictions (correctly predicted rising
stock prices) by the total number of predicted rising
stock prices. A higher precision indicates a lower risk
of false alarms in predicting upward stock price
movements, highlighting the model's reliability in
identifying positive trends.
Recall reflects the model's ability to seize
opportunities in predicting rising stock prices. It is
calculated by dividing the number of true positive
predictions (correctly predicted rising stock prices) by
the total number of actual rising stock prices. A higher
recall indicates the model's effectiveness in capturing
genuine upward stock price movements and
maximizing the potential for identifying positive
trends.
The F1-score is a comprehensive metric that
balances the precision and recall of the model's
predictions. It is calculated by taking the harmonic
mean of precision and recall. The F1-score provides a
single value that combines the model's ability to
accurately identify positive trends (precision) and its
capacity to seize opportunities (recall). A higher F1-
score signifies a well-balanced performance in
predicting rising stock prices while minimizing the risk
of false alarms.
Evaluating the Directional-Weighted Mean Absolute Error in Long Short-Term Memory Models for Stock Price Prediction
173
3 RESULT
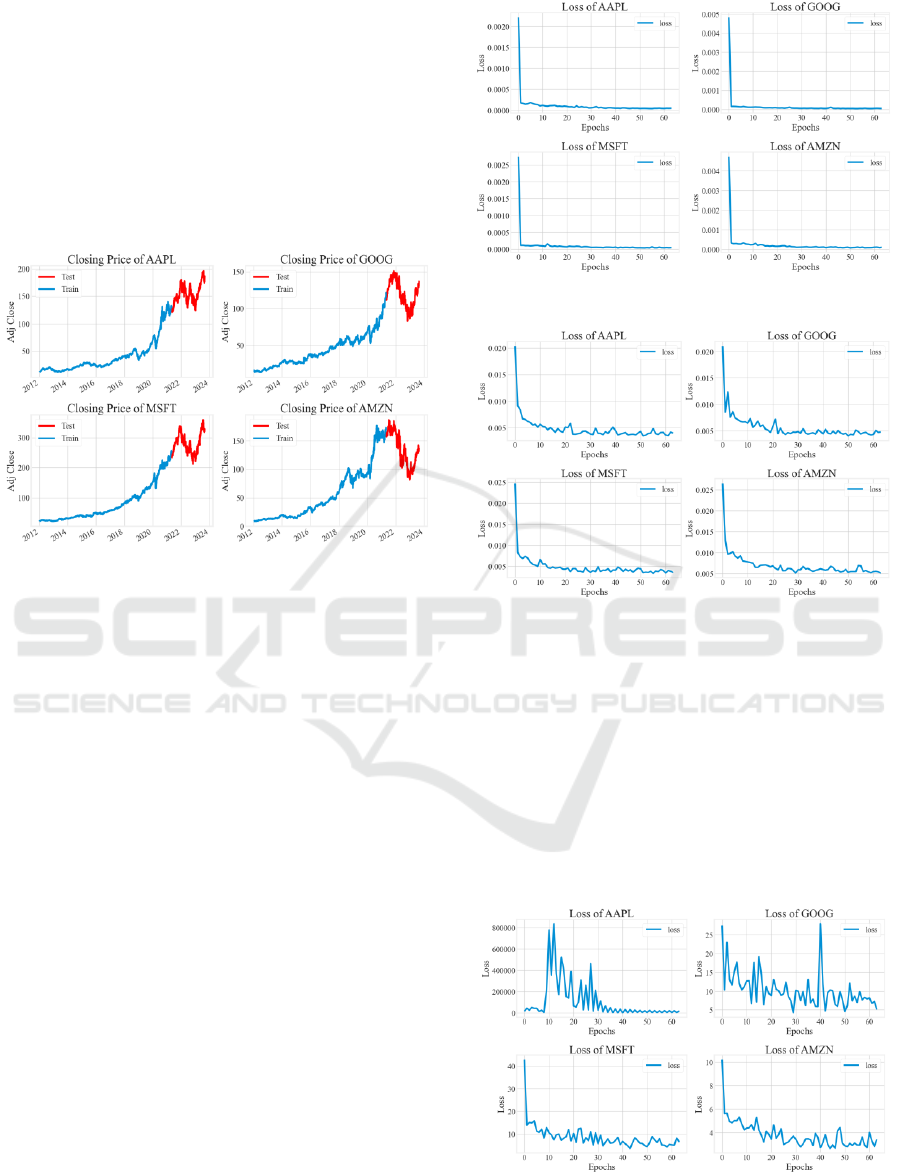
3.1 Pre-Processed Data
The dataset is split into a training set and a test set with
a ratio of 4:1. For all four companies, the closing price
rose gradually before reaching a peak by the end of the
year 2021, after which strong fluctuation can be
observed. Fig. 1 provides a brief insight into the dataset
division.
Figure 1: Sub datasets for training and testing (Credit:
Original).
Then the author employed a Min-Max scaler to
normalize all the training data to between 0 and 1,
which is the consistent range for LSTM model. After
applying the scaler, data preserves most of their
features.
3.2 The Training Process of the Models
The LSTM model is trained for 64 epochs on the batch
size of 32. The model’s performance varies
significantly with different loss function. In most
cases the model converges after 64 epochs.
With MSE as loss function and ADAM as
optimizer, the model fitted well on the train data. On
datasets of all four stocks, the model shows sign of
convergence within 30 epochs. The figure for loss
dropped rapidly in the initial few epochs, after which
the loss figure remained stable. The training history
with MSE is illustrated in Fig. 2.
Compared to MSE, when using MAE as loss
function, the model converges slower in a few initial
epochs, and the fluctuation in the loss figure is more
noticeable. In all four cased, the model shows signs of
convergence within 40 epochs. The training history
with MAE is illustrated in Fig. 3.
Figure 2: Fitting process with MSE (Credit: Original).
Figure 3: Fitting process with MAE (Credit: Original).
In the fitting process with MAPE as loss function,
stronger fluctuation in the figure for loss can be clearly
observed. On datasets consisting of stock price of
Apple Inc, Microsoft and Amazon, the model
eventually shows sign of convergence while on the
data of Google, the fluctuation is so strong that no clear
sign of convergence can be observed. It is also
noteworthy that although the model converges on the
data of Apple Inc, the loss is too high after convergence
for the predictions to be plausible. The training history
with MAPE can be found in Fig. 4.
Figure 4: Fitting process with MAPE (Credit: Original).
DAML 2023 - International Conference on Data Analysis and Machine Learning
174
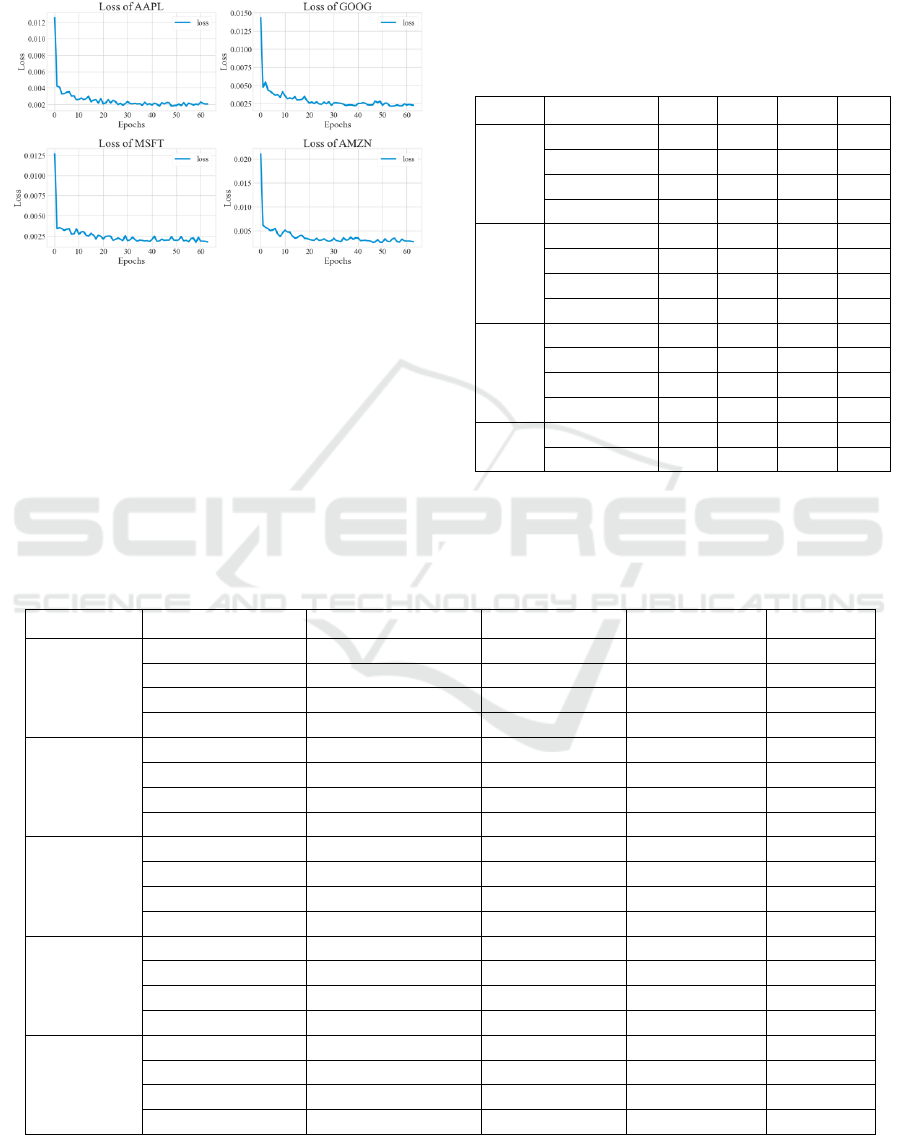
The fitting process with D-MAE follows similar
pattern to that with MAE. The model shows signs of
convergence within 40 epochs. The training history
with D-MAE can be found in Fig. 5.
Figure 5: Fitting process with D-MAE (Credit: Original).
3.3 Performance Evaluation
The author defines the directional movement of stock
prices as follows. If the stock price on day i is higher
than or equal to that on day i+1, then the movement of
day i is downward, and is a negative event. Otherwise,
the trend is upward and it is a positive event. If a
prediction matches the actual directional movement,
the event is defined as true. If predicted and actual
trend don’t match, the event is defined as false.
Then the author calculated the number of four kind
of events, TN (true negative), TP (true positive), FN
(false negative) and FP (false positive), on four
different stocks using four different loss functions
respectively. A brief insight of the data can be found
in table 2.
Table 2: Number of Four Events.
Stock
Loss function
TN
TP
FN
FP
AAPL
MSE
212
243
67
64
MAE
152
268
126
40
MAPE
0
284
302
0
D-MAE
94
292
186
14
GOOG
MSE
197
251
85
53
MAE
141
268
148
29
MAPE
132
263
154
37
D-MAE
219
207
69
91
MSFT
MSE
275
139
21
151
MAE
226
213
68
79
MAPE
98
279
191
18
D-MAE
282
86
6
212
AMZN
MSE
94
292
186
14
MAE
219
207
69
91
The author calculates the accuracy, precision, recall
and F1-score in each case according to those criteria
stated before. Specific data is shown in table 3.
Table 3: Specific Data for Four Functions.
Stock
Loss function
Accuracy
Precision
Recall
F1-score
AAPL
MSE
0.776451
0.791531
0.783871
0.787682
MAE
0.716724
0.87013
0.680203
0.763533
MAPE
0.484642
1
0.484642
0.652874
D-MAE
0.658703
0.954248
0.610879
0.744898
GOOG
MSE
0.764505
0.825658
0.747024
0.784375
MAE
0.697952
0.902357
0.644231
0.751753
MAPE
0.674061
0.876667
0.630695
0.733612
D-MAE
0.726962
0.694631
0.75
0.721254
MSFT
MSE
0.706485
0.47931
0.86875
0.617778
MAE
0.749147
0.729452
0.758007
0.743455
MAPE
0.643345
0.939394
0.593617
0.72751
D-MAE
0.627986
0.288591
0.934783
0.441026
AMZN
MSE
0.658703
0.954248
0.610879
0.744898
MAE
0.726962
0.694631
0.75
0.721254
MAPE
0.742321
0.833898
0.706897
0.765163
D-MAE
0.757679
0.802817
0.726115
0.762542
Average
MSE
0.740188
0.74844
0.763661
0.736765
MAE
0.72792
0.817053
0.718622
0.759422
MAPE
0.607509
0.776163
0.660934
0.638755
D-MAE
0.721416
0.821399
0.698472
0.748464
Evaluating the Directional-Weighted Mean Absolute Error in Long Short-Term Memory Models for Stock Price Prediction
175

4 DISCUSSION
The results elucidate the capabilities of the LSTM
model in forecasting stock prices, specifically
emphasizing the pivotal role of the loss function in
shaping predictive outcomes. Our evaluation, covering
accuracy, precision, recall, and F1-score, offers a
panoramic view of the model's prowess in discerning
the directional tendencies of stock prices.
4.1 Evaluation of Loss Functions
The study's chosen gamut of loss functions—Mean
Squared Error (MSE), Mean Absolute Error (MAE),
Mean Absolute Percentage Error (MAPE), and
Differenced Mean Absolute Error (D-MAE)—reveal
diverse impacts on the model's forecasting acumen:
MSE and MAE: Revered as classical loss
functions, both MSE and MAE underscore numerical
prediction accuracy concerning stock price values.
However, their potential to accurately map directional
nuances remains under question.
MAPE: Emphasizing relative error, MAPE
appears less adept for tasks demanding high precision,
such as stock prediction, primarily due to its
susceptibility to extreme values.
D-MAE: Emerging as a potential frontrunner, D-
MAE is custom-tailored to enhance traditional MAE by
factoring in the intricacies of stock price directionality,
thus demonstrating a commendable balance between
numerical accuracy and trend discernment.
4.2 Distinct Stock Performances
A closer observation of individual stocks—AAPL,
GOOG, MSFT, and AMZN—unveils distinct
predictive patterns. These patterns are likely driven by
the inherent market behaviors unique to each
company, emphasizing the need for tailored models or
strategies when predicting for specific stocks.
4.3 Comparative Analysis and Insights
The juxtaposition of different loss functions brings to
light the criticality of this choice in achieving superior
predictive results. While traditional loss functions like
MSE and MAE depict a decent performance,
specialized ones like D-MAE manifest an edge in
balancing prediction accuracy with trend identification.
4.4 Future Directions
Navigating the intricate maze of stock price
predictions necessitates an in-depth understanding of
various loss functions and their implications. As we
stride forward, research endeavors should pivot
towards exploring avant-garde loss functions and
refining model architectures, keeping pace with the
ever-evolving financial market landscape.
5 CONCLUSION
The endeavor to predict stock price movements is a
challenging and multifaceted process, given the
intricacies of global financial markets. By utilizing an
LSTM model and exploring the effects of different loss
functions on its predictive performance, this study has
shed light on the importance of selecting an
appropriate loss function. While traditional loss
functions like MSE and MAE provide reasonable
results, specialized loss functions such as D-MAE
emerge as better-suited for capturing the nuances of
stock price directionality. As financial markets
continually evolve, research in this realm should
remain iterative and adaptive, continually optimizing
algorithms and methodologies to improve prediction
accuracy and inform strategic investment decisions.
REFERENCES
D. P. Gandhmal and K. Kumar, “Systematic analysis and
review of stock market prediction techniques,”
Computer Science Review, vol. 34, p. 100190, 2019.
P. Chhajer, M. Shah, and A. Kshirsagar, "The applications
of artificial neural networks, support vector machines,
and long–short term memory for stock market
prediction," Decision Analytics Journal, vol. 2, p.
100015, 2022.
S. Ahlawat, Reinforcement Learning for Finance: Solve
Problems in Finance with CNN and RNN Using the
TensorFlow Library. Berkeley, CA: Apress L. P., 2023.
Y. Qiu, Y. Ren, and T. Xie, "Global factors and stock market
integration," International Review of Economics &
Finance, vol. 80, pp. 526–551, 2022.
M. Nabipour et al., "Deep learning for stock market
prediction," Entropy, vol. 22, no. 8, p. 840, 2020.
Yahoo Finance, "Download historical data in Yahoo
Finance," 2023. [online].
Available:https://help.yahoo.com/kb/SLN2311.html.
[Accessed : 07-Nov-2023]
L. Huang, Normalization Techniques in Deep Learning.
CA: Springer International Publishing, 2022.
G. V. Houdt, C. Mosquera and G. Napoles, “A review on
the long short-term memory model”, Artif Intell Rev 53,
pp. 5929-5955, 2020.
DAML 2023 - International Conference on Data Analysis and Machine Learning
176

S. Cohen, "Overview of advanced neural network
architectures," in Artificial Intelligence and Deep
Learning in Pathology. Elsevier, 2020, pp. 41–56.
T. Ochiai and J. C. Nacher, "Volatility-constrained
correlation identifies the directionality of the influence
between Japan’s Nikkei 225 and other financial
markets," Physica A, vol. 393, pp. 364–375, 2014.
Evaluating the Directional-Weighted Mean Absolute Error in Long Short-Term Memory Models for Stock Price Prediction
177
