
Prediction of Heart Attack on Random Forest and Logistic Regression
Xinyi Huang
Applied Statistics, Northeastern University at Qinhuangdao, Qinhuangdao, China
Keywords: Heart Attack Prediction, Random Forest, Logistic Regression.
Abstract: The heart is one of the most important organs. There are various kinds of heart diseases, with coronary artery
disease (CAD) being the most prevalent ones. CAD refers to a group of diseases caused by the damage to the
coronary arteries that supply oxygen and blood, resulting in ischemia, hypoxia or necrosis. About 2% of the
world's population suffers from CAD, which causes 17.5 million deaths worldwide every year. Therefore,
monitoring and prevention of heart disease is essential. The study uses two different algorithms, Random
Forest Classifier and Logistic Regression to establish models, with respective accuracies of 0.9798 and 0.8965.
RF is found to be more effective than LR in this small classification problem. Future research should focus
on integrating larger, more diverse datasets and introducing other advanced machine learning algorithms in
conjunction with the RF algorithm to explore hidden patterns in the data. These models can help predict the
risk of heart disease.
1 INTRODUCTION
Trans fats have been added to a wide variety of foods.
However, trans fats will increase Low-Density
Lipoprotein cholesterol, which is a compound that
clogs arteries and contributes to heart attacks
(Ganguly and Pierce 2015). According to newly
released data from the World Health Organization,
due to COVID-19, individuals with pre-existing heart
disease have a higher risk of suffering from severe
illness or death. Therefore, predicting heart disease is
important for both individuals and society. The
traditional methods of detecting heart disease are
expensive and time-consuming. Owing to the
application of machine learning in the medical field,
machine learning algorithms can autonomously learn
and extract valuable information and patterns from
historical data, enabling automated decision-making
and prediction (Litjens et al 2017).
It has been discovered that some factors
contributing to a heart attack can be detected through
daily measurements and blood checks. Therefore, this
paper uses machine learning to effectively predict
heart attacks. The selection of suitable machine
learning algorithms based on the dataset
characteristics is crucial for achieving accurate results.
Harshit Jindal employed the K-nearest neighbors
(KNN) algorithm as the primary model to improve the
accuracy of the model based on a collected dataset of
medical attributes. Additionally, Ashir Javeed
developed a novel approach called Random Search
Algorithm - Random Force (RSA-RF) model, which
effectively discovers the optimal subset of features
and reduces the feature dimensionality, thus reducing
the time complexity.
Machine learning techniques are widely used in
predicting heart diseases, with methods such as
Support Vector Machines (SVM) (Raju et al 2018),
Random Forest Classifier (RF) and Logistic
Regression (LR) receiving significant attention.
RF is an ensemble learning method known for its
high accuracy and robustness. The construction of a
RF involves two stages: training and prediction.
During the training stage, multiple decision trees are
trained by randomly sampling data instances and
selecting subsets of features (Speiser et al 2019). Each
decision tree is generated based on different subsets of
data and features. In the prediction stage, input
samples are classified through each decision tree, and
the final classification result is determined by voting
or averaging the outcomes (Breiman 1984). However,
the predictive performance of RF may sometimes fall
short of expectations. To achieve optimal
performance, the number of trees can be adjusted
using cross-validation techniques.
LR is a common binary classification algorithm
used to predict the probability of an event occurring. It
transforms the input variables through a sigmoid
function into output variables, mapping continuous
real values to probability values between 0 and 1,
466
Huang, X.
Prediction of Heart Attack on Random Forest and Logistic Regression.
DOI: 10.5220/0012816000003885
Paper published under CC license (CC BY-NC-ND 4.0)
In Proceedings of the 1st International Conference on Data Analysis and Machine Learning (DAML 2023), pages 466-470
ISBN: 978-989-758-705-4
Proceedings Copyright © 2024 by SCITEPRESS – Science and Technology Publications, Lda.
referring to the likelihood of a sample being classified
under a specific category (Hilbe 2009). To minimize
the error, the approach of maximum likelihood
estimation is utilized in parameter estimation. LR is
commonly used in classification problems such as
spam filtering, web page text classification (Gangurde
and Kumar 2020), etc. Performance can be improved
by using regularization to limit the size of model
parameters, adding interaction terms, and other
techniques.
In this paper, the author uses RF and LR to
construct models and evaluates them to compare their
characteristics, ultimately determining which model
performed better.
2 METHOD
2.1 Dataset
The dataset is called the Heart Attack dataset. It
contains 1320 sample data,and each sample has 9
characterization dimensions. It is a binary
classification problem with response variables that
are diseased or not diseased, then the remaining 8
characterization dimensions as parameters. In this
study, binary labels were used: a label value of 0
signifies the absence of a heart attack, whereas a label
value of 1 signifies the presence of a heart attack.
Here's a sample presentation of the datasets.
2.2 Dataset Visualization
A partial display of samples from the dataset is shown
in Table 1.
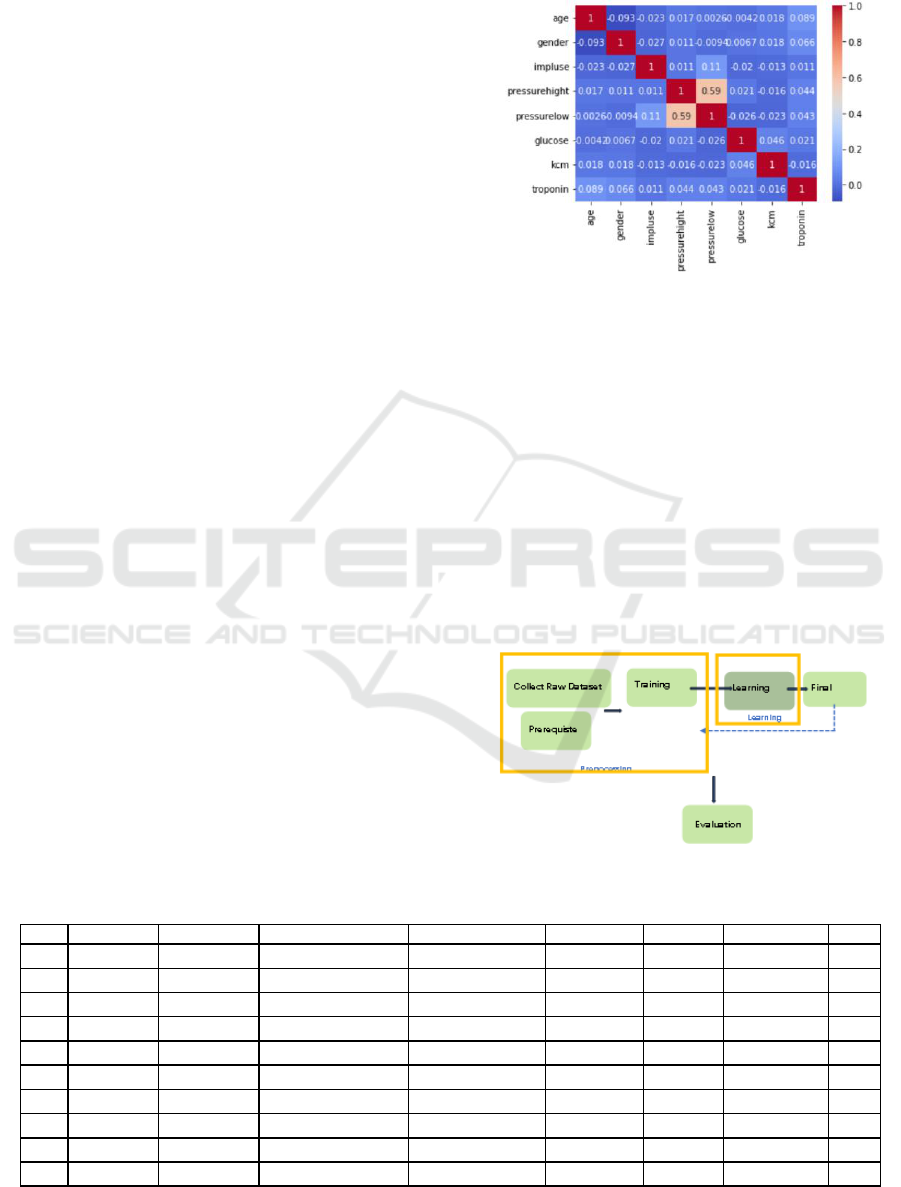
The seaborn heatmap function was used to
generate a correlation heatmap of the independent
variables. Figure 1 displays the correlation strength
between different features, where darker color
indicates stronger correlation. There is almost no
multicollinearity problem between the variable pairs,
as the correlation between them is very low (n < 0.1).
Figure 1: Thermodynamic diagram of correlation
(Original).
2.3 Prerequisite
The proposed methodology consists of multiple steps,
which is depicted in Figure 2, starting with data
collection, extraction of significant values, and a
preprocessing phase for exploring the data. Data
preprocessing involves dealing with missing values
and cleaning and normalizing the data according to the
algorithm. After data preprocessing, the preprocessed
data is classified using classifiers. Finally, this
proposed model is evaluated to assess the performance
and accuracy using various evaluation metrics.
Figure 2: Algorithm Flowchart (Original).
Table 1: Examples in the Dataset.
age
gender
impluse
pressurehight
pressurelow
glucose
kcm
troponin
class
64
1
66
160
83
160
1.8
0.012
0
63
0
60
150
83
198
2.39
0.013
0
50
0
93
120
71
120
0.609
0.013
0
60
1
86
135
65
187
35.55
0.006
1
78
1
77
116
64
104
2.24
0.021
1
70
0
91
147
65
86
1.54
0.02
1
78
0
61
136
70
111
1.09
0.082
1
43
0
64
160
77
191
1.15
0.011
0
54
0
60
104
60
50
8.14
0.006
1
48
1
84
118
68
96
5.33
0.006
0
Prediction of Heart Attack on Random Forest and Logistic Regression
467

2.4 Algorithm
2.4.1 Random Forest Classifier
Feature Selection: Using the Bootstrap Sampling
method, data subsets are randomly selected with
replacements from the original dataset, and a decision
tree is constructed for each subset.
Suppose n represents tthe quantity of samples
present D. During the process of bootstrap sampling,
a random sample is selected from the population D
and placed into the sampling set Ds, and then put it
back into D. After n iterations, the sampling set Ds
contains n samples, and it is possible to have duplicate
samples. The probability that a sample from D is not
selected at all during the entire process can be
calculated as follows:
(1)
Through Bootstrap Sampling, approximately
36.8% of the samples in the initial dataset D do not
appear in Ds.
In this study, RF was used to construct 100
decision trees, and the ultimate classification outcome
is determined through the majority vote or average
value of all the trees. By increasing the number of
decision trees, the model's accuracy, robustness, and
generalization ability can be improved. RF effectively
reduces the risk of overfitting and exhibits good
performance in solving classification and regression
problems.
2.4.2 Logistic Regression
It is crucial to find the best parameter combination
within an acceptable time frame to improve model
performance and reduce overfitting risk. In this study,
cross-validation and grid search are employed to
explore the parameter space and identify the optimal
parameter combination. Consequently, a
regularization coefficient of 10.0, a penalty parameter
of l1 to prevent overfitting, and liblinear as the
optimization algorithm are determined as the best
parameter values. Therefore, the object function has
changed as follow:
J(θ) = — 1/m * Σ[y(i) * log(h
θ
(x(i)))+ (1 — y(i)) log(1
—hθ(x(i)))]+ λ/(2m) Σθ² (2)
m represents the count of training samples, while y
denotes the actual label of each sample. h
θ
(x) is the
prediction function, calculated as 1 / (1 + exp (-θ
T
* x)),
θ is the parameter of the model, x(i) is the feature
vector of the i-th sample, and λ is the regularization
parameter.
2.5 Evaluation Criteria
2.5.1 Confusion Matrix
It is a tabular form used to assessing the effectiveness
of classification models' performance, which indicates
the relation between the predictions of a classification
model on a test set and the actual labels.
It consists of the following four metrics: True
Positive (TP), True Negative (TN), False Positive (FP),
False Negative (FN).
2.5.2 Accuracy
This article refers to the proportion of the total sample
set that accurately predicts whether a subject has heart
disease.
Accuracy = (TP + TN) / (TP + TN + FP + FN) (3)
2.5.3 Precision
In this context, precision refers to the percentage of
actual heart disease patients among all the cases
predicted as having heart disease.
Precision = (TP) / (TP + FP) (4)
2.5.4 Recall
A higher recall rate implies that the model can
accurately identify individuals with heart disease.
Recall = (TP) / (TP + FN) (5)
2.5.5 F1-score
An elevated F1-score suggests that the model has
attained an enhanced equilibrium and overall
effectiveness in precisely detecting individuals
afflicted with cardiovascular conditions.
F1-score = (2 * (Precision * Recall)) / (Precision +
Recall) (6)
2.5.6 ROC Curve and AUC Value
They are commonly used metrics for binary
classification model evaluation. When the ROC curve
approaches the upper left corner, the performance of
the classifier is better. The larger the AUC value
indicates higher discrimination between positive and
negative instances.
DAML 2023 - International Conference on Data Analysis and Machine Learning
468
3 RESULT
3.1 Predict Result
Table 2: Predict results of RF.
F1 Score
Precision
Recall
Accuracy
1
0.9835
0.9794
0.9875
0.9798
0
0.9740
0.9804
0.9677
Table 3: Predict results of LR.
F1 Score
Precision
Recall
Accuracy
1
0.9126
0.9386
0.8880
0.8965
0
0.8731
0.8393
0.9097
From Table 2 and Table 3, the results of the RF model
are better than those of LR in all aspects except for
Recall. Accuracy is more important, and the Accuracy
of RF is significantly higher than that of LR.
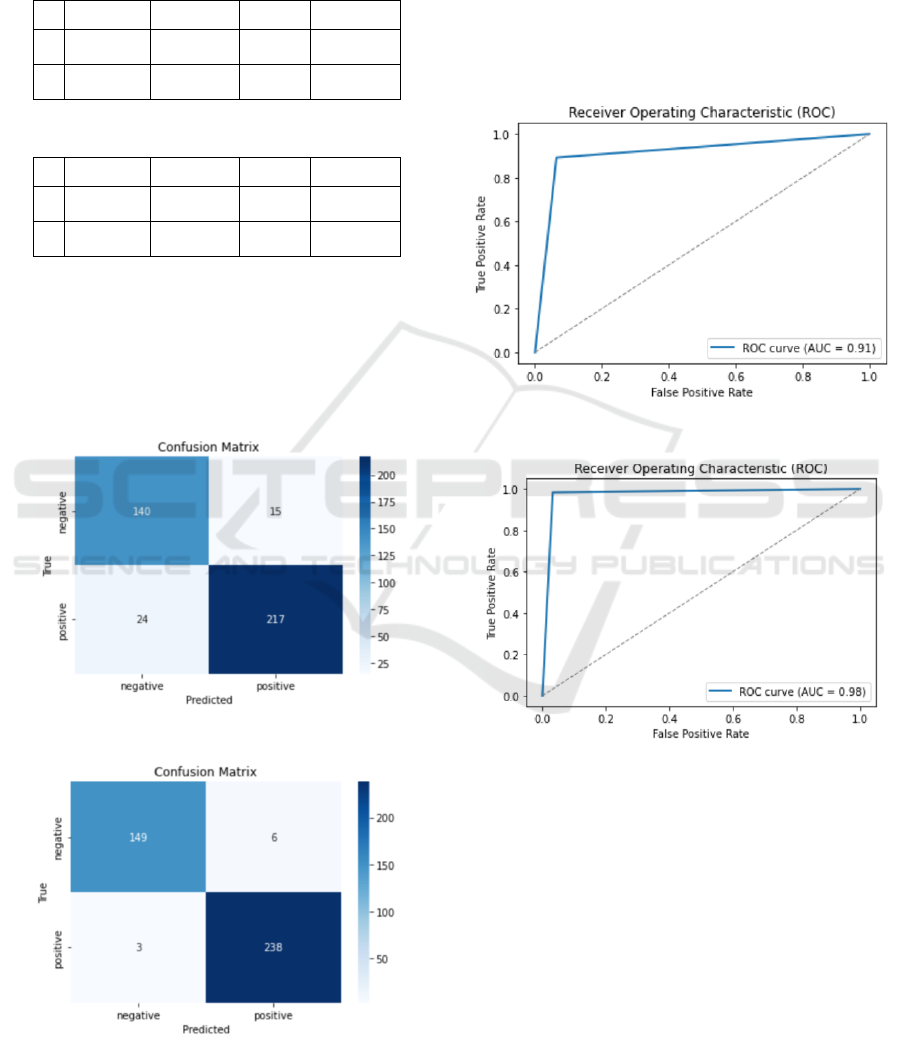
3.2 Evaluation
Figure 3: Confusion Matrix of LR (Original).
Figure 4: Confusion Matrix of RF (Original).
From Figure 3 and Figure 4, both models show high
accuracy, precision, and recall in predicting heart
disease in patients, demonstrating good performance.
The author particularly focuses on False Negative,
which represents cases where the model fails to detect
the presence of heart disease in individuals. Such errors
can lead to delays in diagnosis and treatment, resulting
in serious consequences for patients. However,
according to the results, the probability of this type of
error of RF is lower than the probability LR.
Figure 5: ROC curve of RF (Original).
Figure 6: Roc curve of LR (Original)
From Figure 5 and Figure 6, both models exhibit
excellent performance with ROC curves that approach
the upper left corner and have high AUC values.
However, when comparing the two, RF performs
better.
4 DISCUSSION
The results all indicate that the RF model outperforms
LR overall. The accuracy rate of 97.8% clearly
demonstrates the excellence of the model. Moreover,
concerning the ROC curve and AUC value, it is
Prediction of Heart Attack on Random Forest and Logistic Regression
469

noticeable that the ROC curve of the RF model
approaches the top-left corner, exhibiting the
superiority of the model's performance. The AUC
value of 0.98, which is closer to 1, further consolidates
the success of the RF model. These findings suggest
that the RF model could be an optimal solution for
heart attack prediction.
5 CONCLUSION
A heart disease prediction model has successfully been
constructed by adopting two different techniques.
After comparison, the RF model is more suitable and
effective in predicting such small-scale classification
problems.
Early prediction and intervention are crucial for the
health of patients as heart disease is a common and
serious illness. In order to better help more people
predict their risk of heart disease, this research can
provide new ideas and methods for heart disease
prevention.
To improve the accuracy and reliability of the
model's predictions, future research must focus on
incorporating larger-scale and more diverse datasets.
By collecting heart disease-related data with various
attributes and features, models can gain a more
comprehensive understanding.
Additionally, further research considers
introducing other advanced machine learning
algorithms to explore more patterns and features
hidden in the data. In this way, it enhances the
performance and stability of the prediction model.
In conclusion, by expanding the scale of the dataset
and employing advanced techniques, further
improvement of the heart disease prediction model can
lead to positive contributions in preventing heart
disease.
REFERENCES
R. Ganguly, and G. N. Pierce, “The toxicity of dietary trans
fats,” Food and Chemical Toxicology, vol. 78, pp. 170–
176, April 2015.
G. Litjens, T. Kooi, B. E. Bejnordi, et al., “A Survey on
Deep Learning in Medical Image Analysis,” Medical
Image Analysis, vol. 42, pp. 60–88, December 2017.
H. Jindal, S. Agrawal, R. Khera, et al., “Heart disease
prediction using machine learning algorithms,” IOP
Conference Series: Materials Science and Engineering,
vol. 1022, pp. 012072, 2021.
A. Javeed, S. J. Zhou, Y. J. Liao, et al., “An Intelligent
Learning System based on Random Search Algorithm
and Optimized Random Forest Model for Improved
Heart Disease Detection,” IEEE Access, vol. 7, pp.
180235-180243, November 2019.
C. Raju, E. Philipsy, S. Chacko, et al., “A Survey on
Predicting Heart Disease using Data Mining
Techniques,” ICEDSS, March 2018.
J. L. Speiser, M. E. Miller, J. Tooze, and E. Ip, “A
comparison of random forest variable selection methods
for classification prediction modeling,” Expert Systems
with Applications, vol. 134, pp. 93–101, November
2019.
L. Breiman, Classification and regression trees, 1st ed., New
York: Routledge, 1984, pp 4-8.
J. M. Hilbe, Logistic regression models, London: Crc Press,
2009, pp 243-250.
A. Wijaya, and A. Bisri, “Hybrid decision tree and logistic
regression classifier for email spam detection,” ICITEE,
October 2016.
R. Gangurde, and B. Kumar, “Web Page Prediction Using
Genetic Algorithm and Logistic Regression based on
Weblog and Web Content Features,” ICESC, August
2020.
DAML 2023 - International Conference on Data Analysis and Machine Learning
470
