
Stock Prediction Based on Principal Component Analysis Principal
Component Analysis and Long Term Short Term Memory
Wenxuan Liu
Baskin Engineering, University of California Santa Cruz, Santa Cruz, U.S.A.
Keywords: LSTM, Machine Learning, PCA, Data Prediction, Data Preprocessing.
Abstract: Nowadays, machine learning mode in financial markets has become popular. This experiment studied the
potential benefits of integrating Principal Component Analysis (PCA) with Long Short-Term Memory
(LSTM) neural networks for the prediction of stock prices. The data used in the experiment are collected from
Yahoo Finance, a reputable platform for collecting stock prices. Traditional methods for stock price prediction
by using LSTMs mostly just rely on the raw historical stock data. Raw data are high-dimensional and may
contain redundant information. The redundancy could reduce the model's predictive ability. The hypothesis
claims that the application of PCA can refine the data and enhance the predictive performance of LSTMs. To
prove the hypothesis, I employed three steps: Initially, I applied PCA on the historical stock data to pre-
process the principal components. In addition, use these components as inputs for the LSTM model. Lastly,
compare the performance of the PCA-integrated LSTM model with a traditional LSTM model that uses
unprocessed data. In the result, compared with the original stock data, the prediction accuracy of the LSTM
model trained using PCA-converted data has been significantly improved. The result not only can prove the
hypothesis but also underscores the advantages of combining dimensionality reduction techniques with the
LSTM method.
1 INTRODUCTION
1.1 Background
Financial markets have always been a research area
worthy of attention. Financial markets attract the
interest of academics, investors, and financial
analysts because of their potentially lucrative returns
and their significant impact on the global economy.
With the evolution of markets and the increased
complexity of financial instruments, the sheer volume
of data which is available for analysis has grown
exponentially.
1.2 Related Research
Dimensionality reduction techniques have been
applied in various fields to manage high-dimensional
data, among which PCA is a commonly used data-
processed method. PCA is a statistical technique that
can help to decrease data’s dimensionality. Due to the
help of employing an orthogonal transformation, the
original random vector can be transformed by PCA
(Gao et al 2021). Using PCA to preprocess data can
avoid clutter and allow the module to obtain results
with less data.
LSTM replaces the neurons in the hidden layer
of traditional neural networks with memory cells and
computing units. This LSTM can efficiently utilize
historical information in time series to achieve
reliable dynamic predictions (Liu 2021). Moreover,
LSTM can forget unnecessary information or store
information for a longer period with the support of
memory units (Srijiranon 2022). It has a forget gate,
an output gate, and an input gate. The Forget-Gate
helps judge whether the data from the previous unit
needs to be fed to the current unit or not, Also, it can
judge which data plays a role in information filtering
and control (Liu and Sun 2020). “The LSTM neural
network needs to determine which input information
needs to be forgotten and which does not need to be
forgotten through the 𝜎 function. The value range of
the σ layer output value is [0,1]. The closer to zero,
the more of the information is forgotten. Similarly,
closer to one, less information is forgotten. When
equal to 1, all information can be retained, and when
equal to 0, all information can be retained. The
information is discarded” (Gu and Wang 2022).
𝑓
= 𝜎(𝑤
×
ℎ
, 𝑥
+ 𝑏
(1)
392
Liu, W.
Stock Prediction Based on Principal Component Analysis Principal Component Analysis and Long Term Short Term Memory.
DOI: 10.5220/0012816500003885
Paper published under CC license (CC BY-NC-ND 4.0)
In Proceedings of the 1st International Conference on Data Analysis and Machine Learning (DAML 2023), pages 392-396
ISBN: 978-989-758-705-4
Proceedings Copyright © 2024 by SCITEPRESS – Science and Technology Publications, Lda.

1.3 Objective
The primary objective of this study is to prove the
hypothesis that ‘using PCA to preprocess historical
stock data can improve the predictive performance of
LSTM neural networks. The goal is to find out
whether dimensionality reduction through PCA, can
effectively distill the data and provide more efficient
input to LSTM. By comparing the performance of
LSTM models trained on raw data versus PCA-
processed data, the hypothesis has been proved.
2 HYPOTHESIS
Compared to using raw stock data as inputs, using
PCA to reduce historical stock data’s dimensionality
will improve the predictive accuracy of LSTM neural
networks.
3 METHOD
3.1 Data Collection
This part is to get a dataset that collects the historical
stock prices and relevant metrics by using Python.
This part will extract historical stock data from Yahoo
Finance and Google Finance. Ensure that the data
includes opening prices, closing prices, and high, and
low, volume metrics. By providing different
indicators of stock behavior, the model has a broader
context and avoids overfitting. In addition,
incorporating multiple perspectives will allow
models to consider more details.
The following table 1 collects the stock opening
price, highest price, lowest price, closing price and
volume metrics of "Gold Dec23" from August 28th to
September 10th.
Table 1: Collected Stock Price Data.
Date Open High Low Close Volume
8.1 1948.4 1953.6 1933.2 1937.4 652
8.2 1934.2 1936.5 1928.00 1932.00 773
8/3 1934.9 1945.0 1920 1939.6 290
8/6 1941.0 1941.0 1929.8 1933.5 376
8/7 1931.7 1933.2 1923.0 1924.1 555
8/8 1925.4 1928.8 1913.7 1915.4 451
8/9 1921.1 1927.8 1911.4 1914.4 178
8/10 1913.0 1916.6 1911.8 1912.9 57
8/13 1909.3 1912.6 1903.3 1910.6 46
8/14 1906.0 1907.7 1895.0 1902.5 73
8/15 1904.5 1904.5 1890.3 1896.1 22
8/16 1893.7 1902.4 1884.0 1884.1 245
8/17 1891.8 1891.8 1886.1 1886.1 19
8/20 1893.6 1893.6 1893.3 1893.3 876
8/21 1894.6 1896.8 1892.8 1896.4 46
8/22 1909.6 1918.5 1909.6 1918.5 547
8/23 1920.0 1920.8 1918.2 1918.2 337
8/24 1919.8 1919.8 1911.1 1911.1 195
8/27 1915.5 1921.5 1915.5 1917.9 99
3.2 Data Pre-Processing
3.2.1 Data Cleaning
The datasets we've gathered may include various
inconsistent elements, such as missing values,
outliers, and erroneous entries. The inconsistencies
can impact the performance of the algorithms. It will
cause misleading or inaccurate experimental results
during the research. Accordingly, it is very important
to do data processing after data collection to improve
the reliability of the data. One way to process the
missing data is to remove the affected data.
Alternatively, interpolation methods can be employed
to estimate and fill in the absent values, to ensure the
dataset remains comprehensive.
3.2.2 Data Transformation
Stock prices can be significantly variable between
different periods and different stocks. Normalizing
the data can be beneficial in making sure that the
values fall within the range of 0 to 1, so that the
variables are in a common scale without distorting
differences in the range of values. This facilitates
efficient training of LSTM networks and ensures
stable convergence.
3.3 Data Analysis
3.3.1 PCA
PCA is a tool that helps to reduce the dataset’s
dimensionality, which can help in decreasing the
number of dimensions in the data. It can summarize
the information content in large data sets to achieve
the goal of reducing dimensionality.
Stock Prediction Based on Principal Component Analysis Principal Component Analysis and Long Term Short Term Memory
393

PCA is an important step when starting data
analysis by solving “high-dimensionality” problems
in financial datasets. Stock data includes multiple
variables, such as opening price, closing price,
volume, and various technical indicators. Managing
all these dimensions without losing the integrity of
the data can be a great challenge. PCA can simplify
the complexity of high-dimensional datasets by
creating new variables, which are named “principal
components” (Wen et al 2020). The principal
components are the original variables’ linear
combinations. Also, they are uncorrelated with each
of the variables. Therefore, each of the principal
components is able to get unique information from
data without overlapping with the others. After this,
we can obtain a good representation of the original
data by considering fewer principal components. By
reducing dimensions, PCA makes data visualization
easier and more efficient. These linear combinations,
principle components, can be used to summarize
datasets and do not need to lose large amounts of
information. PCA also analyzes relationships
between variables by calculating a correlation matrix
for the entire data set (Kim et al 2021).
In addition, PCA is a good method to reduce the
noise and reduce the risk of overfitting when training
the data-predicted model. The variables from the
original stock market have a large amount of noise. If
the noises are not managed, the predictive ability of
the model will be distorted. When PCA is used to
preprocess the data, typically only the first few
principal components are retained. By discarding the
components associated with the smallest eigenvalues,
PCA effectively filters out some noise from the data.
3.3.2 LSTM
LSTM is a deep-learning network. It allows
information to persist. Also, LSTM is a variant of
RNNs. The primary aim of LSTM is to capture the
interrelationships among extracted features in order
to make accurate predictions (Zhang et al 2021).
The LSTM unit includes by a Storage-Gate unit,
an Input gate, a Forgetting gate, and an Output gate. In
the LSTM's process, some errors are passed directly to
the subsequent layer via the input gate, while others are
discarded through the forget gate. This mechanism
allows LSTM to address the issues of exploding and
vanishing gradients (Zheng and Xiong 2022). Also, it
allows LSTM networks to learn and judge the
information that needs to be stored, utilized, or
discarded. During this step, the LSTM unit’s
Forgetting Gate decides the amount of information to
forget based. The decision was made by the sigmoid-
activation function. Then Creates new feature data as
candidate values (Zhang et al 2021).
Stock prices exhibit sequential dependence,
which means that the future price of a stock will be
affected by a series of past prices. The memory unit
of the LSTM model enables it to learn and remember
patterns over time which helps it manage the
dependencies. The architecture of LSTM networks
allows LSTM networks to learn and judge the
information that needs to be stored, utilized, or
discarded.
4 DATA
In the research, I compared the stock price prediction
results obtained by using the PCA method with the
results that did not use PCA. The following table 2
collects the actual closing prices of stocks and the
closing prices of stocks predicted using the model for
"Gold Dec23" from August 28th to September 10th.
Table 2: Predicted Price.
Date With PCA Not with PCA Real price
8/28 1897.4 1906.1 1936
8/29 1910.0 1907.4 1944
8/30 1914.3 1918.1 1938.2
8/31 1921.8 1919.0 1939.8
9/4 1921.6 1935.8 1926.2
9/5 1920.9 1925.3 1918.1
9/6 1924.9 1930.6 1917.5
9/7 1927.9 1932.9 1918.4
9/10 1931.3 1928.5 1923.3
The picture below is the image obtained from
experimental data. The time period of the data is
between August 28th and September 10th. The gray
line represents the actual daily stock price data. It's
clear that the trend of the gray line changes from
continuously changing up and down to a sharp
decline and then to a slow rise. The green line is the
price predicted by the model without using PCA to
preprocess the data. The blue line is the price
predicted by the model using the PCA model to
preprocess the data.
After September 4th, the predicted values
obtained using the two methods (whether using PCA
or not) are relatively close to the actual stock price.
This shows that whether the PCA method is used or
DAML 2023 - International Conference on Data Analysis and Machine Learning
394
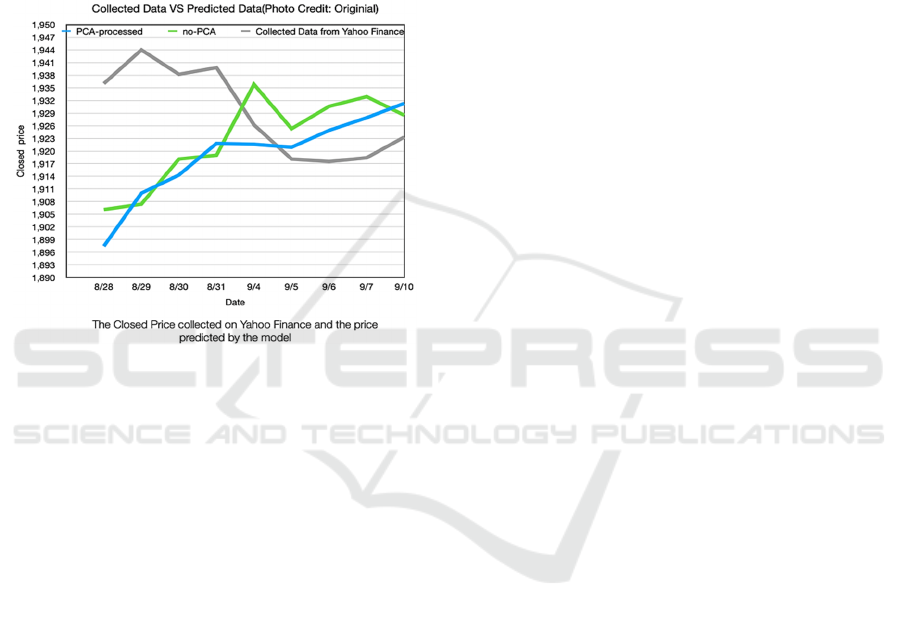
not, the ability of the basic model to capture key stock
price drivers is relatively good.
On most dates, the difference between the data
obtained using the PCA method and the data obtained
without using the PCA method is not very large.
However, as can be seen from the icon below, most of
the time the data obtained using the PCA method has a
smaller gap with the real price. Moreover, the data
graph using the PCA method is smoother.
The price error before 9/4 was very obvious. This
reflects that the performance of the model is not stable.
Figure 1: Collected Data, Predicted Data (PCA processed
and non-processed) (Photo credit: Original).
5 DISCUSSION
The performance of the stock price predictive model
is very easy to be influenced by many different factors,
especially under the economic background. The
analysis of stock prices is very complex and difficult.
That’s because the stock price can be affected by
many different factors, such as new policies, the news,
and new technologies.
According to the experimental results, it can be
proved that the model’s performance after using the
PCA method is indeed better but not obvious. The
performance of both models is unstable. For example,
in the experiment, the error in the prediction data
before 9/4 is obvious and difficult to ignore. The
difference is that the data after 9/4 has a smaller error.
Also, the changing trend (up and down) of the PCA-
processed graph is closer to the graph of the collected
data.
After analysis, I sorted out the following factors
that may cause errors:
1) Insufficient data used for training results in the
model's judgment ability being insufficient to deal
with noises.
2) The stock price of gold fluctuates greatly,
making it difficult to predict accurately.
3) No analysis of the impact of external factors on
stock prices.
The period of the data collection and the diversity,
and sufficient quantity of the data are very important
for the stock price prediction experiment. A dataset
with a limited amount of data may not have enough
ability to capture all possible anomalies and patterns
in stock price trends. That will make the module
cannot predict the trends correctly even if its
performance is excellent. In addition, financial data is
always full of noise, it can be influenced by many
variable factors. Without enough data, the model
might not exclude the noise. This will lead to the
appearance of overfitting and reduce the accuracy.
The price of gold is constantly fluctuating rather
than stable. Gold is a precious metal that has intrinsic
value. The stock price of it can be influenced by
various global events. Effects may be sudden.
Reduced appeal to investors, the Federal Reserve, war,
inflation, and banks around the world continue to
purchase gold on a large scale, all of which are the
factors that can sufficiently affect the price of gold.
For example, if conflict or war breaks out in gold-
producing areas, the facilities that mine gold may be
damaged. And maybe because of the war, the miners
who dig up gold will not go to work. This will lead to
a shortage of gold supply, thereby pushing up gold
prices. The impact of the war on gold prices was
sudden and significant. These unexpected impacts
can make forecasting gold prices a difficult challenge.
Insufficient data in the database used for training
is a very common problem in artificial intelligence.
The same problem also exists in AI applications in
dermatology. Dr. Roxana Daneshjou and her research
team tested the dermatological diagnosis
performance of “ModelDerm”, “DeepDerm” and
“HAM10000” in the study. After research, it was
found that these three artificial intelligences all have
insufficient information about dark-skinned patients,
which leads to a significant decline in their
performance in diagnosing dark-skinned patients
(Daneshjou et al 2022). This is an urgent challenge
that artificial intelligence needs to overcome.
To make the model perform better and make more
accurate stock price judgments, more data sets need to
be used when training the model. and to include the
influence of external factors in the analysis (Hu 2022).
First of all, the most important step to optimize the
module is to obtain more historical stock price data
Stock Prediction Based on Principal Component Analysis Principal Component Analysis and Long Term Short Term Memory
395

with a longer period in Yahoo Finance. This can fix the
problem of the lack of data used to train the model.
Furthermore, macroeconomic data including GDP,
unemployment rate, inflation rate, etc. can be added to
the database to help analyze stock prices. Adding these
factors that affect stock prices makes it easier and more
accurate for the module to predict stock prices.
Moreover, since news and social media data also
affect the predictive power of the model, they should
also be added to the database as data for analysis (Li et
al 2014). Using natural language processing (NLP)
technology can help extract company or market-related
information from news articles or social media posts
(Ding 2015). Next, by preprocessing these data, the
accuracy of the model can be improved.
6 CONCLUSION
In the study, I compared the stock price predictions
obtained using the PCA method with the stock price
predictions obtained without using the PCA method.
In the experiment, the LSTM model was trained on
20 data sets containing the opening price, high price,
low-price, closing price, and the volume of the stock
"Gold Dec23". After experimental research, it was
found that the model using the PCA method has fewer
errors than the model without the PCA method.
However, the performance of both models is unstable,
and the output results may be accompanied by large
errors. These issues may be caused by insufficient
data in the database used to train the model. Moreover,
the large price fluctuations of "Gold Dec23" and other
external factors such as policies and government
controls will make the stock price difficult to infer.
To make the accuracy of the production more stable
and excellent, the database used to train the model
should have more data for training the model. When
making stock predictions, factors that may affect
stock prices should be analyzed to optimize the model.
This research can provide a reference for
improving the performance of the neural network
LSTM. After experimental analysis, using the PCA
method to preprocess the data can indeed slightly
improve the data analysis and prediction performance
of the neural network LSTM. It is helpful to help
people who need to use LSTM for data analysis (not
just stock analysis) to analyze data and make the
results more accurate.
The database of this study is not large enough,
and the experiment needs to be improved by adding
more databases. In future research, more influencing
factors and reference data will be added to improve
the experiment.
REFERENCES
Y. Wen, P. Lin, and X. Nie, “Research of stock price
prediction based on PCA-LSTM model,” in IOP
Conference Series: Materials Science and
Engineering, vol. 790, no. 1, Mar. 2020, p. 012109.
X. Zheng and N. Xiong, “Stock price prediction based on
PCA-LSTM model,” in Proc. 2022 5th Int. Conf.
Mathematics and Statistics, Jun. 2022, pp. 79–83.
Y. Gao, R. Wang, and E. Zhou, “Stock prediction based on
optimized LSTM and GRU models,” Scientific
Programming, vol. 2021, pp. 1-8, 2021.
H. Liu, “A research on stock forecasting based on principal
component LSTM model,” in Proc. 2021 IEEE Int.
Conf. Advances in Electrical Engineering and
Computer Applications (AEECA), Aug. 2021, pp.
684–688.
K. Srijiranon, Y. Lertratanakham, and T. Tanantong, “A
hybrid framework using PCA, EMD and LSTM
methods for stock market price prediction with
sentiment analysis,” Applied Sciences, vol. 12, no. 21,
p. 10823, 2022.
J. Liu and D. Sun, “Stock price prediction based on principal
component analysis and long short-term memory
network,” Advances in Applied Mathematics, vol. 9, p.
1954, 2020.
W. Hu, “Stock price prediction based on IndRNN-LSTM
model,” Advances in Applied Mathematics, vol. 11, p.
209, 2022.
L. Gu and X. Wang, “Research on stock price prediction
based on LSTM model: A case study of Poly
Development,” Advances in Social Sciences, vol. 11,
p. 4517, 2022.
G. B. Kim, C. I. Hwang, and M. R. Choi, “PCA-based
multivariate LSTM model for predicting natural
groundwater level variations in a time-series record
affected by anthropogenic factors,” Environmental
Earth Sciences, vol. 80, p. 1-21, 2021.
X. Zhang, X. Lu, W. Li, and S. Wang, “Prediction of the
remaining useful life of cutting tool using the Hurst
exponent and CNN-LSTM,” The Int. Journal of
Advanced Manufacturing Technology, vol. 112, pp.
2277-2299, 2021.
R. Daneshjou, K. Vodrahalli, R. A. Novoa, M. Jenkins, W.
Liang, V. Rotemberg, A. S. Chiou, "Disparities in
dermatology AI performance on a diverse, curated
clinical image set," Science Advances, vol. 8, no. 31,
pp. eabq6147, 2022.
X. Li, H. Xie, L. Chen, J. Wang, and X. Deng, "News impact
on stock price return via sentiment analysis,"
Knowledge-Based Systems, vol. 69, pp. 14-23, 2014.
X. Ding, Y. Zhang, T. Liu, and J. Duan, "Deep learning for
event-driven stock prediction," in Twenty-fourth
International Joint Conference on Artificial
Intelligence, June 2015.
DAML 2023 - International Conference on Data Analysis and Machine Learning
396
