
Research on the Influencing Factors of College Students' Academic
Achievement Based on the Correlation Test Approach
Liuqi Chen
School of Cyber Science and Engineering, Nanjing University of Science and Technology, Jiangsu, China
Keywords: Academic Achievement, Correlation Test, Gender, Age of Enrollment, Multiclassification Logistic
Regression.
Abstract: College students' academic performance is an important indicator reflecting the quality of college education.
Based on the data provided by the academic system of colleges and universities, this paper uses correlation
test, chi-square test, multiclassification logistic regression analysis and other methods to investigate the effects
of gender, age at enrollment, attendance time, GDP, types of courses and other factors on students' academic
performance. It is found that gender, age at enrollment, attendance time, GDP, and types of courses had some
correlation with academic performance. In particular, students of male gender, older age at school, evening
attendance, and students from economically disadvantaged areas tend to be at a disadvantage in terms of
academic performance. And colleges and universities should pay attention to teaching these students and
guiding them to study efficiently in order to weaken the negative impact of these factors on students. In
addition to this, such students themselves should work harder to avoid academic warnings or even dropping
out of school.
1 INTRODUCTION
With the rapid development of the times, more and
more people are able to receive higher education and
become a college student. The academic performance
of college students is a reflection of the quality of the
education they receive. Unfortunately, the academic
performance of college students is partly polarized.
Many college students have excellent academic
performance, while many others face academic
warnings or even dropout. The study of the factors
affecting the academic performance of college
students is of great significance for improving the
quality of higher education and cultivating better
talents.
Scholars at both domestic and foreign countries
have made a lot of achievements on this research.
However, the previous research on the factors
affecting college students' academic performance is
often limited to a single aspect. In view of this, on the
one hand, this paper will summarize the results of
previous researchers, and on the other hand, it will also
process the data set through correlation test,
multiclassification Logistics regression analysis and
other methods as a supplement to the content of
previous researches.
Li and Omeng argued that the academic
performance of poor students is related to the poverty
level of their families (Li and Ou 2018). They
demonstrated that for poor families, family income
has a positive effect on students' academic
performance. Song used questionnaires and
interviews to illustrate the link between academic
performance and students' space preferences in the
classroom (Song 2020). He found that college
students' classroom spatial preference exists in
educationally active zones, and students in the front
and left-centre zones tend to be more likely to be paid
attention to by the teacher and to communicate with
them more, and therefore will receive more
educational resources and achieve higher academic
performance.
Some scholars have used the propensity score
matching method and the double difference method
based on propensity score matching to verify that
serving as a student leader can have a significant
positive impact on academic achievement (Wu and
Cui 2019). In this study, scholars pointed out that
student leaders tend to be motivated to learn and more
goal-oriented, and these factors all play a role in their
success in academic performance.
Scholars such as Wang focused on exploring the
influence of traditional values on students' academic
14
Chen, L.
Research on the Influencing Factors of College Students’ Academic Achievement Based on the Correlation Test Approach.
DOI: 10.5220/0012816600003885
Paper published under CC license (CC BY-NC-ND 4.0)
In Proceedings of the 1st International Conference on Data Analysis and Machine Learning (DAML 2023), pages 14-19
ISBN: 978-989-758-705-4
Proceedings Copyright © 2024 by SCITEPRESS – Science and Technology Publications, Lda.

performance (Wang et al 2019). Surprisingly,
although traditional values did not have a significant
effect on public class performance, they had a very
significant positive effect on professional class
performance. Also they pointed out that classroom
silent behaviour is likely to be a medium through
which traditional values act on academic performance.
This is something that needs to be adjusted
accordingly by the teaching staff. Also deserving of
some changes on the part of the teachers are the
teaching styles. A questionnaire experiment has
shown that microteaching has a significant positive
effect on students' motivation and academic
performance (Zhang et al 2020). In addition to this,
teachers need to improve their credibility with the
student body. This has also been shown to have a
positive effect on college students' academic
performance (Li et al 2020).
Hao and other scholars suggested that there might
be a link between the academic performance of
college students and their social circle (Hao et al
2020). They used standard deviation of grades and
spatial autoregressive model to analyze the effect of
social circle on academic performance. The results
shown that a good learning atmosphere within the
social circle positively affects college students'
academic performance.
It is worth mentioning that part-time job or not is
also an important factor affecting students' academic
performance (Xiong and Niu 2022). Xiong Yanqing
and other scholars found that for the vast majority of
the student population, there is a weak conflict effect
between part-time jobs and academic performance
before. In addition, the specific type and duration of
part-time jobs are also related to academic
performance. Meanwhile, there are many factors,
including psychological capital (Song et al 2021),
class atmosphere (Huang and Chen 2021). They also
play a role in the academic performance of college
students. Foreign scholars pay more attention to the
effect of sleep duration on academic performance
(Allison and Michael 2022). They believed that
students who get enough sleep tend to encounter fewer
academic obstacles, which makes it easier for them to
achieve higher academic performance.
Previous studies have focused on a variety of
factors, including social and economic factors.
However, there are still many factors that have not
been considered. In this paper, we will use correlation
tests, multiclassification logistic regression analyses,
and other methods to explore the effects of these
factors on college students' academic performance
from age at enrollment, time of attendance, gender,
and GDP.
2 METHODS
2.1 Data Sources and Description
The data used in this article comes from the Kaggle. It
includes demographic data, social-economic factors
and academic performance information that can be
used to analyze the possible predictors of student
dropout and academic success.
2.2 Selection and Description of
Indicators
Given that previous articles have not explored the
effects of students' age at enrollment, course types,
gender, GDP, and attendance time on students'
academic performance, this paper will examine these
five factors (Table 1).
Table 1: Statistical indicators data table.
variant data type range abbreviation
Age at
enrollment
number 18-35 x1
Daytime/evening
attendance
number 0,1 x2
Gender number 0,1 x3
GDP number -7.76 x4
Semester course
grades
number 0-17.58 x5
Target word
Dropout,
Graduate,
Enrolle
d
x6
Semester course
assessment
number 0-21 x7
Course number 1-17 x8
2.3 Methodology
2.3.1 T-Test
Often t-tests are used to validate hypothesis tests for
individual normal overall parameters when the
overall variance of the sample of data used for
statistics is unknown. For the variables semester
course assessment and semester course grades, it can
be assumed that their totals conform to a normal
distribution and that the overall standard deviation is
unknown. Therefore, in this paper the t-test will be
used to discuss whether the differences in their means
are significant or not.
Research on the Influencing Factors of College Students’ Academic Achievement Based on the Correlation Test Approach
15
2.3.2 Correlation Test
In this paper, Pearson correlation coefficient,
Spearman correlation coefficient will be used to
investigate the correlation between independent and
dependent variables.Spearman correlation coefficient
is a non-parametric measure of the dependence of two
variables on each other. It describes the correlation
between two variables in terms of degree of
monotonicity.Pearson correlation coefficient is used
to assess the linear correlation between two variables.
2.3.3 Chi-Square Test
The chi-square test counts the degree of deviation
between the actual observed values of a sample and
the theoretically inferred values.
2.3.4 Multiclassification Logistic Regression
Analysis
The outcome of whether or not a student drops out of
school is a categorical variable in this paper, as well
as the large number of socio-economic factors
involved, it was decided to use a multiclassification
logistic regression model to investigate the extent to
which these factors influence the outcome of students
dropping out of school.
3 RESULTS AND DISCUSSION
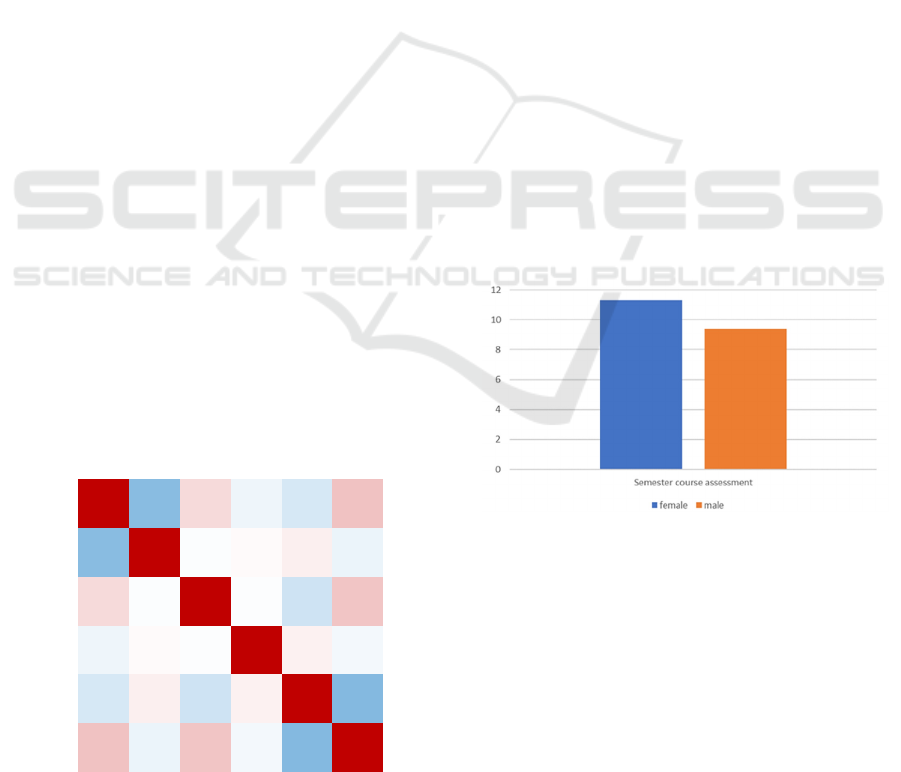
In the processing of the data set, this paper has
produced a heat map for the correlation coefficients of
the indicators. The data in this figure 1 will be used to
provide a discussion of the correlation of the factors
with semester course grades.
Figure 1: Heat map of correlation coefficients between
indicators.
3.1
Age at Enrollment
From Figure 1 this paper found that the Pearson
correlation coefficient between age of enrolment and
semester course grades reached -0.157 and showed
significance at 0.01 level. Thus there is a significant
negative correlation between semester course grades
and the age of students' enrolment. In this regard, this
paper hypothesises that the possible reason for this
may be that younger students are relatively more
smart, while older students may be distracted from
their studies due to many life factors. In order to get
better grades, older students should put in more efforts
in their studies to compensate for the disadvantage of
age.
3.2
Gender
In the dataset, 0 was used to refer to females and 1 was
used to refer to males. In order to investigate the
correlation between gender and semester course
grades, the t-test was used for the study. From Figure
1, it can be seen that all of the samples of different
genders showed significance (p<0.05) for all of the
semester course grades, meaning that all of the
samples of different genders were different for the
semester courses (showing significance at the 0.01
level). And from Figure 2, it can be concluded that the
mean value of 11.32 for females is significantly higher
than the mean value of 9.4 for males.
Figure 2: Comparison of t-test for gender and semester
course grades.
The results show that women perform
significantly better than men in terms of academic
performance at university. In addition to academic
performance, the dropout rate is also a very important
indicator. In this regard, this paper chose to use cross-
tabulation analysis (chi-square test) to explore the
effect of gender on whether or not a student drops out
of school.
x1 x2 x3 x4 x5 x6
x1
1 -0.462 0.149 -0.065 -0.157 0.243
x2
-0.462 1 -0.012 0.023 0.064 -0.075
x3
0.149 -0.012 1 -0.008 -0.189 0.229
x4
-0.065 0.023 -0.008 1 0.055 -0.044
x5
-0.157 0.064 -0.189 0.055 1 -0.485
x6
0.243 -0.075 0.229 -0.044 -0.485 1
DAML 2023 - International Conference on Data Analysis and Machine Learning
16
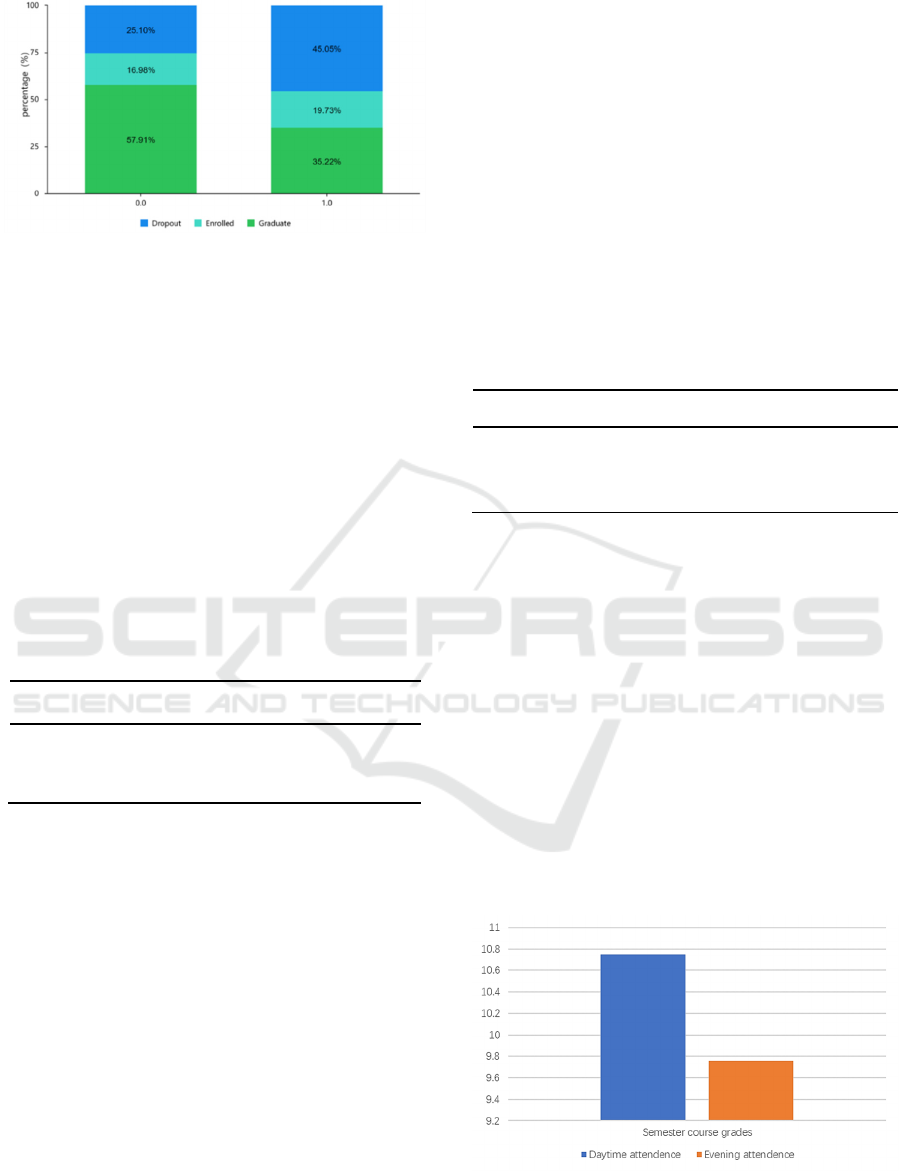
Figure 3: Cross-tabulation of gender and dropout outcomes.
Figure 3 shows that 45.05 per cent of males drop
out of school, which is significantly higher than the
25.10 per cent of females who do so. Whereas, 57.91
per cent of females successfully graduated, which is
significantly higher than 35.22 per cent of males. In
this chi-square test the p-value is 0.000<0.05, and the
different gender samples show significant difference
for the students' dropout rate.
In order to exclude the possible existence of the
factor that the teacher's awarding of marks is not fair
to males and females, this paper also did a correlation
test of Pearson coefficient between the semester
course assessment and gender. The results are shown
in Table 2.
Table 2: Table of Pearson's correlation coefficients between
gender and semester course assessment.
Semester course
assessment
correlation coefficient -0.021
gender p-value 0.156
sam
p
le size 4424
The value of the correlation coefficient between
semester course assessment and gender is -0.021,
which is close to 0, and the p-value is 0.156 > 0.05,
thus indicating that there is no correlation between
semester course assessment and gender. At this point,
the possible factor of unfairness in the teacher's
grading can be excluded, and it is basically certain that
gender has a real impact on the students' learning
status.
University study often requires a great deal of self-
discipline and time management skills. This paper
hypothesises that it is likely that women's academic
performance at university is significantly better than
that of men because of their significant advantages
over men in these two areas. In order to achieve the
desired results in university and avoid failing courses
and academic warnings, males should focus on self-
discipline and time management, and should not lose
their minds in fun and games. Of course, there may be
other factors, and it is up to future researchers to find
out the exact reasons.
3.3
GDP
For the effect of GDP, the Pearson and Spearman
coefficients were used to explore the correlation
between the two variables.
From Figure 1, it can be easily seen that the value
of the correlation coefficient between semester course
grades and GDP is 0.055 and shows significance at
0.01 level. And when this paper starts from the point
of view of Spearman coefficient, this paper gets the
same answer.
Table 3: Spearman's correlation coefficient table between
GDP and semester course grades.
Semester course grades
correlation coefficient 0.092
GDP p-value 0.000
sample size 4424
The value of the correlation coefficient between
semester course grades and GDP is 0.092 and shows
significance at the 0.01 level, thus indicating that there
is a significant positive correlation between semester
course grades and GDP. This author speculates that
this may be due to the higher teaching standards of
teachers and the relatively better supporting facilities
in developed areas. Students are more likely to achieve
satisfactory results.
3.4
Time of Attendance
In addition to this, students' attendance time may also
be an important factor affecting students' academic
performance. In this regard, this paper used t-test to
investigate the effect (figure 4).
Figure 4: Comparison of t-test of attendance times and
semester course grades.
Research on the Influencing Factors of College Students’ Academic Achievement Based on the Correlation Test Approach
17
From Table 4, it can be seen that: the different
attendance time samples show significance (p<0.05)
for all of the semester course grades. The mean value
of 10.75 for daytime attendance is significantly higher
than the mean value of 9.76 for evening attendance,
and it is hypothesised that this may be due to the fact
that during the daytime it is easier for students to
concentrate and attend classes more efficiently, and
therefore it is easier for them to achieve higher grades.
In the evening, however, students are more sleepy and
less efficient in class attendance, resulting in
insufficient knowledge mastery and lower test scores.
Considering the above, this article suggests that
students try to choose the daytime courses, and if they
choose the evening courses, they should be more
energetic to listen to the lectures, so as to avoid
achieving lower scores due to lack of concentration.
Table 4: Table of t-test results of attendance hours and
semester course grades.
Attendance time (mean
± standard deviation
)
t p
0.0(n=483) 1.0(n=3941)
Semester
course
grades
9.76±4.94 10.75±4.82 -4.181 0.000**
* p<0.05 ** p<0.01
3.5
Types of Courses
On top of these factors, this paper also considers the
fact that different course difficulties may create
different barriers to graduation difficulty for students.
So the paper makes a cross-tabulation graph of course
type and student dropout outcomes.
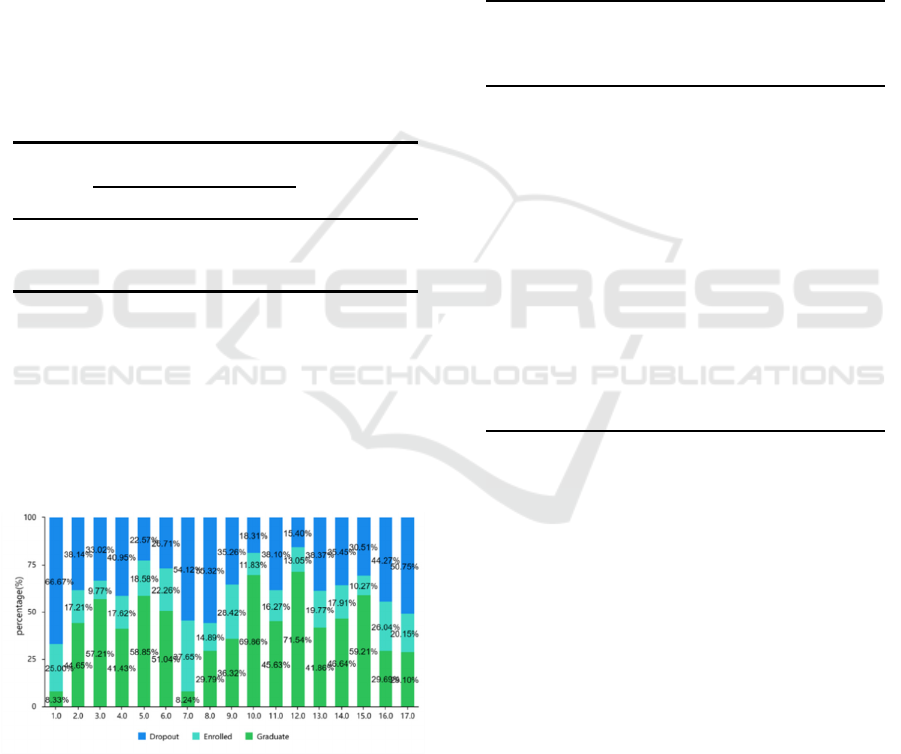
Figure 5: Cross-tabulation of programme and dropout
outcomes.
From the figure 5, it can be seen that there are
obvious differences in the failure rates of different
courses. For courses with high failure rates, students
should study carefully to overcome the difficulties,
and teachers should consider lowering the difficulty of
the course assessment to avoid making it too difficult
for students.
3.6
Regression Modelling
Above this paper analyzed the correlation between
each factor and students' academic performance, and
below this paper will use the multiclassification
logistic regression analysis model to describe the
extent of the impact of these factors on students'
academic performance..
Table 5: Summary of the results of the multiclassification
logistic regression analysis.
Enrolled in
school
(regression
coefficient)
Dropout
(regression
coefficient)
gender
0.630** 0.965**
-7.113 -12.926
age at enrollment
0.013 0.072**
-1.662 -12.678
daytime/evening
attendance
0.089 0.265*
-0.546 -2.061
GDP
-0.005 -0.032*
(-0.293) (-2.037)
intercept
-1.585** -2.719**
(-5.721) (-12.648)
likelihood ratio test χ2(8)=466.443,p=0.000
dependent variable: outcome
* p<0.05 ** p<0.01 z-values in brackets
After regression analyses (Table 5), the paper
ended up with two final formulas: ln(enrolled
/graduated) = -1.585 + 0.63 gender + 0.013 age at
school enrollment + 0.089 attendance time - 0.005
GDP. and ln(dropped out / graduated) = -2.719 +
0.965 gender + 0.072 age at school enrollment + 0.265
attendance time - 0.032*GDP.
Relative to graduation, the regression coefficient
value for gender is 0.630 for enrollment in school and
shows significance at the 0.01 level (z=7.113,
p=0.000<0.01), implying that gender significantly and
positively influences the outcome. While the
remaining four indicators are not for presenting
significance on the results. This means that these four
indicators do not have a significant effect on whether
students end up dropping out of school or not.
With this model, we can make predictions about
the likelihood of students successfully graduating.
DAML 2023 - International Conference on Data Analysis and Machine Learning
18

One of the predictions for graduation had an accuracy
of 86.33%. Students who are predicted not to graduate
successfully have to work hard and be wary of
academic warnings or even dropping out of school.
Therefore the establishment of this model has
practical meaning.
4 CONCLUSION
As time goes by, more and more college students are
facing academic warnings or even dropping out.
However, at the same time, there are also many
college students who have achieved excellent results.
In order to explore the factors behind, this paper on the
one hand summarizes the previous studies, and on the
other hand adopts the method of correlation test to
explore the influence of some social or economic
factors on students' academic performance which have
not been involved in the previous researches, as a
supplement to the previous researches.
In this paper, the effects of five factors, namely,
age at enrollment, gender, GDP, course types, and
attendance time, on students' academic performance
were investigated. It was found that all five factors are
related to students' academic performance. The age at
enrollment is negatively related and GDP is positively
related. When students' attendance time is during the
day and their gender is female, they will have a more
significant advantage in their performance.
Multicategorical logistic regression analysis found
that gender has the most significant effect on students'
academic performance among these factors. By
examining these factors, students will be in a better
position to identify the causes that affect their
academic performance and then correct them, thereby
avoiding the consequences of dropping out of school.
The study in this paper also has its limitations. The
factors involved in this paper are still not
comprehensive enough, such as parents' education
level, the area where the students were before
enrolling in school and other factors have not been
explored. At the same time, the data samples are not
collected objectively and comprehensively, and fail to
include different regions and different peoples. At the
same time, the fitting effect of the logistic regression
model is not particularly good. The research done in
this paper is for posterity only, and the investigation
of the role of some factors may not be correct. Future
research can work on the objectivity and
comprehensiveness of data collection to make the data
more persuasive and of universal value. In addition to
this, there are many other possible factors that also
play a role in students' academic performance but have
not yet been mentioned in this paper and previous
studies. Future research can continue to explore the
effects of these remaining possible factors and find
models that are more suitable for fitting these factors,
so that the regression model can be more specific,
comprehensive, and able to more accurately predict
students' academic performance, which will have the
effect of helping them avoid dropping out of school.
REFERENCES
J. Li, M. Ou, “Intergenerational transmission of
poverty:Poverty level and academic achievement,”
Financial Science, 2018, 9, 107-119.
B. Q. Song, “Research on the relationship between college
students' classroom space preference and academic
performance,” Yangzhou:Yangzhou University Master
Thesis, 2020, 72.
Q. X. Wu, S. Cui, “Can't Student Leadership and Academic
Achievement Be Combined?-A study based on the
tracking survey data of college students in Beijing,”
Fudan Education Forum, 2019, 17(04), 71-79.
J. L. Wang, L. Yang, S. F. He, “A study on the relationship
between traditional values, classroom silent behaviour
and academic achievement,” Heilongjiang Higher
Education Research, 2019(9), 89-95.
G. Q. Zhang, M. Zuo, Q. Ma, “The influence mechanism of
microcourses on college students' academic
performance,” Statistics and Management, 2020,
35(02), 92-96.
C. Y. Li ,P. J. ,Lu, Y. D. Shang, “An investigation of the
impact of teacher credibility on college students'
academic performance,” Future and
Development,2020,44(10):97-104.
Z. J. Hao, C. Lin, H. Y. Cao, X. M. Chen, Y. F. Ding. “The
influence of social circle on college students' academic
performance,” Modern Education Technology, 2020,
30(10), 85-90.
Y. Q. Xiong, X. C. Niu, “Do college students' part-time jobs
affect their academic performance?-Evidence from
meta-analysis,” Fudan Education Forum, 2022, 20(01),
62-70.
M. Z. Song, T. T. Ai, H. Z. Fu, “The effect of college
students' psychological capital on academic
performance - Comparison and selection of competitive
models,” Higher Education Forum, 2021(03), 114-119.
J. Huang, Q. Chen, “The effect of class atmosphere on
college students' academic performance: the mediating
role of peer relations,” International Public Relations,
2021, 4, 44-45.
N. Allison, S. Michael, “Sleep Disparities and the
Academic Achievement Gap in 1.9 Million College
Students,” SLEEP, 2022, 45(1), A31.
Research on the Influencing Factors of College Students’ Academic Achievement Based on the Correlation Test Approach
19
