
Visual Analysis of the Development of China's Tourism Industry in
the Past Five Years
Qiming Lin
International College, Hebei University, Hebei, China
Keywords: Supply-Side Structural Reform of Tourism, High-Quality Development, SPSS Analysis, Literature Analysis,
SWOT Analysis.
Abstract: In the past five years, tourism has become a crucial supporting sector of China's economy and an important
way of living in a well-off society. Therefore, examining the growth of China's tourism sector over the last
five years can provide valuable insight into its overall progression. Firstly, this paper introduces the basic
theory of supply-side structural reform and high-quality tourism development and describes the current
development status of China's tourism industry. Secondly, this paper analyzes domestic and foreign data
differently, using SPSS to study domestic data and data charts to analyze foreign data. At the same time,
literature analysis and SWOT analysis are used to analyze tourism development. The research results show
that China's tourism industry is currently experiencing the problem of unbalanced regional tourism
development and the recovery of tourism after the epidemic. Finally, this paper concludes and makes
reasonable suggestions based on the analysis.
1 INTRODUCTION
In the past five years, with the improvement of the
development level and the change of people's living
needs, the rapid development of tourism has
gradually become an important way of life in a well-
off society in China.
The national culture and tourism industry adhered
to the integration of culture and tourism development,
accelerated the supply-side structural reform of the
tourism industry, and focused on promoting high-
quality development from 2016 to 2020. According
to the data released by the Ministry of Culture and
Tourism of the People's Republic of China, in 2019,
the comprehensive contribution of the tourism
industry to GDP was 10.94 trillion yuan. The data
show that tourism has become an important industry
to improve China's national happiness index. It also
is of great significance in driving the economic and
social progress of China.
Rather than moving goods across space, tourism
works by temporarily moving consumers across
space to consume local services and facilities (Liping
2019). Tourism is a diversified industry involving
regional cuisine, transportation, cultural
transmission, ecological civilization construction and
other directions. Therefore, it is of great economic
significance to study the development of tourism.
This paper mainly focuses on the evolution of
Chinese tourism industry over the last five years, as
well as the uneven regional development in the course
of tourism development (Hai et al 2020). This paper
gives reasonable answers and explanations to such
questions as the connotation of the supply-side
structural reform of tourism (Hanlian 2021), the
connotation of high-quality development of China's
tourism industry and how to achieve high-quality
development, the impact of the epidemic on the
tourism industry and how to revive the tourism
industry after the epidemic, and how to integrate
culture and tourism (Huanhuan 2021).
This paper's primary objective is to comprehend
the progress of China's tourism sector in the previous
five years, analyze the advantages and disadvantages
of the current tourism industry, put forward
reasonable explanations, and provide effective
recommendations to foster the growth of China's
tourism industry.
Lin, Q.
Visual Analysis of the Development of China’s Tourism Industry in the Past Five Years.
DOI: 10.5220/0012819500003885
Paper published under CC license (CC BY-NC-ND 4.0)
In Proceedings of the 1st International Conference on Data Analysis and Machine Learning (DAML 2023), pages 197-206
ISBN: 978-989-758-705-4
Proceedings Copyright © 2024 by SCITEPRESS – Science and Technology Publications, Lda.
197

2 RELEVANT THEORETICAL
CONCEPTIONS
2.1 Fundamental Concept
On November 10, 2015, the Chinese government put
forward the "supply-side structural reform" concept.
In the past, China stimulated its economy by
expanding domestic demand and driving
consumption. However, in order to meet the
requirements of the development of the new era, the
government has established a new economic growth
mode. The government shifts the focus to the supply
side, starts from the production side, and promotes
economic development.
In terms of tourism, people's demand cannot be
satisfied due to the unreasonable allocation of
resources. Structural transformation and upgrading of
the supply side of tourism can make the supply of
tourism products meet people's needs, which is the
structural reform of the tourism supply side. It can
promote tourism development and economic
development.
As for the study of high-quality development,
some scholars have expanded from the high-quality
development of the whole macroeconomic society to
the high-quality development of specific industries,
including manufacturing, agriculture, finance,
construction, and so on (Huanhuan 2021). This paper
holds that similar core viewpoints exist for tourism's
high-quality development with other industries.
1) Adhering to the bottom line of safety is to take
the safety of tourists' lives and property as the first
standard. The tourism industry needs to ensure the
safety of tourists in various aspects, such as
infrastructure construction, food safety, and traffic
safety.
2) Adhering to the people-oriented approach,
which is to focus on the demands of tourists. The
tourism industry needs to continuously enrich the
types of tourism products, create excellent products
with regional characteristics, and strive to meet the
diversified needs of tourists.
3) Adhering to coordinated development means
that multiple industries cooperate with each other.
The government needs to guide the coordinated
development of tourism and related industries such as
transportation and accommodation to build a good
business atmosphere.
4) Adhering to innovation is to encourage
operators to innovate, combine science and
technology, create digital and intelligent tourism
products. This can promote tourism development.
2.2 Research Methods
The data in this paper are analyzed using the relevant
data released by the National Bureau of Statistics of
China (China Statistical Yearbook 2021). The period
of use of the data in this paper is from 2017 to 2021,
with incomplete data after 2022, and incomplete
relevant international data after 2019.
The data includes the number of travel agencies,
the number of A-level scenic spots, the number of
star-rated hotels, the number of domestic tourists, the
hotel and catering turnover, the domestic tourism
revenue, the turnover of tourists, and the urban green
area.
2.2.1 SPSS (Wenxia and Min 2019)
SPSS software is used to make a principal component
analysis of each index of China's tourism industry in
the past five years. The technique of principal
component analysis is a statistical approach that aims
to reduce the dimensionality of a dataset by
transforming multiple variables into a set of
composite variables. This method can extract the
main components of the data and reveal the internal
relationship between the variables.
2.2.2 Literature Analysis (Huanhuan 2021)
The documentation on the development of the
tourism industry is collected through the search of the
CNKI and the Government's work report. This paper
classifies and summarizes the collected literature
materials, so as to deeply understand the advantages
and disadvantages of the current research results on
tourism development.
2.2.3 SWOT Analysis
This paper uses SWOT analysis to analyze the
advantages, opportunities, disadvantages and threats
of tourism development. Through SWOT analysis,
corresponding policies and strategies can be
formulated according to these factors to promote the
healthy development of tourism.
3 DEVELOPMENT OF TOURISM
IN CHINA
3.1 Infrastructure
Table 1 shows the state of infrastructure construction
in China from 2017 to 2021. According to the data,
DAML 2023 - International Conference on Data Analysis and Machine Learning
198
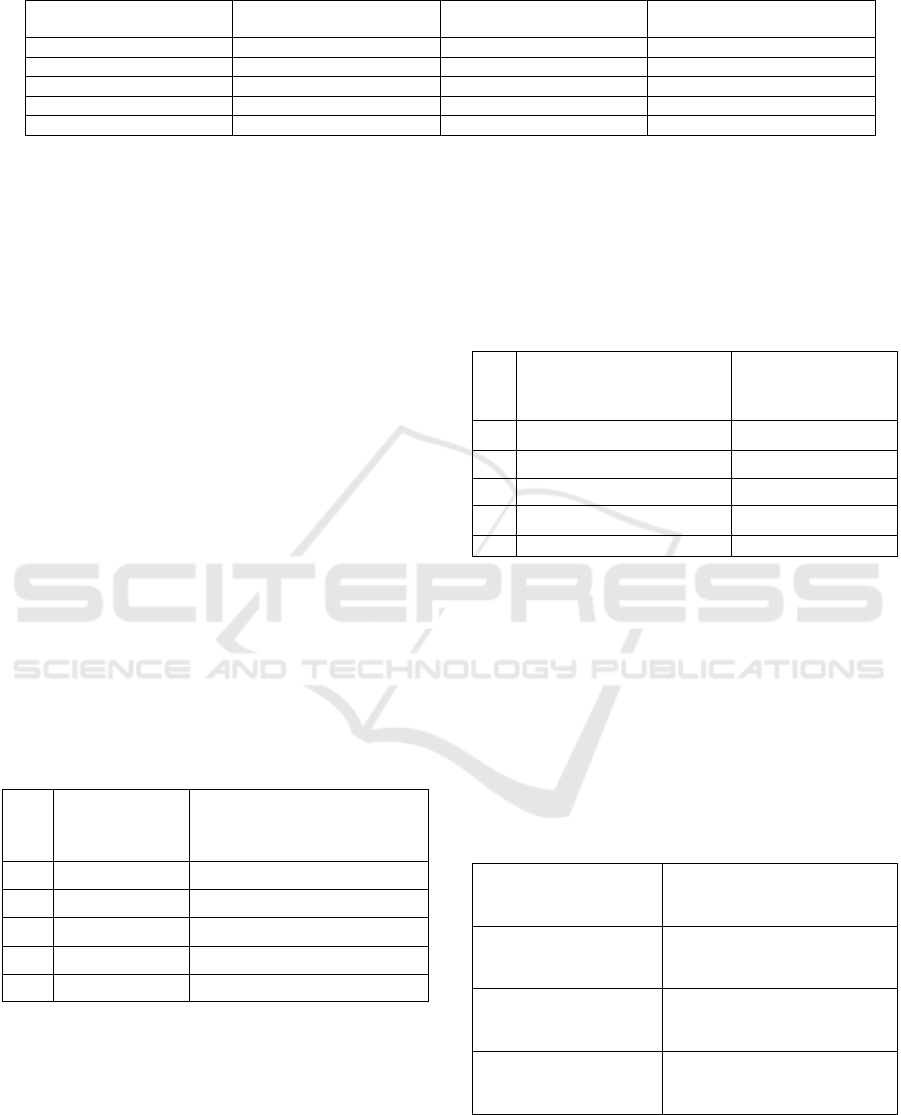
Table 1: Changes in China’s tourism Infrastructure From 2017 to 2021 .
Years
Number of travel agencies
(Piece)
Number of A-level scenic
spots (Piece)
Urban green area (Hectare)
2017
29717
10806
2921436
2018
37309
11924
3047108
2019
38943
12402
3152889
2020
40682
13332
3312245
2021
42432
14196
3479788
from 2017 to 2021, the number of travel agencies, the
number of A-level scenic spots and the urban green
space have steadily increased. This reflects the
development of the national economy and the
improvement of people's environment. China's
investment in tourism infrastructure construction has
increased, and tourism construction has developed in
an all-round way.
3.2 Number of Tourists
Table 2 shows the number of Chinese tourists from
2017 to 2021. From 2017 to 2021, the number of
domestic tourists and passenger turnover showed a
trend of first rising and then declining. According to
the data, from 2017 to 2019, the country made great
efforts to develop tourism. Therefore, the turnover
and the number of tourists have gradually increased.
However, in 2020, the COVID-19 pandemic has
changed the landscape of booming tourism. In the
face of this situation, the Chinese government decided
to adopt a closed management to protect the safety of
its citizens, which led to a very serious regression in
the development of tourism.
Table 2: Changes in China’s Tourism Number of Tourists
from 2017 to 2021.
Years
Domestic tourists
(10,000)
Passenger turnover (100
million person-kilometers)
2017
500100
32812.8
2018
553900
34218.2
2019
600600
35349.2
2020
287900
19251.5
2021
324600
19758.1
3.3 Tourist Income
Table 3 shows the income of China's tourism industry
from 2017 to 2021. According to the data, from 2017
to 2021, domestic tourism revenue showed a trend of
first rising and then declining. Tourism revenue began
to decline significantly in 2020 and rebounded in
2021. The impact of COVID-19 on tourism has been
profound. The turnover income of accommodation
and catering has increased year by year. Therefore,
people's basic survival needs have increased year by
year. Even amid the COVID-19 pandemic, sales are
still on the rise.
Table 3: Changes in China’s Tourist Income From 2017 To
2021.
Years
Domestic tourism revenue
(RMB 100 million)
Hotel and catering
turnover (RMB 100
million)
2017
45660.77
45664
2018
51278.29
46872
2019
57250.92
53711
2020
22286.3
58182
2021
29190.7
65666
4 DATA ANALYSIS AND
DISCUSSION
4.1 Aggregate of the Data
This paper assigns eight data values to eight variables
to help analyze data and statistics. The results are
shown in Table 4.
Table 4: Eight Data Variables Related to Chinese Tourism.
1
X
——Number of travel
agencies (Piece)
5
X
——Hotel and catering
turnover (RMB 100 million)
2
X
——Number of A-level
scenic spots (Piece)
6
X
——Domestic tourism revenue
(RMB 100 million)
3
X
——Number of star
hotels (Pece)
7
X
——Passenger turnover (100
million person-kilometers)
4
X
——Domestic tourists
(10,000)
8
X
——Urban green area
(Hectare)
Table 5 shows the data content of each variable
from 2017 to 2019. The data includes the number of
travel agencies, hotel and catering turnover, the
Visual Analysis of the Development of China’s Tourism Industry in the Past Five Years
199
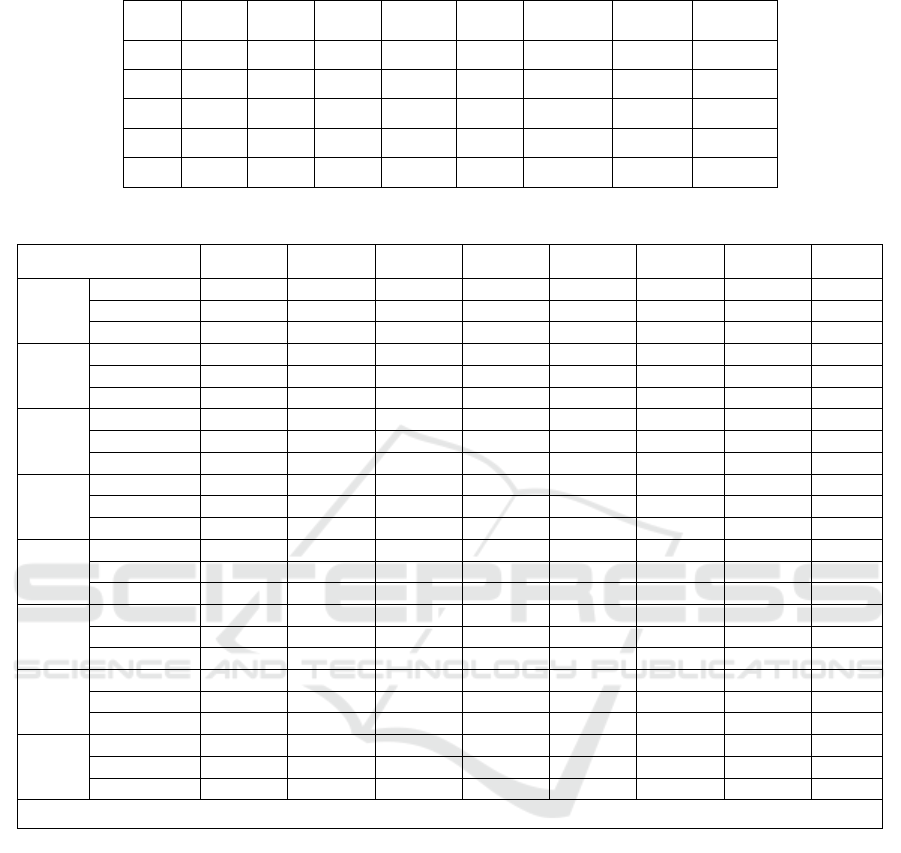
Table 5: The Original Data of Eight Data Variables of China’s Tourism.
Year
1
X
2
X
3
X
4
X
5
X
6
X
7
X
8
X
2017
29717
10806
9566
500100
45664
45660.77
32812.8
2921436
2018
37309
11924
8962
553900
46872
51278.29
34218.2
3047108
2019
38943
12402
10130
600600
53711
57250.92
35349.2
3152889
2020
40682
13332
8423
287900
58182
22286.3
19251.5
3312245
2021
42432
14196
8871
324600
65666
29190.7
19758.1
3479788
Table 6: The Results of Correlation Analysis of Eight Data Variables of Chinese Tourism.
X
1
X
2
X
3
X
4
X
5
X
6
X
7
X
8
X
1
PC
1
0.942
*
-0.424
-0.485
0.840
-0.455
-0.612
0.903
*
Significance
0.016
0.477
0.407
0.075
0.441
0.273
0.036
N
5
5
5
5
5
5
5
5
X
2
PC
0.942
*
1
-0.514
-0.699
0.964
**
-0.660
-0.804
0.994
**
Significance
0.016
0.376
0.189
0.008
0.225
0.101
0.001
N
5
5
5
5
5
5
5
5
X
3
PC
-0.424
-0.514
1
0.811
-0.396
0.831
0.776
-0.496
Significance
0.477
0.376
0.096
0.509
0.081
0.123
0.395
N
5
5
5
5
5
5
5
5
X
4
PC
-0.485
-0.699
0.811
1
-0.723
0.997
**
0.987
**
-0.734
Significance
0.407
0.189
0.096
0.167
0.000
0.002
0.158
N
5
5
5
5
5
5
5
5
X
5
PC
0.840
0.964
**
-0.396
-0.723
1
-0.678
-0.822
0.986
**
Significance
0.075
0.008
0.509
0.167
0.209
0.088
0.002
N
5
5
5
5
5
5
5
5
X
6
PC
-0.455
-0.660
0.831
0.997
**
-0.678
1
0.975
**
-0.693
Significance
0.441
0.225
0.081
0.000
0.209
0.005
0.194
N
5
5
5
5
5
5
5
5
X
7
PC
-0.612
-0.804
0.776
0.987
**
-0.822
0.975
**
1
-0.834
Significance
0.273
0.101
0.123
0.002
0.088
0.005
0.079
N
5
5
5
5
5
5
5
5
X
8
PC
0.903
*
0.994
**
-0.496
-0.734
0.986
**
-0.693
-0.834
1
Significance
0.036
0.001
0.395
0.158
0.002
0.194
0.079
N
5
5
5
5
5
5
5
5
1. PC: Pearson Correlation 2. Significance is bilateral significance
number of A-level scenic spots, the domestic tourism
revenue, the number of star-rated hotels, passenger
turnover, the number of domestic tourists and the
urban green area.
4.2 Correlation Analysis
Correlation analysis is a statistical method that
measures the strength and direction of the relationship
between two or more variables and can be used to
reveal the relationship between variables. This paper
uses SPSS software to conduct a correlation analysis
of eight variables from 2017 to 2021. The results are
shown in Table 6.
Table 6 is the result of correlation regression
analysis on Table 5. According to the data in Table 6,
following conclusions can be drawn.
There is a strong correlation between the number
of A-level scenic spots and the number of travel
agencies, indicating that the richness of tourism
resources has a certain impact on the number of travel
agencies.
There is a strong correlation between the amount
of hotel and catering turnover and the number of A-
level scenic spots, indicating that the increase of A-
level scenic spots may drive the development of hotel
and catering.
There is a strong correlation between the domestic
tourism revenue and the number of domestic tourists,
DAML 2023 - International Conference on Data Analysis and Machine Learning
200
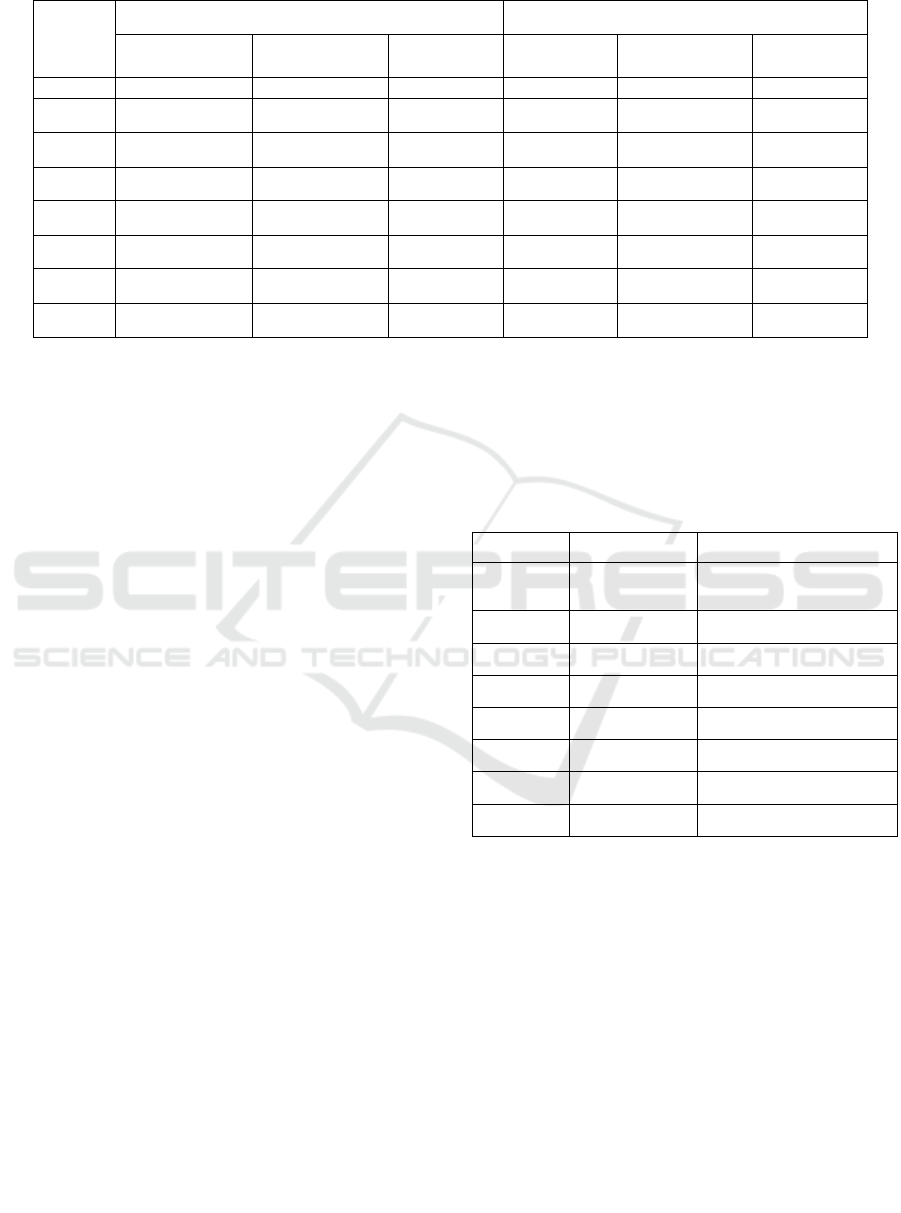
Table 7: The Results of Total Variance Explained of Eight Data Variables of Chinese Tourism.
Element
Initial eigenvalue
Extraction Sums of Squared Loadings
Total
Variance
percentage
Cumulative
%
Total
Variance
percentage
Cumulative
%
1
6.301
78.760
78.760
6.301
78.760
78.760
2
1.311
16.389
95.149
1.311
16.389
95.149
3
.362
4.519
99.668
4
.027
.332
100.000
5
5.903E-16
7.379E-15
100.000
6
3.989E-16
4.986E-15
100.000
7
-4.039E-17
-5.049E-16
100.000
8
-3.235E-16
-4.043E-15
100.000
indicating that the increase brings more tourism
consumption.
There is a strong correlation between the number
of domestic tourists and the domestic tourism revenue,
indicating that the development of tourism promotes
the flow of tourists.
There is a strong correlation between the urban
green area and the number of travel agencies,
indicating that the increase of urban green area may
attract more travel agencies to enter.
The urban green area is strongly correlated with
the number of A-level scenic spots and the hotel and
catering turnover, indicating that the increase of urban
green area may contribute to developing A-level
scenic spots and promote the growth of hotel and
catering turnover.
4.3 Principal Component Analysis
The common factor variance of principal component
analysis shows the proportion of each common factor
that explains the variance of the original variable.
Common factor variance can be used to measure the
ability of the common factor to explain the original
variable. A higher variance of the common factor
means that the common factor can explain a larger
proportion of the variance of the original variable,
indicating that the common factor has a strong ability
to explain the original variable. A lower variance of
the common factor indicates that the common factor
has a weaker ability to define the original variable.
According to the data in Table 7, taking the
number of travel agencies as an example, the common
factor variance of the number of travel agencies is
extracted to be 0.902, which means that the common
factor can explain 90.2% of the variance of this
variable. The same principle applies to other variables.
By analogy, it can be found that the common factor
variance of each variable is greater than 0.7, so the
variable can be explained well, which also proves the
rationality and objectivity of using the principal
component method.
Table 8: THE Common Factor Variance of Principal.
Initial
Extraction
1
X
1.000
0.902
2
X
1.000
0.996
3
X
1.000
0.822
4
X
1.000
0.978
5
X
1.000
0.953
6
X
1.000
0.982
7
X
1.000
0.983
8
X
1.000
0.995
In Table 8, the eigenvalues represent the
proportion of the variance explained by each
component, and the percentage of variance represents
the extent to which each component contributes to the
total variance. The cumulative percentage represents
the cumulative contribution of the first few
components to the total variance. In principal
component analysis, it is common to select only the
first few components, which explain most of the
variance, while ignoring the later components.
According to the data in Table 8, the contribution
degree of the first component and the second
component reaches 95.149%. Starting from the third
component, the eigenvalues and the percentage of
variance are very small, indicating that these
Visual Analysis of the Development of China’s Tourism Industry in the Past Five Years
201
components contribute little to the total variance.
Therefore, selecting the first two components explains
most of the variance in the data set.
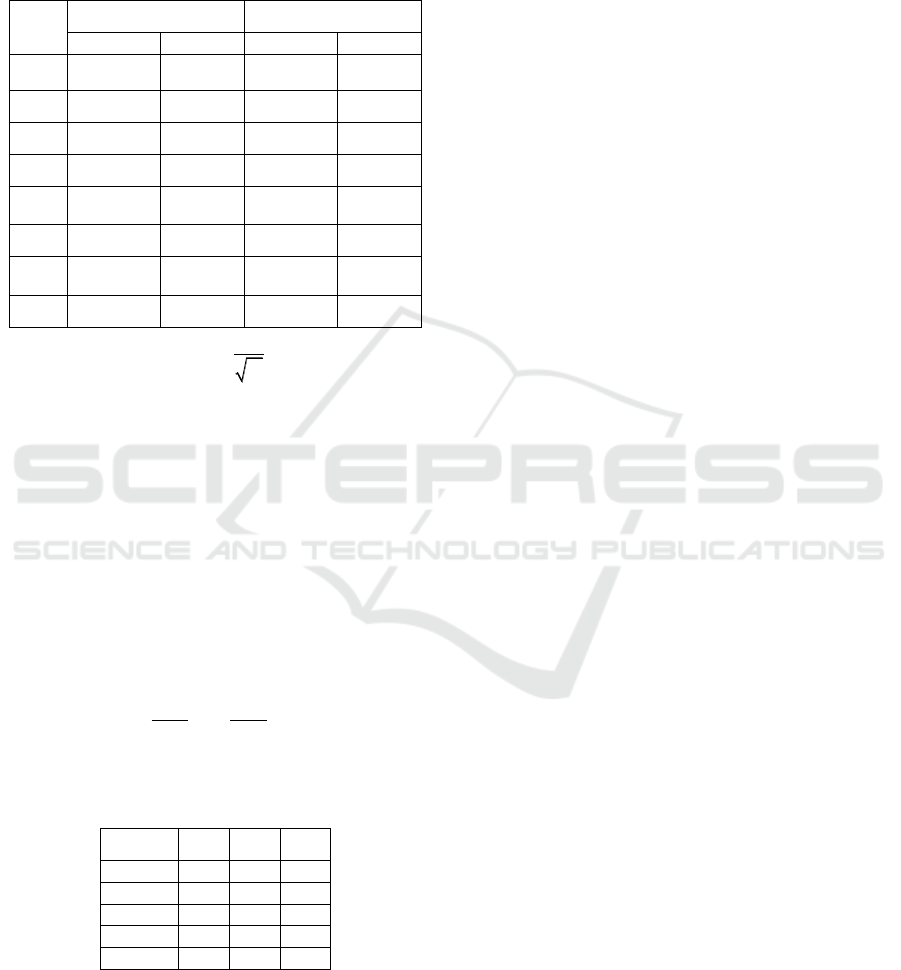
Table 9: After Extracting the Composition Component
Matrix of The Two Main Components and
i
U
.
Element
i
U
1
2
1
X
0.800
0.513
0.319
0.448
2
X
0.932
0.357
0.371
0.312
3
X
-0.730
0.538
-0.291
0.470
4
X
-0.909
0.390
-0.362
0.341
5
X
0.913
0.347
0.364
0.303
6
X
-0.887
0.441
-0.353
0.385
7
X
-0.963
0.238
-0.384
0.208
8
X
0.942
0.328
0.375
0.286
i
i
i
A
U
=
(1)
According to formula (1.1), Table 9 is obtained by
finding
i
U
.
i
A
is the data in Table 8.
The main component expressions (1.2) and (1.3)
are obtained according to the Z-score of eight
variables and
i
U
.
1 1 2 3 4
5 6 7 8
0.319* 0.371* 0.291* 0.362*
0.364* 0.353* 0.384* 0.375*
Y ZX ZX ZX ZX
ZX ZX ZX ZX
= + − −
+ − − +
(2)
2 1 2 3 4
5 6 7 8
0.448* 0.312* 0.470* 0.341*
0.303* 0.385* 0.208* 0.286* 0,1
Y ZX ZX ZX ZX
ZX ZX ZX ZX
= + + +
+ + + +
(3)
12
12
88
11
**
ii
ii
Y Y Y
==
=+
(4)
Table 10: Comprehensive Main Component Value.
1
Y
2
Y
Y
2017
-2.44
-1.18
-2.05
2018
-1.44
-.13
-1.12
2019
-1.54
1.65
-.92
2020
2.46
-.89
1.74
2021
2.96
.56
2.35
To construct the principal component synthesis
model (4), the weight was computed by dividing the
eigenvalues corresponding to the two principal
components by the total sum of the eigenvalues
extracted from all principal components—the
comprehensive principal component value Y can be
calculated according to (4). The results are shown in
the Table 10.
According to the data in Table 10, the tourism
industry has received the attention of the state in the
past five years, and the state has invested heavily in
infrastructure. The number of travel agencies, the
number of A-level scenic spots, the number of star-
rated hotels and the urban green area all show an
increasing trend year by year. Due to the impact of the
COVID-19 epidemic, tourism development has
temporarily stalled, and tourism revenue, the number
of domestic tourists, and passenger turnover has
regressed. However, in the overall development of
tourism, there is still a state of progress.
5 DATA VISUALIZATION AND
DISCUSSION
Due to the impact of the COVID-19 pandemic,
international travelers have been restricted from
entering China after 2020. Therefore, the data after
2019 is incomplete.
As shown in Figure 1, it shows the income and
composition of China's international tourism from
2017 to 2019. According to the data, long-distance
transportation accounts for the largest proportion of
China's annual international tourism revenue. This
shows that China's transportation infrastructure is well
developed, which facilitates the travel of international
tourists. It is closely followed by commodity
consumption. This shows that Chinese goods have a
certain attractiveness and competitiveness.
International tourists are willing to buy Chinese goods.
As shown in Figures 2, 3 and 4, they show the
gender composition, age composition and cause
composition of inbound foreign tourists from 2017 to
2019, respectively.
According to the data in the Figure 2, from 2017 to
2019, the number of foreign men visiting China
exceeded that of foreign women. This could mean that
China has made a stronger effort to attract male
tourists. Male foreign tourists are more likely to
choose China as a travel destination.
According to the data in the Figure 3, the age of
foreign tourists to China is concentrated between 25
and 44 years old. This age group may have more time
and resources to spend on travel. They may have a
greater interest in Chinese culture and attractions. In
contrast, international tourists younger than 14 years
old and international tourists older than 65 years old
DAML 2023 - International Conference on Data Analysis and Machine Learning
202

are less likely to visit China. This may be due to a
combination of factors such as travel preferences,
physical limitations, travel facilities, language and
cultural differences, and travel costs.
Figure 1: 2017-2019 International tourism revenue (billion
yuan) and its composition (Picture credit: Original).
Figure 2: Gender composition of inbound foreign tourists
from 2017 to 2019 (Picture credit: Original).
According to the data in the Figure 4, the main
purpose of foreign tourists visiting China is
sightseeing and leisure. The second part is other
activities. Sightseeing and leisure may include visiting
places of interest, experiencing local culture and
natural scenery. Other activities may include business
meetings, academic exchanges.
Figure 3: Age composition of inbound foreign tourists from
2017 to 2019 (Picture credit: Original).
Figure 4: The causes of inbound foreign tourists from 2017
to 2019 (Picture credit: Original).
As shown in Figure 5 and 6, they respectively
show the international tourism income of each region
in China and the number of inbound overnight tourists
received by each region in China. According to the
data, the international income and the number of
international tourists in Guangdong from 2017 to 2019
were much higher than those in other regions.
8 887,24
1 294,83
3 675,96
2 963,41
6 280,58
1 198,34
340,55
740,72
2 482,00
Long-distance transportation
Tour
Accommodation
Catering
Commodity consumption
Recreation
Posts and telecommunications
City traffic
Other services
2607,98
2859,71
2881,29
1686,32
1935,39
2030,07
0
500
1000
1500
2000
2500
3000
3500
2017 2018 2019
Male Female
134,75
161,18
184,92
568,82
656,71
686,20
2143,34
2394,69
2439,71
1256,03
1363,24
1365,75
191,36
219,28
234,77
0
500
1000
1500
2000
2500
3000
2017 2018 2019
<=14 15-24 25-44 45-64 >=65
569,68
614,70
628,47
1593,04
1608,57
1740,31
110,28
132,24
143,17
633,91
744,86
714,01
1387,4
1694,74
1685,40
0
500
1000
1500
2000
2017 2018 2019
Meetings/Business
Sightseeing and leisure
Visiting friends and relatives
Service employee
Other activities
Visual Analysis of the Development of China’s Tourism Industry in the Past Five Years
203
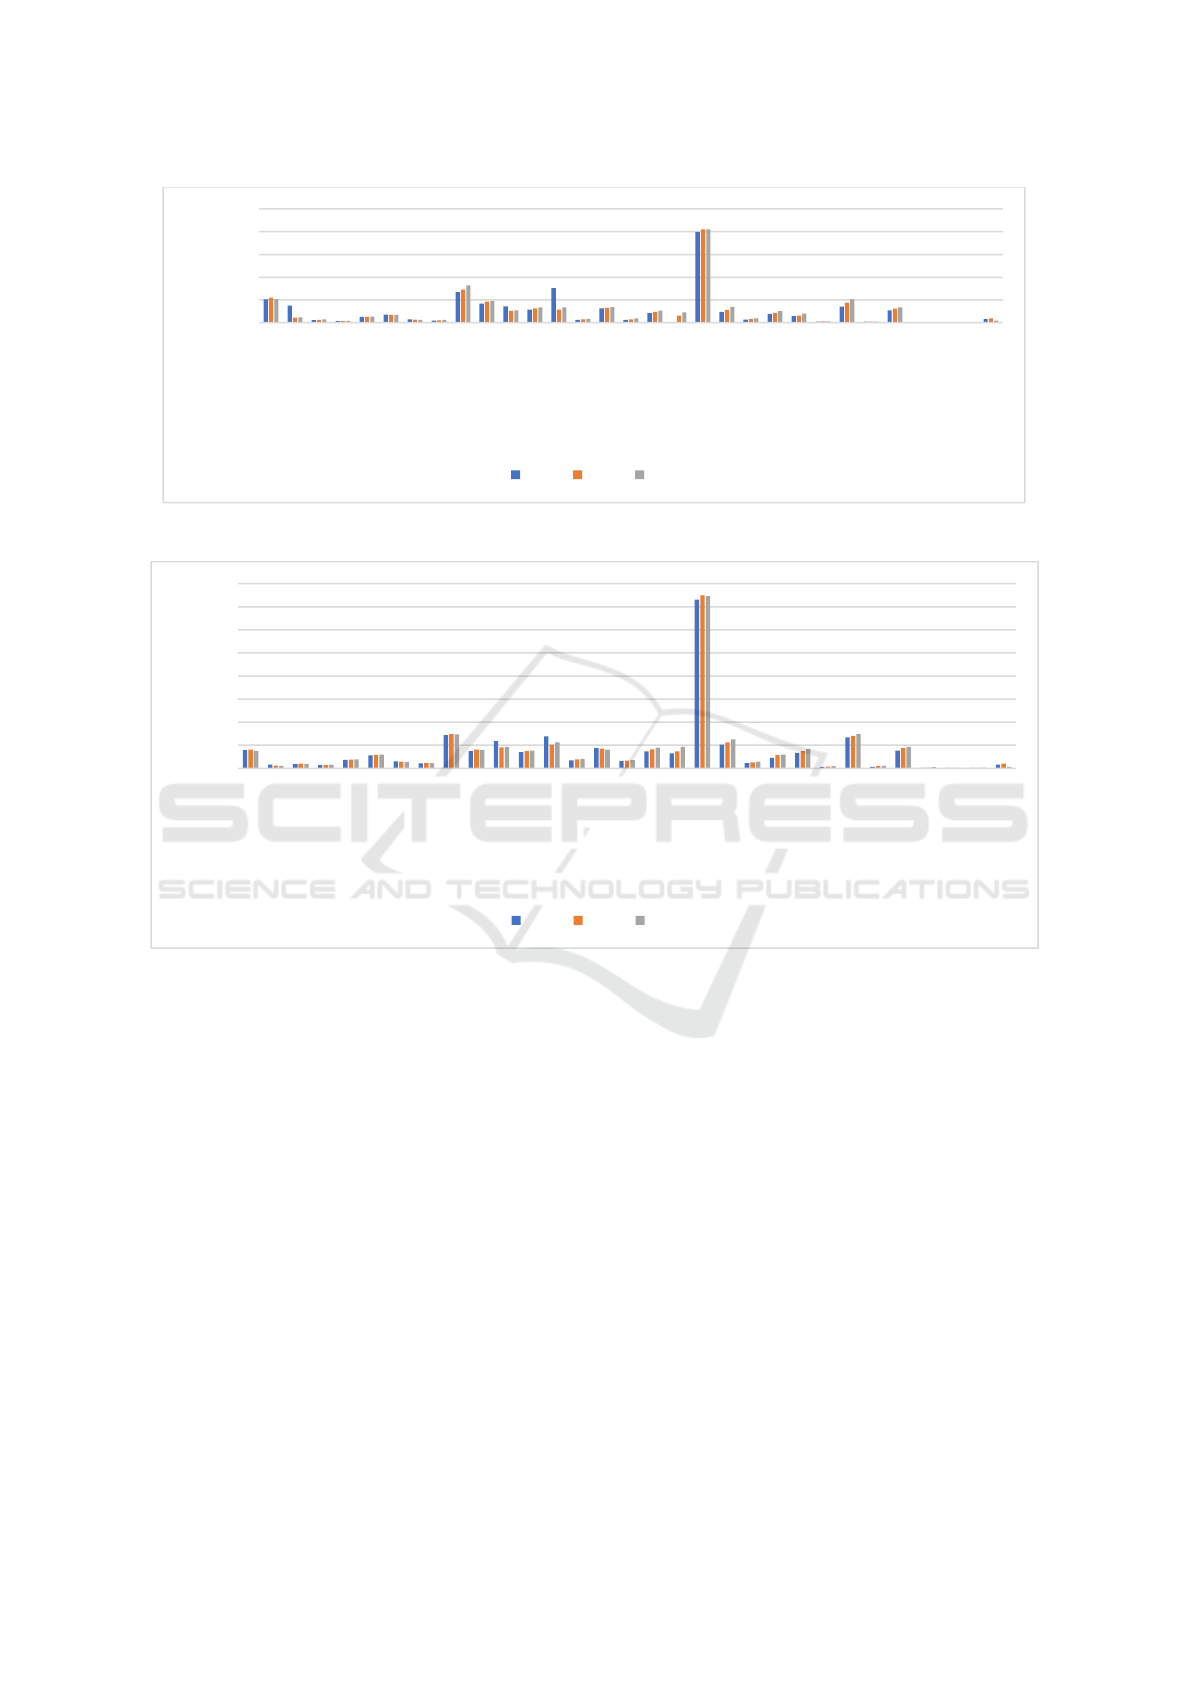
Figure 5: International tourism revenue by region (million dollars) (photo/Picture credit: Original).
Figure 6: Inbound overnight visitors by region (10,000) (Picture credit: Original).
5.1 Economic Foundation
Guangzhou is a famous commercial port with a long
history. It is also an important economic and cultural
center of southern China and a major port to the world
(Guangdong Province 2016). This means that
Guangdong has more tourism resources and facilities.
It is able to provide better service which can attract
more foreign tourists.
5.2 Culture Base
Guangdong is one of the most ethnically and
culturally diverse regions in China, with a history of
more than 2,000 years (Guangdong Province 2016).
Foreign tourists cannot only experience the unique
charm of traditional Chinese culture in Guangdong,
but also come into contact with the unique culture and
tradition of Guangdong.
5.3 Abundant Tourism Resources
Guangdong has many tourism resources, such as the
Pearl River Delta Economic Zone, Guangzhou,
Zhuhai, Shantou, Chaozhou and other cities. These
cities have a rich historical and cultural heritage, as
well as beautiful natural landscapes.
5.4 Convenient Transportation
Guangdong is one of the provinces with the most
frequent foreign exchanges in China, and its
transportation network is very developed. The total
length of expressways in Guangdong reached 11,200
km. The province's railway mileage reached 5,328
kilometers. The province has built nine airports,
which can easily connect the rest of the world
(Transportation Enterprise Management 2023).
0,00
5000,00
10000,00
15000,00
20000,00
25000,00
Beijing
Tianjin
Hebei
Shanxi
Inner Mongolia
Liaoning
Jilin
Heilongjiang
Shanghai
Jiangsu
Zhejiang
Anhui
Fujian
Jiangxi
Shandong
Henan
Hubei
Hunan
Guangdong
Guangxi
Hainan
Chongqing
Sichuan
Guizhou
Yunnan
Tibet
Shaanxi
Gansu
Qinghai
Ningxia
Xinjiang
2017 2018 2019
0,00
500,00
1000,00
1500,00
2000,00
2500,00
3000,00
3500,00
4000,00
Beijing
Tianjin
Hebei
Shanxi
Inner Mongolia
Liaoning
Jilin
Heilongjiang
Shanghai
Jiangsu
Zhejiang
Anhui
Fujian
Jiangxi
Shandong
Henan
Hubei
Hunan
Guangdong
Guangxi
Hainan
Chongqing
Sichuan
Guizhou
Yunnan
Tibet
Shaanxi
Gansu
Qinghai
Ningxia
Xinjiang
2017 2018 2019
DAML 2023 - International Conference on Data Analysis and Machine Learning
204

However, tourism development in northwestern
regions such as Gansu, Qinghai, Ningxia and Xinjiang
is relatively backward. This is because of the high
altitude, distance and low rainfall of these cities, which
is not conducive to the development of infrastructure
and is not conducive to attracting the attention of
international tourists.
6 DISCUSSION
6.1 SWOT Analysis
Based on SWOT analysis, this paper analyzes the
advantages, disadvantages, opportunities and threats
of China's current tourism industry.
6.1.1 Advantages
a) Infrastructure:
Most of China's tourism areas have relatively perfect
infrastructure, including urban green Spaces, hotels,
scenic spots and so on. These provide tourists with a
good travel experience.
b) Policies:
Governments in various regions have introduced
policies, such as ticket exemptions and preferential
Tours, which have attracted many tourists to travel.
6.1.2 Disadvantages
a) Regional development imbalance:
Tourism in some areas is under-developed, such as
imperfect infrastructure, single attractions, poor service
quality and so on. It's difficult to attract tourists.
b) The impact of the epidemic:
The tourism industry has been seriously affected. For
example, the decrease of tourists, the decline of tourism
income, the development of the industry is hindered.
6.1.3 Opportunities
a) Upgrading of tourism consumption:
With the improvement of people's income level,
tourism consumption has gradually upgraded. More
people are beginning to pursue high-quality and high-
experience travel products, which provides new
opportunities for the tourism industry.
b) Policy environment optimization:
The government's support for tourism is gradually
increasing, which provides a good opportunity for
tourism development.
6.1.4 Threats
a) Intensifying competition:
With the continuous expansion of the tourism market,
the competition is becoming increasingly fierce.
Tourism in some regions is facing competitive
pressure from other regions.
b) Unpredictable factors:
The tourism industry is affected by numerous
unforeseeable factors, such as weather and natural
disasters, which may harm the development of the
tourism industry.
6.2 Suggestions
In the face of the current advantages, disadvantages,
opportunities and threats of China's tourism industry,
this paper gives the following suggestions.
6.2.1 Strengthen Infrastructure
Construction
According to the results of principal component
analysis, infrastructure construction is the foundation
of tourism development, and it is a necessary
consideration for developing tourism resources and
promoting tourism products (Xiaoyu 2014). In
addition, strengthening infrastructure construction is
also a basic measure to solve the imbalance in the
development of tourism in various regions of China.
6.2.2 Integration of Culture and Tourism
(Zhibin 2023)
China is a country with a rich history and culture, with
many excellent historical and cultural heritages.
Regional governments should make good use of
regional cultural characteristics and integrate them
with tourism to produce diversified tourism products.
Stimulate consumers' consumption desire through
products. This can also improve the competitiveness
of regional tourism and improve the unbalanced
development of regional tourism.
6.2.3 Adhering to High-Quality
Development in the Tourism Industry
The state should strengthen policy support, provide a
good environment for tourism development, and
encourage business operators to innovate and develop
Visual Analysis of the Development of China’s Tourism Industry in the Past Five Years
205

different forms of tourism. The state should adhere to
the high-quality coordinated development of tourism
and let the whole industry cooperate with each other
to achieve economic growth.
6.2.4 Accelerate the Recovery of Tourism
after the Epidemic
In the post-opening era, the country should speed up
the construction of tourism and mobilize economic
growth. The opening of international group tourism
projects, the introduction of international tourists to
accelerate the recovery of tourism after the epidemic,
so that the country once again into the era of
unprecedented prosperity of tourism.
7 CONCLUSION
At present, China's tourism infrastructure is perfect.
The number of travel agencies, the number of star-
rated hotels and the number of A-level scenic spots
have increased significantly. The state policy is
comprehensive. Regional tourism policies cover all
groups and contribute to regional economic prosperity
through a variety of policies. Through SPSS analysis,
the rise of various data indicates that China's tourism
industry has become the most important economic
component of the country.
Even if China's tourism industry is developing well,
there are still various problems. Through the analysis
of literature and SWOT, this paper summarizes several
important problems: The unbalanced development of
different regions; The question of how tourism will
recover after the COVID-19 pandemic; How to
integrate cultural and tourism issues; How to carry out
high-quality tourism development.
In the face of the unbalanced development of
tourism in deep regions, this paper believes that
strengthening the construction of infrastructure is the
basic initiative. The government should learn to
integrate multiple industries, so as to highlight local
tourism characteristics and attract domestic and foreign
tourists.
In the face of the tourism industry, how to carry out
recovery projects is a top priority. This paper holds
that excellent policy is fundamental. The most
important way for the government to promote the
development of tourism is to create unique and
preferential tourism policies. The government should
carry out a project to revive the tourism industry by
stimulating people's desire to travel.
In the face of the problem of how to promote the
integration of culture and tourism, this paper holds that
the fundamental method is to adhere to regional
characteristics. Regional tourism governments need to
select the best parts of regional culture and portray
them as regional characteristics, such as cultural roles.
It can be integrated with tourism products to promote
the development of regional tourism.
In the face of the problem of how to carry out high-
quality development. This paper holds that protecting
people's safety is the basic requirement. The
government should also focus on the needs of the
people and promote the common development of
multiple industries. The most important point is to
focus on innovation.
In the future, China's tourism industry will
continue to flourish, creating more opportunities for
economic growth. The government and enterprises
will also work to improve the quality and sustainable
development of the tourism industry to provide
tourists with a better travel experience.
REFERENCES
Z. Liping, “Study on the Impact of Tourism on China’s
Economic Growth,” Shenzhen University , 2019.
X. Hai, Z. Liqiang and Z. Shuopeng, “The Current Problem
and suggestion of China’s Tourism Development,”
Foreign Economic Relations & Trade, 2020, pp.102–105.
L. Hanlian, “Research on the Driving Force and
Development Path of China’s Toursim Transformation
under the Background of Supply Side Structural
Reform,” Jiangsu University, 2021.
H. Huanhuan, “Research on the Temporal and Spatial
Characteristics and Influencing Factors of the High-
quality Development Level of China’s Tourism,”
Xiangtan University, June 2021.
“China Statistical Yearbook,” China Statistical Publishing
House, Beijing, 2021.
H. Wenxia, and L. Min “Analysis of Main Factors Affecting
the Development of Tourist Areas Based on SPSS
Data,” Computer engineering & Software, January
2019, vol.40, pp.144-149.
“Guangdong Province,” Inside and Outside the classroom,
2016, pp.132-133.
“Guangdong Province high-quality construction of integrated
comprehensive transportation,” Transportation
Enterprise Management, 2023, vol.38, pp. 92.
F. Xiaoyu, “Regional Differences in China's Tourism
Economy,” Ability and Wisdom, 2014, pp. 2+9.
J. Zhibin, “Research on the Integration of Intangible Cultural
Heritage and Tourism in the New Era,” Comparative
Study of Cultural Innovation, 2023, vol.7, pp. 112-116.
DAML 2023 - International Conference on Data Analysis and Machine Learning
206
