
Forecasts and Analyzes of China's Birth Rate
Yuping He
School of Mathematics and Statistics, Northeast Normal University, Changchun, China
Keywords: ARIMA Model, Time Series, Birth Rate.
Abstract: As China's birth rate declines, the country faces increasingly serious social problems. Inspired by the era of
big data, the study collected fertility data from 1949 to 2022 from China's National Bureau of Statistics. The
number of samples is 74. Organize the data into a time series, and the autoregressions moving average
(ARIMA) model was used to predict the trend of birth rate. In accordance with the Akaike Information
Criterion (AIC) guidelines, the final best model is ARIMA (0,1,2). The prediction of this model showed that
the number of birth rate from 2023 to 2027 would be a relatively stable trend with a slight increase probably.
The study is also a summary of the strengths and weaknesses of the model. Hopefully, the model can be
improved in the future and the application of time series method to predict the trend of birth rate can provide
effective guidance for the formulation of childbirth policies.
1 INTRODUCTION
In 2021, for the first time since the founding of China,
there was negative population growth. Birth rate only
8 per 1,000. According to the United Nations, India's
birth rate in 2021 is 16.4 per 1,000, more than double
China's; the United States' birth rate of 11.1 per 1,000
is also much higher than China's. China's birth rate has
become the lowest among populous countries.
However, the introduction of new policies has failed
to reverse the decline in the birth rate. Birth rate lower
in 2022 than in 2021. The lowest record was broken,
once again. According to the survey results, the
number of women of childbearing age in China has
declined and fertility intentions are low. It has brought
serious social pressure to China. For example:
population aging, workforce shortage, social security
pressure. China’s birth rate is not optimistic,
Projecting birth rate by mathematical modeling in
China is meaningful. It is meaningful to utilize
mathematical models for forecasting the birth rate in
China. Many scholars have done research in this area.
Using 11 years of data from Beijing, Zhao and Sun
developed a grey forecast model to predict age-
specific fertility rates (Zhao and Sun 2015). In 2017,
Li et al. predicted that China's population would grow
negatively by 2025 (Wang 2017). However, the
population is already showing negative growth, by
2021. This result points to a more rapid decline in the
birth rate. In China, the change in fertility policy from
“one-child” to “two-child” in response to the birth rate
problem has done little to raise the birth rate (Yage
2017). The idea that policy changes will not increase
fertility in the short term is also supported by Wang's
article (Wang 2018). Xue's study also concluded that
China's fertility rate is difficult to increase (Xue 2018).
Zheng et al (2019) looked at the impact of policies on
fertility in highly educated groups. The conclusion
was also that there was almost no effect. The three
articles examine fertility intentions from the aggregate
to the individual and conclude that the policy has not
led to an increase in birth rate. Wang analyzed the time
series using a Holt smoothing model and recovered the
data from 2016 onwards (Wang 2020). Li used an
Autoregressive Integrated Moving Average (ARIMA)
- Back Propagation Neural Network (BP) model to
predict provincial total fertility rates (Li 2021). Study
on the prediction of the number of elderly people using
the Grey Prediction Model GM (1,1) and the Support
Vector Regression (SVR) Model (Wang et al 2023).
The article used the Grey Prediction Model and the
Leslie Matrix Population Simulation Prediction
Model to predict the population of China (Chen 2016).
The multiple linear regression model is used to select
the most influential factors that can be used to predict
the future trend of population ageing in China (Tao et
al 2017). The article selected different models to
process the data and compare the superiority of the
models (Yan 2018).
66
He, Y.
Forecasts and Analyzes of China’s Birth Rate.
DOI: 10.5220/0012819800003885
Paper published under CC license (CC BY-NC-ND 4.0)
In Proceedings of the 1st International Conference on Data Analysis and Machine Learning (DAML 2023), pages 66-70
ISBN: 978-989-758-705-4
Proceedings Copyright © 2024 by SCITEPRESS – Science and Technology Publications, Lda.
Choosing the right model for different types of
data can improve accuracy. Time series analysis is an
analytical method that does not depend on explanatory
variables. This paper uses the ARIMA model in time
series analysis. Finally, the optimal model is selected
to be used to predict birth rate trends.
2 METHODOLOGY
2.1 Data Source
The birth rate dataset used in this study were acquired
from the National Bureau of Statistics of China. The
original data saved in .xlsx format.
2.2 Dataset Introduction
The birth rate is the number of births per 1,000 of a
country's population, averaged over the year. For
example, China's birth rate in 2022 will be 6.77 per
1,000, meaning that the country will have an average
of 6.77 births per 1,000 people in 2022. This study
examines the yearly birth rate spanning from 1949 to
2022, with a total of 74 datasets at hand. Sequence
diagram were plotted with these data in Figure 1. Plot
the autocorrelation diagrams (Figure 2).
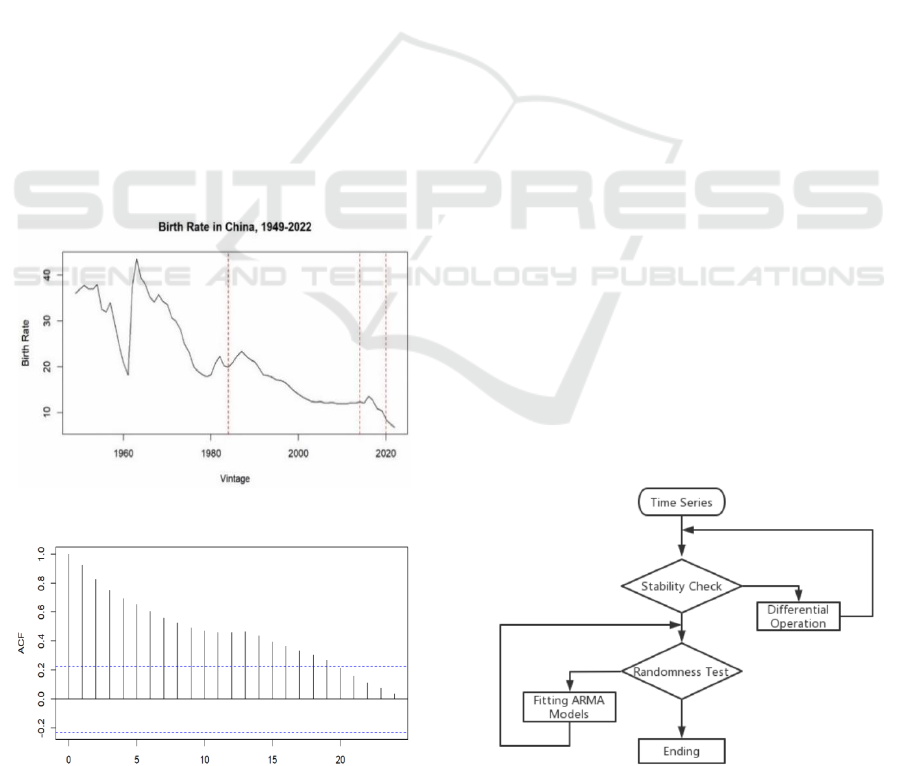
Figure 1: Birth Rate in China, 1949-2022 (Original).
Figure 2: ACF of the Time Series (Original).
In Figure 1, The three vertical lines represent 1984
(the year when the family planning policy was
introduced), 2014 (the year when the "two-child"
policy was introduced), and 2020 (the year when the
"three-child" policy was introduced). From 1949 to
1971, China's birth rate was almost above 30 per
thousand. Since 1972, China's birth rate has been
below 30 per thousand; since 1991, it has been below
20 per thousand; and since 2020, it has been below 10
per thousand. 1963 marked the apex of birth rates in
China followed by a consistent decrease in the
subsequent years. The decline has been particularly
significant in the past few years. In count after count,
birth rate has hit historic lows. The birth rate for 2022
is a mere 6.77. The time series depicted in Figure 1
and Figure 2 display non-stationarity.
2.3 Method Introduction
A time series is created when alterations in a variable
are recorded in chronological sequence. Time series
analysis involves the analysis of a series of
observations, as well as forecasting future changes.
The ARIMA model is commonly employed in the
analysis of non-stationary time series.
The ARIMA (p, d, q) model is structured as
follows:
()
,
, is the
autoregressive coefficient polynomial of the model.
, is the moving average
polynomial of the model”.
The modelling process for the time series is shown
in Figure 3.
Figure 3: Modelling Procedure (Original).
Forecasts and Analyzes of China’s Birth Rate
67
3 RESULTS AND DISCUSSION
3.1 Data Preprocessing
Of the 74 data used in this paper, there are no outliers
and no missing values. Based on the timeliness of the
time series, this paper uses the entire dataset for the
modelling process.
3.2 Stability Check
From Figure 1, the birth rate is on a downward trend.
It does not fulfil the characteristic of a smooth time
series with a mean value. The next step is to perform
an Augmented Dickey Fuller (ADF) test on the series.
The results showed p-value more than 0.05. Both
results indicate that the time series is not stability.
Therefore, this set of time series should be analyzed
using the ARIMA model.
3.3 Smooth Processing
The time series has a clear trend feature. Low-level
difference processing can generally extract trend data
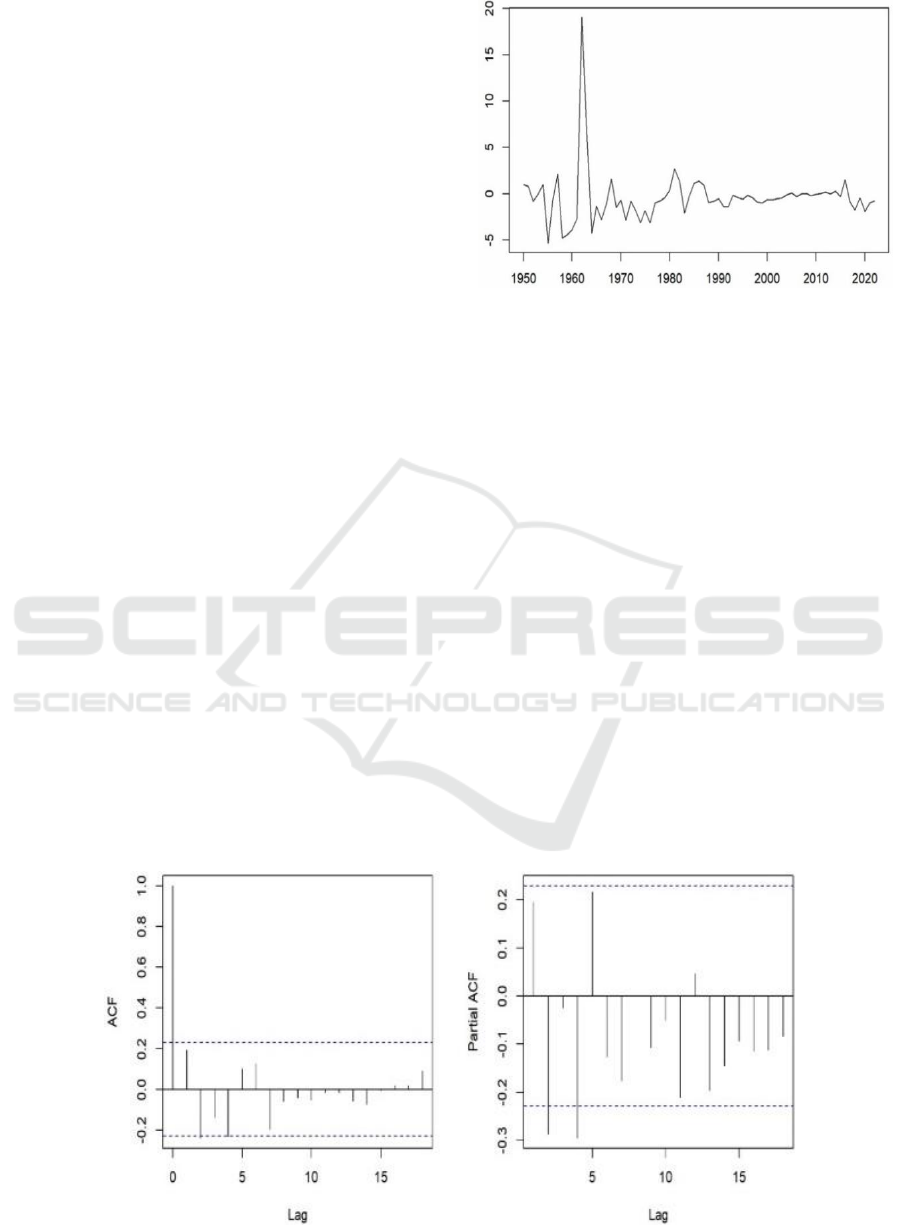
to be used for smoothing the time series. Plot the
timing diagrams (Figure 4), autocorrelation diagrams
and partial autocorrelation diagrams (Figure 5) after
first order differencing. The x-axis of Figure 5 shows
the delay cycles, while the vertical axis represents the
autocorrelation coefficient and the partial
autocorrelation coefficient. The dotted line indicates
the coefficient's two-fold standard deviation.
From Figure 4, The time series fluctuates above
and below a certain value. It is consistent with the
characteristic of a smooth time series having a mean
value.
Figure 4: Timing Diagrams after First Differencing
(Original).
Next, ADF test is performed on the time series.
The results showed p-value less than 0.05. In
summary, the time series after first order differencing
tends to be stationary. The next step is the construction
of an ARMA model for the smoothness time series.
3.4 Randomness Test
To guarantee that the modelling is valid, the sequence
must be examined for Ljung-Box. The p-value for the
LB statistic is significantly below 0.05. So, the series
is not a white noise series. This result indicates that the
time series has modelling significance can be
modelled.
3.5 Determining Coefficients
From Figure 5, almost all of the ACF-value are within
the dotted line. ACF chart displaying the features of
truncated tails. The PACF-value fluctuate up and
down frequently. It's a sign of a truncated tail. So, the
Figure 5: ACF and PACF of the Time Series (Original).
DAML 2023 - International Conference on Data Analysis and Machine Learning
68
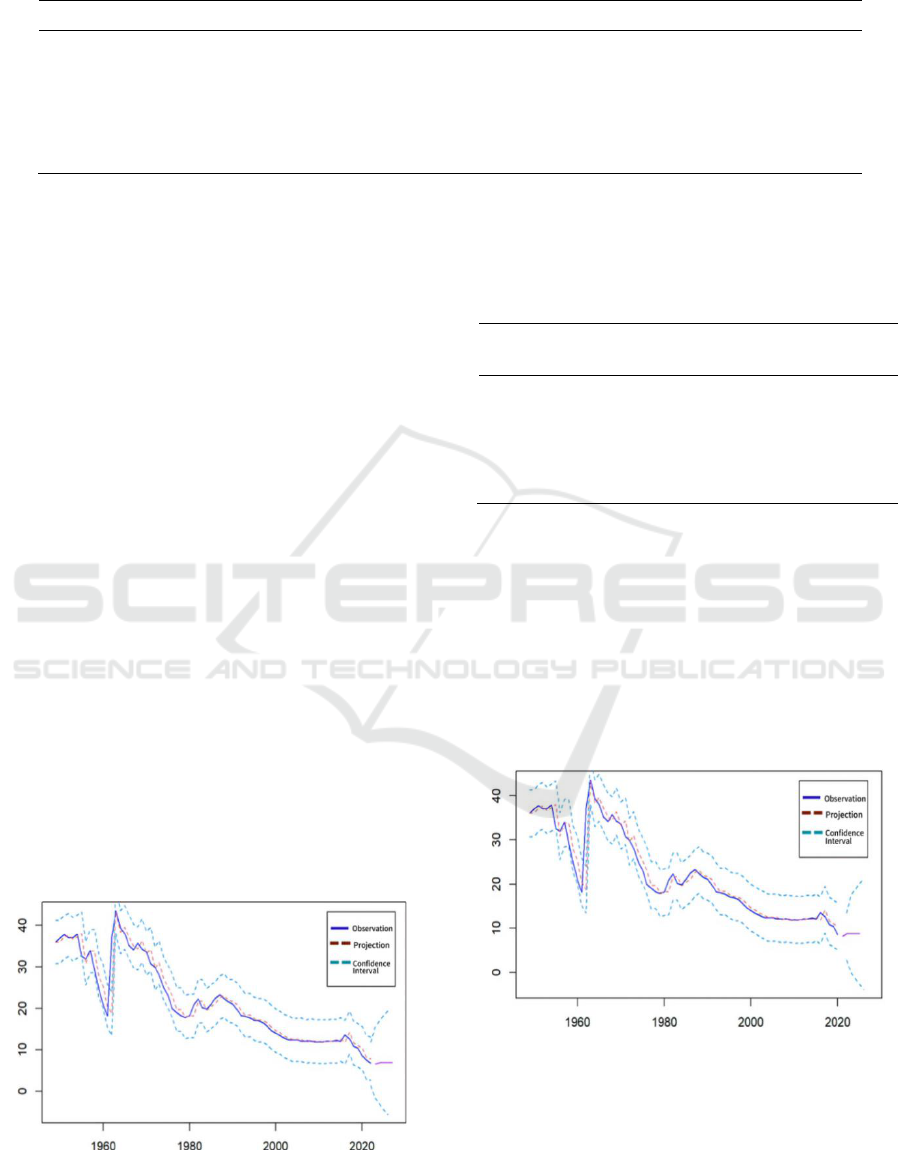
Table 1: AIC of Models.
ar1
ma1
ma2
AIC
ARIMA (0,1,1)
-
0.4326
-
360.53
ARIMA (0,1,2)
-
0.2964
-0.2866
357.08
ARIMA (1,1,1)
-0.3698
0.737
-
358.56
ARIMA (1,1,2)
0.4224
-0.1034
0.4689
358.26
ARIMA (1,1,0)
0.2089
-
-
363.84
model ARIMA (0,1,1) is established, at first. Due to
the high degree of randomness in the observations,
this approach is not rigorous. Similar coefficients are
therefore modelled for comparison. The study relies
on the Akaike Information Criterion (AIC) guidelines
to assist in the determination of coefficients. The
results of these models are shown in Table 1. The
ARIMA (0,1,2) model has the lowest AIC-value of
357.08. The optimal model ARIMA (0,1,2) was
finally established. The two coefficients in the model
are 0.2964 and -0.2688.
3.6 Model Evaluation
Testing for pure randomness on the residual series to
determine whether the model has been complete in
extracting the data. The results showed that the p-
value of the LB statistic was greater than 0.05. The
residual sequence is a white noise sequence. Models
can be used to predict future trends.
3.7 Trend Forecasts
The model was used to predict the birth rate over the
next five years. The projections are shown in Figure
6. The observed and predicted values are very similar.
The predictions are almost always within the range of
the confidence intervals. Projections for the next five
years are almost stable at around 7 per 1,000. The
projections show no upward trend.
Figure 6: Prediction of the Brith Rate (Original).
The projections for the next five years are
specified in the table 2. The table also demonstrates
the 80% confidence intervals.
Table 2: Prediction of the Brith Rate from 2023 to 2027.
Vintage
Predictive
Value
Upper
Limit
Lower Limit
2023
6.61
10.04
3.19
2024
6.94
12.54
1.33
2025
6.94
13.53
0.35
2026
6.94
14.38
-0.51
2027
6.94
15.14
-1.27
Then a new time series is created. Next rebuild the
ARIMA model use to forecast future trends. The
optimal model is also the ARIMA (0,1,2). The two
coefficients in the model are 0.2900 and -0.2933.
Plotting new projections (Figure 7). The projections
for the next five years are also almost stable. The
projections also do not show an upward trend. The
projections for 2021 and 2022 are significantly higher
than the actual values. Predictions are greater than 8
per 1,000.
Figure 7: Another Prediction of the Brith Rate (Original).
Table 3 shows the projections for the next seven
years in contrast to the above projections. The table
also demonstrates the 80% confidence intervals. The
difference between the two predictions is about two
thousandths of a cent.
Forecasts and Analyzes of China’s Birth Rate
69

Table 3: Prediction of the Brith Rate from 2021 to 2027.
Vintag
e
Predictive
Value
Upper
Limit
Lowe
r
Limit
2021
8.15
11.62
4.68
2022
8.72
14.38
3.06
2023
8.72
15.35
2.09
2024
8.72
16.20
1.24
2025
8.72
16.96
0.48
2026
8.72
17.66
-0.21
2027
8.72
18.30
-0.86
Table 4 shows observed and projected values for
2021 and 2022. Predicted values are higher than
observed values. The difference between the two
predictions is about two thousandths of a cent.
Table 4: Prediction of the Brith Rate from 2021 to 2027.
Vintage
Predictive Value
Observed Value
2021
8.15
7.52
2022
8.72
6.77
4 CONCLUSION
The study builds an ARIMA model on the time series
created from 74 data points to predict trends in
fertility, and screen for the optimal model using the
AIC criterion. The ARIMA (0,1,2) model has the
lowest AIC value of 357.08. The model is used to
predict future fertility trends and it is found that the
fertility rate does not show a short-term upward trend.
Birth rates are all below 7 per 1,000 live births for the
next five years. Re-modelling excluding the data
points after the policy change results in a birth rate
above 8 per 1,000 in 2021 and 2022. The projections
for 2021 and 2022 are significantly higher than the
actual values. This result suggests that policy changes
have failed to raise the birth rate. The rate of fertility
decline in China is accelerating. It also shows that
China's social problems have not been solved.
Time series analysis is good at extracting seasonal
and trend information. The analysis of external
factors is not perfect. The reason for the decline in the
birth rate may have been influenced by external
factors, such as new crown pneumonia. For the
impact of policy, this paper also fails to take into
account in the form of variables. For these reasons,
the accuracy of the model may be reduced. It is hoped
that the study will inform policy development and
allow for more accurate modelling in the future.
REFERENCES
J. Y. Zhao and X. Sun, “Age-specific fertility projections
based on combined fertility models,” Statistics and
Decision Making. vol. 13, pp. 102-105, 2015.
Y. B. Wang, S. T. Ma, H. Wang and J. Yuan, “Changes in
fertility levels of women and future population
projections in China,” China Health Statistics, pp. 34,
2017.
A. Yage, “Analysis of China's population projection based
on changes in population fertility policy,” Liaoning
University. 2017.
Y. W. Wang, “Forecasting and analysis of China's two-
child fertility rate based on functional data mode,” East
China Normal University. 2018.
J. L. Xue, “Analysis of world population fertility change
and its influencing factors-And judgement on China's
future fertility,” Journal of Xi'an Finance and
Economics College. Vol. 31(06), pp. 100-106, 2018.
W. X. Zheng, X. Wu and Y. Liu, “Survey research on two-
child birth intention and influencing factors of highly
educated group--Taking a university in Weifang as an
example,” Industry and Technology Forum. vol.
18(24), pp. 88-90, 2019.
M. G. Wang, “Retrospective and predictive study of
fertility in China from 2003 to 2018,” Science News.
Vol. 02, pp. 147, 2020.
X. J. Li, “Estimation, forecasting and analysis of
influencing factors of provincial fertility rate in
China,” Northeast University of Finance and
Economics. 2021.
J. X. Wang, et al. “Research on forecasting based on
machine learning algorithms-An example of
forecasting the number of aged population in China,”
China Information. Vol. 05, pp. 48-49, 2023.
J. Y. Chen, “A study on the population, structure and
influence of family planning policy adjustment,”
Proceedings of the 2016 International Conference on
Education, Sports, Arts and Management Engineering.
2016.
Y. Tao, et al. “The Impact of Population Aging in China
Based on Multiple Linear Regression Mode,” 4th
International Conference on Advanced Education and
Management (ICAEM 2017). 2017.
P. Y. Yan, “Forecast of China's Future Population under
the Universal Two-child Policy,” Proceedings of the
4th Workshop on Advanced Research and Technology
in Industry (WARTIA 2018). 2018.
DAML 2023 - International Conference on Data Analysis and Machine Learning
70
