
Eating Behaviours, Nutritional Status, and Body Composition Among
Nutritional College Students in Indonesia Metropolitan Cities
Desiani Rizki Purwaningtyas
*
, Anna Fitriani and Rony Darmawansyah Alnur
Faculty of Health Sciences, Prof. Dr. Hamka Muhammadiyah University, Limau II Street Kebayoran Baru,
South Jakarta, Indonesia
Keywords: BIA, Eating Behavior, Nutritional Status, Nutrition.
Abstract: There are major changes in youth such as changes in physical, psychological and social orientation that affect
eating behavior. Better nutrition knowledge may lead to positive attitude about eating behavior and forming
proper eating behavior that can impact to nutritional status and body composition. This study used cross
sectional design. The population of this study was nutrition college students in Indonesia metropolitan cities.
Eating behavior was assessed using The Dutch Eating Behavior Questionnaire (DEBQ) (S. It consisted of
three subscales: restrained, emotional, and external eating behavior. Body composition was measured with
bioelectrical impedance analysis (BIA) Omron Karada Scan. The overweight and obese prevalence were
13.2% and 22.9% respectively. The major dominant eating behavior among subjects was external eating. BMI
and some body fatness indicator had negative correlation with external eating and positive correlation with
restrained eating. Skeletal muscle had negative correlation with restrained eating and positive correlation with
external eating.
1 INTRODUCTION
Since 1975 to 2016, worldwide prevalence of obesity
had nearly tripled. In Indonesia the prevalence of
obesity had increased from 15.4% in 2013 to 21.8%
in 2018 (WHO, 2021). The age of 19-24 years was
the starting point for the increase in the prevalence of
obesity before continuing to increase in adulthood
until it reaches a peak at the age of 40-44 years.
Jakarta as one of Indonesia metropolitan cities was
on 2
nd
rank highest obesity prevalence in Indonesia
(Indonesia Ministry of Health, 2019).
Overweight and obesity youth have higher risk
for developing metabolic syndrome. Obesity and
adiposity can be reflected from BMI and body
composition such as body fatness. Higher percentage
of body fat tend to increase risk of metabolic
syndrome among adolescent (Devy, 2018).
Many factors correlate with obesity. Nutritional
intake is one of the direct factors of obesity. Higher
nutritional intake especially macronutrient beyond
the nutritional requirement and energy expenditure
increase risk of obesity (Jaeger, 2022). Eating
behavior affects nutritional intake.
There are major changes in youth such as changes
in physical, psychological and social orientation that
affect eating behavior. They often eat not to meet
their nutritional needs but for pleasure or vice versa,
for some reason they avoid or reduce food intake. A
study on Chilean young adults showed that emotional
eating and cognitive restraint had significant
relationship with higher BMI and body fatness
(Pacheco et al., 2021).
Nutritional knowledge is factor that related with
eating behavior in youth. Better nutrition knowledge
may lead to positive attitude about eating behavior
and forming proper eating behavior. Nutrition college
students should have better nutritional knowledge. A
study of health college students in Indonesia showed
that there was a significant relationship between
nutritional knowledge and eating habits (Djide &
Pebriani, 2023). So, this study aimed to analyse
correlation between eating behavior, nutritional
status, and body composition among nutritional
college students in Indonesia metropolitan cities.
2 METHOD
2.1 Study Design and Population
This study used cross sectional design. The primary
44
Purwaningtyas, D. R., Fitriani, A. and Alnur, R. D.
Eating Behaviours, Nutritional Status, and Body Composition Among Nutritional College Students in Indonesia Metropolitan Cities.
DOI: 10.5220/0012898600004564
In Proceedings of the 5th International Conference on Social Determinants of Health (ICSDH 2023), pages 44-48
ISBN: 978-989-758-727-6; ISSN: 2975-8297
Copyright © 2025 by Paper published under CC license (CC BY-NC-ND 4.0)
data was collected once a time. The population of
this study was nutrition college students in Indonesia
metropolitan cities. The inclusion criteria were 1)
live in Jabodetabek agglomeration area (Jakarta,
Bogor, Depok, Tangerang, and Bekasi); 2) Not in any
low energy, high energy, vegetarian diet, or
ketogenic diet. This research used purposive
sampling technique. 83 subjects were included.
2.2 Measures
2.2.1 Eating Behavior
Eating behavior was assessed using The Dutch
Eating Behavior Questionnaire (DEBQ) (Strien et
al., 1986). It consisted of three subscales: restrained,
emotional, and external eating behavior. There are
10, 13, and 10 questions for restrained, emotional,
and external eating behavior respectively. The
answer was scored 1-5 as follows: never = 1, seldom
= 2, sometimes = 3, often = 4, very often = 5. Each
subject was cateogorized experiencing restrained,
emotional, and external eating if had score more than
50% of total score for each subscale. The dominant
eating behavior was obtained from the highest score
among three subscales.
2.2.2 Nutritional Status and Body
Composition
Body Mass Index (BMI) was used as indicator of
nutritional status. BMI was calculated by formula:
body weight (kg)/square of body height (m). BMI
was categorized into: underweight (BMI < 18.5),
normal (BMI = 18.5-24.9), overweight (BMI = 25-
26.9), and obese (BMI ≥ 27). Body composition
indicators used in this study were percentage of total
body fat, visceral fat, total subcutaneous fat, trunk
subcutaneous fat, total skeletal muscle, and trunk
muscle. Body composition was measured with
bioelectrical impedance analysis (BIA) Omron
Karada Scan.
2.2.3 Data Analyses
Data was analysed using Statistical Package for
Social Sciences (SPSS) version 22. In descriptive
analysis the data was performed as mean (SD) for
normally distributed data and median (interquartile
range/IQR) for skewed data. Prevalence or
proportion of categorized variable was performed as
n (%). Bivariate analysis between eating behavior
with nutritional status and body composition used
Pearson correlation test for normally distributed data
and Spearman correlation test for skewed data.
Analysis of the differences DEBQ question item
between low-normal BMI and high BMI subjects
used independent t-test. Low-normal subjects were
referred to underweight and normal BMI subjects.
High BMI normal subjects were referred to
overweight dan obese subjects.
3 RESULT
The median age of subjects was 19 years old. Most of
subjects were female (96.4%) and stay with their
family in family house. The majority of subjects lived
in South Jakarta. The overweight and obese
prevalence were 13.2% and 22.9% respectively. Cut
off point for normal total body fat is < 30% for female
and < 25% for male. The mean value of total body fat
showed that there were many female subjects who
had normal body fat. The same result was showed by
visceral fat variable. The mean value of visceral fat
was lower than cut off for high visceral fat. So, many
subjects had normal visceral fat. The mean value of
restrained, emotional, and external eating was not
much different although there were more questions to
assess emotional eating (13) than restrained and
external eating (10) (Table 1).
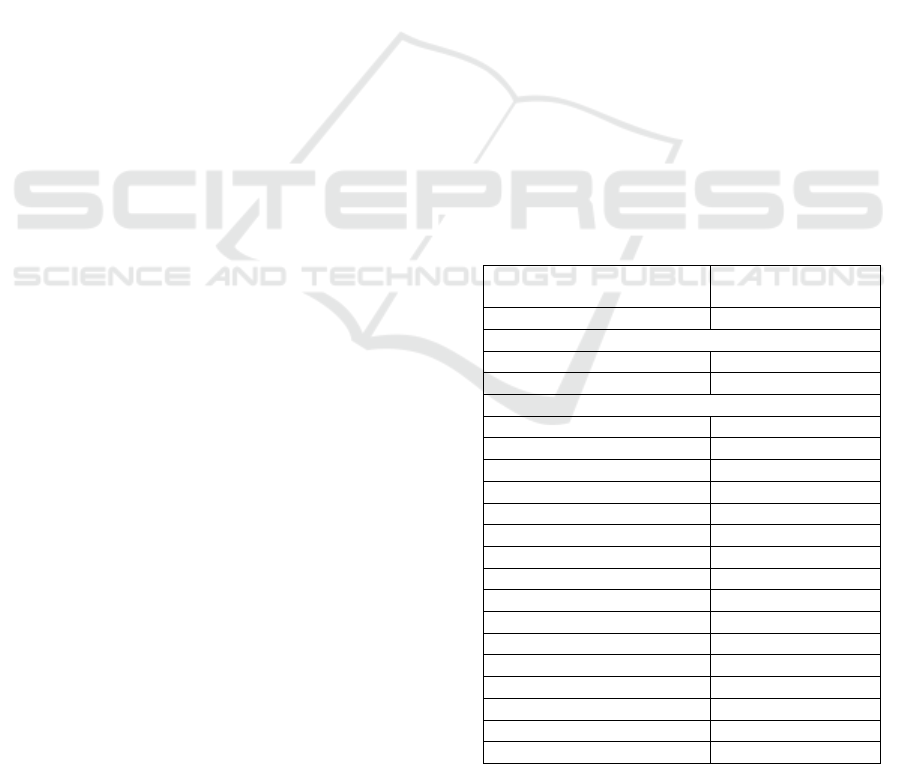
Table 1: Descriptive characteristics of subjects.
Characteristics
Mean (SD), median
(IQR), or n (%)
A
g
e 19
(
1
)
Sex
Male 3
(
3.6%
)
Female 80 (96.4%)
Domicile Status
Boardin
g
house 21
(
25.3%
)
Famil
y
house 62
(
74.7%
)
Nutritional Status
(
BMI
)
21.8
(
8
)
Underweight 16 (19.3%)
Normal 37 (44.6%)
Overweight 11 (13.2%)
Obese 19
(
22.9%
)
Total bod
y
fat
(
%
)
28.9
(
6.2
)
Visceral fat
(
%
)
3
(
6
)
Total subcutaneous fat (%) 24.3 (6.3)
Trunk subcutaneous fat 20.7 (5.9)
Total skeletal muscle
(
%
)
26
(
4
)
Trunk muscle
(
%
)
20.9
(
3
)
Restrained eatin
g
29.2
(
7.6
)
Emotional eating 28.9 (8.8)
External eating 29.8 (5.3)
Subjects categorized experienced restrained,
emotional, and external eating if subjects had score
Eating Behaviours, Nutritional Status, and Body Composition Among Nutritional College Students in Indonesia Metropolitan Cities
45
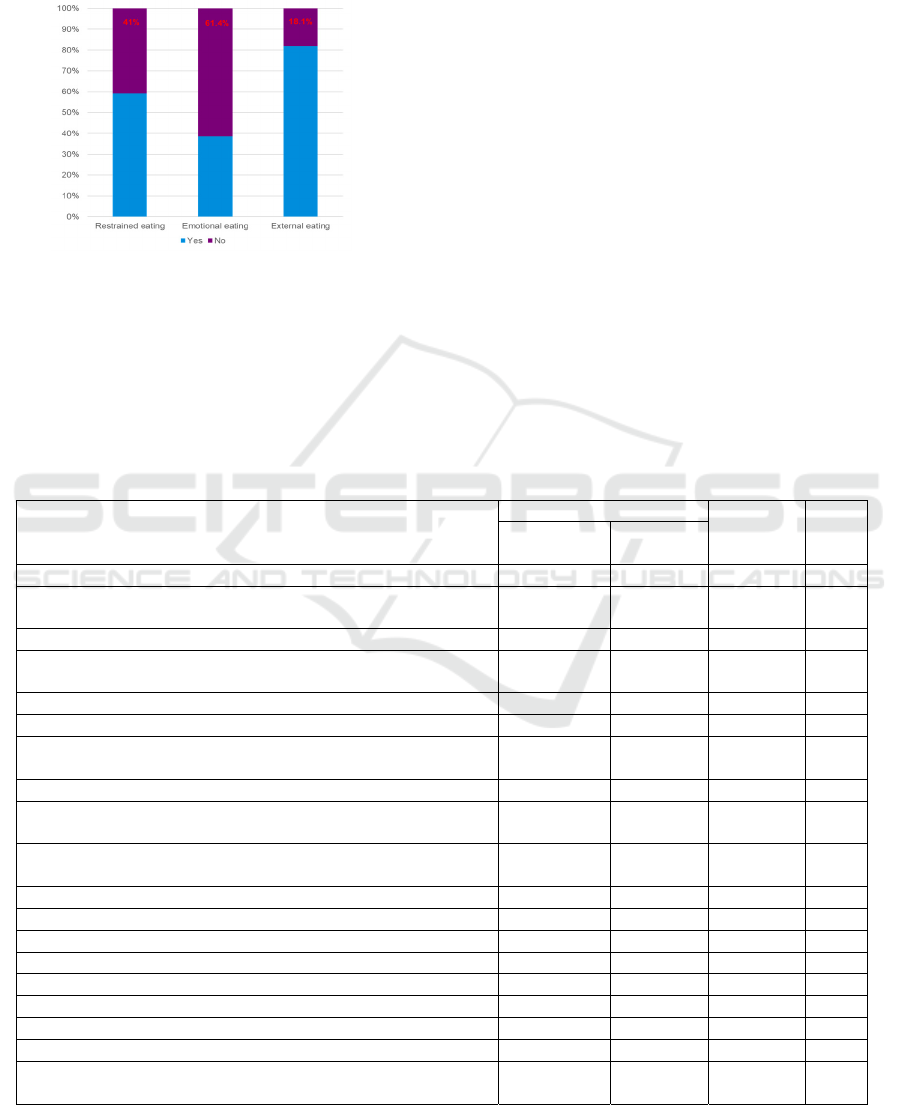
more than 50% of total score for each subscale. More
than half of subjects experienced restrained eating
(59%) and external eating (81.9%) but less frequent
of subjects who had experienced emotional eating
(38.6%).
Figure 1: Proportions of subjects who experienced
restrained, emotional, and external eating.
The descriptive of DEBQ question item based on
nutritional status showed in Table 2. The highest
score on the restrained eating subscale indicated that
subjects exactly watched what they ate. Subjects with
low-normal BMI were significantly more likely to
look at what they ate than subjects with high BMI.
However, almost for all the other question items on
the restrained eating subscale indicated that subjects
with high BMI were significantly more likely to did
restrained eating item. Different things are found on
the emotional eating subscale. A significant
difference between subjects with high BMI and low-
normal BMI was only found in one question item.
Low-normal BMI subjects significantly had more
desire to eat when nothing to do than high BMI
subjects. Emotional eating behavior that’s most
frequent carried out by subjects was desire to eat
when bored or restless. Meanwhile, the external
eating behavior that’s most frequent carried out by
subjects was eat more usual if food taste good.
Compare to high BMI subjects, low-normal BMI
subjects were significantly more often to eat more
than usual if food taste good. They also ate their
delicious food straight away more frequently than
high BMI subjects.
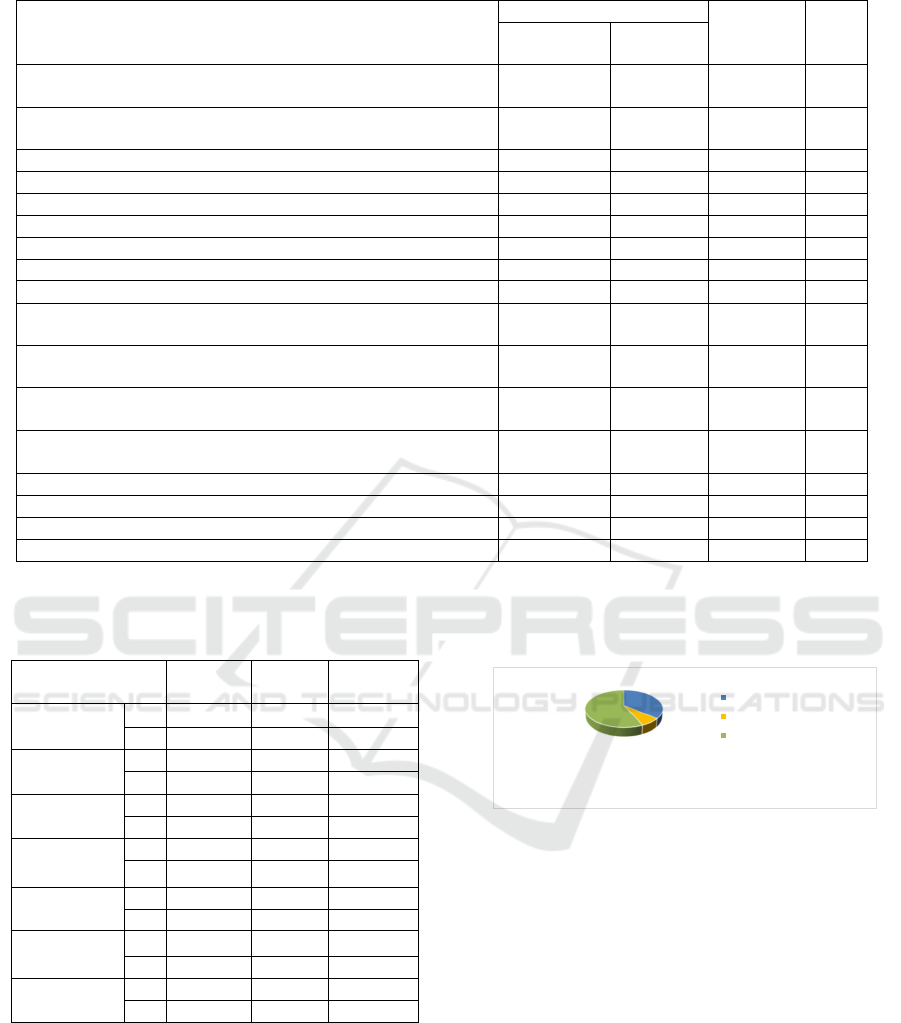
The dominant eating behavior for each subject
was obtained from the highest score among subscale
(restrained, emotional, or external eating). The major
dominant eating behavior among subjects was
external eating (Figure 2).
Table 2: The differences DEBQ question item based on nutritional status.
Question Items
Nutritional Status
Total P
Low-Normal
BMI
High BMI
Restrained eatin
g
When you have put on weight, do you eat less than you usually
do?
2.66 (1.1) 3.4 (0.8) 2.93 (1.1) 0.009
Do you try to eat less at mealtimes than you would like to eat? 2.72 (1.0) 3.53 (0.8) 3.01 (1.0) 0.000
How often do you refuse food or drink offered because you are
concerne
d
about
y
our wei
g
ht?
2.06 (1.0) 2.93 (1.0) 2.37 (1.1) 0.000
Do you watch exactly what you eat? 3.34 (0.9) 2.80 (1.2) 3.14 (1.0) 0.032
Do you deliberately eat foods that are slimming? 1.60 (0.9) 2.24 (1.1) 1.83 (1.0) 0.003
When you have eaten too much, do you eat less than usual the
following day?
2.58 (1.2) 3.07 (1.0) 2.76 (1.2) 0.056
Do you deliberately eat less in order not to become heavier? 2.53 (1.3) 3.2 (1.1) 2.77 (1.2) 0.008
How often do you try not to eat between meals because you are
watchin
g
y
our wei
g
ht?
1.94 (1.1) 2.7 (1.0) 2.22 (1.1) 0.001
How often in the evenings do you try not to eat because you are
watching your weight?
2.21` (1.2) 3.23 (1.0) 2.58 (1.2) 0.000
Do
y
ou take into account
y
our wei
g
ht with what
y
ou eat? 2.87
(
1.2
)
3.2
(
1.1
)
3
(
1.2
)
0.158
Emotional eating
Do you have the desire to eat when you are irritated? 2.76 (1.3) 2.37 (1.1) 2.61 (1.3) 0.200
Do you have the desire to eat when you are discouraged? 2.28 (1.1) 2.5 (1.2) 2.36 (1.2) 0.456
Do you have the desire to eat when you have nothing to do? 3.28 (1.2) 2.77 (1.2) 3.10 (1.2) 0.049
Do you have the desire to eat when you are feeling lonely? 2.81 (1.3) 2.47 (1.2) 2.69 (1.2) 0.206
Do
y
ou have the desire to eat when somebod
y
lets
y
ou down? 1.89
(
0.8
)
1.9
(
1.0
)
1.89
(
0.9
)
0.800
Do you have the desire to eat when you are cross? 2.38 (1.1) 1.97 (1.1) 2.23 (1.1) 0.097
Do you have the desire to eat when you are approaching
something unpleasant to happen?
1.96 (1.1) 2.0 (1.2) 1.99 (1.1) 0.976
ICSDH 2023 - The International Conference on Social Determinants of Health
46
Question Items
Nutritional Status
Total P
Low-Normal
BMI
High BMI
Do you have the desire to eat when you are anxious, worries, or
tense?
1.38 (0.6) 1.67 (0.8) 1.48 (0.7) 0.106
Do you have the desire to eat when things are going against you
or when thin
g
s have
g
one wron
g
?
1.62 (0.7) 1.93 (1.0) 1.73 (0.8) 0.198
Do you have the desire to eat when you are frightened? 1.53 (0.6) 1.63 (0.8) 1.57 (0.7) 0.778
Do you have the desire to eat when you are disappointed? 1.81 (1.0) 2.07 (1.1) 1.90 (1.0) 0.314
Do you have the desire to eat when you are emotionally upset? 1.94 (1.1) 2 (1.0) 1.96 (1.1) 0.801
Do you have the desire to eat when you are bored or restless? 3.53 (1.3) 3.07 (1.2) 3.36 (1.3) 0.083
External Eating
If food tastes
g
ood to
y
ou, do
y
ou eat more than usual? 3.94
(
1.0
)
3.4
(
0.9
)
3.75
(
1.0
)
0.012
If food smells and looks good, do you eat more than usual? 3.47 (1.0) 3.13 (0.8) 3.35 (0.9) 0.092
If you see or smell something delicious, do you have a desire to
eat it?
3.79 (0.9) 3.5 (0.8) 3.69 (0.9) 0.118
If you have something delicious to eat, do you eat it straight
awa
y
?
3.75 (1.0) 3.3 (0.9) 3.59 (1.0) 0.034
If you walk past the baker do you have the desire to buy
something delicious?
3.19 (1.2) 2.7 (1.1) 3.01 (1.2) 0.059
If you walk past a snack bar or a cafe, do you have the desire to
b
uy something delicious?
2.91 (1.2) 2.5 (1.0) 2.76 (1.2) 0.103
If you see others eating, do you also have the desire to eat? 2.6 (1.1) 2.37 (1.0) 2.52 (1.1) 0.300
Can you resist eating delicious foods? 2.32 (1.1) 2.7 (1.0) 2.46 (1.1) 0.082
Do
y
ou eat more than usual, when
y
ou see others eatin
g
? 2.13
(
1.0
)
2.17
(
0.9
)
2.14
(
0.9
)
0.764
When preparing a meal are you inclined to eat something? 2.43 (1.0) 2.67 (1.0) 2.52 (1.0) 0.265
Table 3: Correlation between eating behavior, nutritional
status, and body composition.
Variable
Restrained
eating
Emotional
eating
External
eating
BMI P
0.000 0.194 0.01
r
0.504 -0.144 -0.352
Total body fat P
0.141 0.136 0.009
r
0.163 0.165 -0.285
Visceral fat P
0.000 0.113 0.001
r
0.458 -0.175 -0.353
Total
subcutaneous fat
P
0.003 0.440 0.271
r
0.323 0.086 -0.122
Trunk
subcutaneous fat
P
0.002 0.427 0.112
r
0.335 0.088 -0.176
Total skeletal
muscle
P
0.015 0.323 0.830
r
-0.267 -0.110 -0.024
Trunk muscle P
0.044 0.687 0.028
r
-0.221 -0.045 0.242
The correlation between eating behavior with
nutritional status, and body composition was showed
by Table 3. BMI had a significant positive correlation
with restrained eating and a significant negative
relationship with external eating. Total body fat and
visceral fat had significant negative correlation with
external eating. Visceral fat, total subcutaneous fat,
and trunk subcutaneous fat correlated significant
positively with restrained eating. In contrast,
percentage of total skeletal muscle and trunk muscle
had significant negative correlation with restrained
eating.
Figure 2: The dominant eating behavior.
4 DISCUSSION
The overweight prevalence in this study was slightly
lower than the national overweight prevalence in
Indonesia. But, obese prevalence in this study was
slightly higher than the national obese prevalence in
Indonesia based on Basic Health Research (Indonesia
Ministry of Health, 2019).
5 CONCLUSIONS
A higher BMI –and particularly a higher fat mass and
lower muscle mass - at adolescence age especially
36,2%
7,2%
56,6%
Restrained eating
Emotional eating
External eating
Eating Behaviours, Nutritional Status, and Body Composition Among Nutritional College Students in Indonesia Metropolitan Cities
47

among nutrition college students predicted less food
approaching and more food avoidant behaviors
Improving nutritional knowledge is important to
improve eating behavior among adolescents
especially prevent emotional and external eating as
well as increasing restrained eating in obesity
adolescents.
ACKNOWLEDGEMENTS
Thanks to research institution of Prof. Dr. Hamka
Muhammadiyah University who had funded this
research.
REFERENCES
Devy, D.R. 2018. Risk factors of metabolic syndrome in
obese adolescents: foucs on body fat. Jakarta:
University of Indonesia.
Djide, N.A.N, Pebriani, R. 2023. Nutritional knowledge
and eating habits of college students. Media Kesehatan
Politeknik Kesehatan Masyarakat XVIII; 01: 112-118.
Indonesia Ministry of Health. 2019. Basic Health Research.
Jakarta: Indonesia Ministry of Health.
Jaeger, V., Koletzko, B., Luque, V., Gispert-Llauradó, M.,
Gruszfeld, D., Socha, P., Verduci, E., Zuccotti, G.V.,
Etienne, L., Grote, V. 2022. Time of dietary energy and
nutrient intake and body mass index in children:
compositional data analysis from the Childhood
Obesity Project (CHOP) Trial. Nutrients 2022, 14,
4356. https://doi.org/10.3390/ nu14204356.
Pacheco, L.S., Blanco, E., Burrows, R., Burrows, P.C.,
Santos, J.L., Gahagan, S. 2021. Eating behavior and
body composition in chilean young adults. Appetite.
2021 January 01; 156: 104857.
doi:10.1016/j.appet.2020.104857.
WHO. 2021. Overweight and Obesity.
https://www.who.int/news-room/fact-
sheets/detail/obesity-and-overweight.
ICSDH 2023 - The International Conference on Social Determinants of Health
48
