
The Relationship Between Energy Intake, Macro Nutrition, and
Other Factors with the Incidence of Obesity in Students of Senior
High School 11 South Tangerang
Sri Laksmi Fitriyani
and Nunung Cipta Dainy
Faculty of Medicine and Health, University of Muhammadiyah Jakarta, Central Jakarta, Indonesia
Keywords: Adolescents, Nutrient Intake, Obesity.
Abstract: The prevalence of obesity in South Tangerang is quite high at 15.9%. Factors causing obesity in adolescents
are excessive macronutrient intake, increased consumption of junk food, decreased physical activity, and lack
of nutrition knowledge. This study aims to analyze the relationship between energy intake, macronutrients
and other factors with the incidence of obesity in students of SMAN 11 South Tangerang. This study used
Cross Sectional design with a Random Sampling Techniqueand obtained 66 samples of X and XI grade
students of SMAN 11 South Tangerang. Data were collected by 24-hour recall interview, distribution of
nutritional knowledge questionnaire, FFQ (Food Frequency Questionnaire),and IPAQ (International Physical
Activity Questionnaire), and measurement of height and weight. Bivariate data analysis using Chi-Square
test. Students of SMAN 11 South Tangerang were obese as much as 24.2%. The results of the relationship
test with obesity obtained energy intake (p=0.563), protein intake (p=0.462), fat intake (p=0.202),
carbohydrate intake (p=0.143), junk food consumption (p=572), nutritional knowledge (p=0.712), and
physical activity (p=0.002). The conclusion is that there is no relationship between energy intake,
macronutrient intake, junk food consumption, and nutritional knowledge with the incidence of obesity in
students of SMAN 11 South Tangerang with a P>0.05. There is a relationship between physical activity and
the incidence of obesity in students of SMAN 11 South Tangerang with a p-value of (>0.05).
1 INTRODUCTION
Nutritional status is a condition caused by a balance
between intake of nutrients from food and the body's
need for nutrients. Obesity is an indicator of
nutritional status where the intake of nutrients from
food consumed exceeds the nutrients needed by the
body. Obesity occurs due to excessive accumulation
of fat due to an imbalance between energy intake and
energy used for a long time. The problem of obesity
has become a big problem in Indonesia. Obesity in
adolescents can continue into adulthood because it is
a serious problem(Telisa, Hartati, & Haripamilu,
2020). Based on data from the 2018 Riskesdas, there
is a prevalence of obesity or overweight in
adolescents aged 13-15 years, namely 16.0% and in
adolescents aged 16-18 years, namely 13.5%. Banten
Province is one of the provinces with a prevalence
rate of obesity in adolescents above the Indonesian
national average, which is 22.1%. South Tangerang is
one of the cities in Banten Province which has a high
prevalence of obesity, which is 15.9%.
Lifestyle changes are currently occurring in
society, especially among adolescents in the form of
decreased physical activity and changes in eating
patterns that can cause nutritional status instability,
namely increased body weight. Other factors that can
cause obesity in adolescents include excessive intake
of macronutrients, increased consumption of junk
food, age and gender(Telisa et al., 2020). In addition,
the level of knowledge of adolescents is also one of
the factors that cause obesity(A. Dewi et al., 2023).
Factors such as decreased physical activity, excessive
intake of macronutrients, increased consumption of
junk food, and this level of nutritional knowledge, if
carried out in a sustainable manner, can lead to the
risk of obesity. Adolescents who are obese and who
are not treated until adulthood can increase the risk of
metabolic diseases and non-communicable diseases
(NCDs) such as coronary heart disease, hypertension,
stroke, cholesterol, and diabetes mellitus(Suha &
Rosyada, 2022).
According to research conducted by Sembiring
(2022), there is a relationship between physical
activity and obesity in adolescents at Cerdas Bangsa
Fitriyani, S. L. and Dainy, N. C.
The Relationship Between Energy Intake, Macro Nutrition, and Other Factors with the Incidence of Obesity in Students of Senior High School 11 South Tangerang.
DOI: 10.5220/0012919900004564
In Proceedings of the 5th International Conference on Social Determinants of Health (ICSDH 2023), pages 225-231
ISBN: 978-989-758-727-6; ISSN: 2975-8297
Copyright © 2025 by Paper published under CC license (CC BY-NC-ND 4.0)
225
Private High School, Deli Tua District, Deli Serdang
Regency, Medan with a p-value of 0.021(Sembiring,
Rosdewi, & Yuningrum, 2022). Research conducted
by Telisa (2020), shows that factors that are
significantly related and become risk factors for
obesity in adolescents are energy, protein, fat, and
carbohydrate intake, fast food consumption, and
physical activity(Telisa et al., 2020).
According to research conducted by Dewi, et al
(2023), there is a relationship between diet, level of
knowledge, and consumption of fast food with the
incidence of obesity with the results of 67.1% of
students experiencing obesity, 71.1% of students
experiencing poor diet, 67.1% of students
experiencing a low level of knowledge, and 57.8% of
students choosing fast food consumption(A. Dewi et
al., 2023).
The researcher chose the research location at
SMAN 11 South Tangerang because it is located in
an urban area, there has never been any previous
research, and the survey results can describe many
students who have obesity nutritional status. Based on
previous studies which stated that there are many
factors that cause obesity in adolescents and see the
prevalence rate of obesity in South Tangerang is quite
high. This study aims to determine the relationship
between energy intake, intake of macronutrients
(protein, fat, and carbohydrates), consumption of
junk food, physical activity, and knowledge of
nutrition with the incidence of obesity.
2 METHODS
This research is a type of observational research with
a cross-sectional research design. The population in
this study were all students of class X and XI at
SMAN 11 South Tangerang with a total of 783
students who met the inclusion and exclusion criteria.
Samples were taken using the Simple Random
Sampling technique with a hypothesis testing formula
with a population proportion approach of 2
(Lemeshow, 1997) and a total sample of 66 was
obtained.This research has obtained ethical eligibility
and has been approved by the KEPK FKK-UMJ.
The instrument testing in this study, namely:
a. Body weight was obtained by measuring using
standard The scales with an accuracy of 0.1. The
scales were placed on a flat floor, and the
respondents who were weighed did not use
footwear. Body height was obtained by
measuring using a microtoise that was attached
to the wall with a height of 2 meters from the
floor (accuracy 0.1).The respondents were
measured in an upright standing position with
their shoulders and heels against the wall and
did not use footwear. Then the data obtained is
calculated using the BMI formula to determine
a person's nutritional status.
b. In terms of energy intake and intake of
macronutrients, researchers and enumerators
with a background in nutrition education
conducted 2x24 hour recall interviews with
respondents by asking what food and drink they
had consumed the previous day. This 1x24 hour
recall is carried out 2 times on different days.
c. For the consumption of junk food, researchers
used a modified FFQ (Food Frequency
Questionnaire) questionnaire(Irawan, 2022)
and(Arifin, 2019).
d. In measuring physical activity, researchers used
a questionnaire regarding physical activity or
what activities were carried out during the last 7
days using a questionnaire(IPAQ., 2004)short
form version.
e. In terms of nutritional knowledge, researchers
used a questionnaire regarding knowledge of
balanced nutrition that had been tested for
validity and reliability tests.
Data analysis was performed using the SPSS
application to obtain univariate and bivariate analysis
test results. Bivariate analysis in this study was the
relationship between energy intake, protein intake, fat
intake, carbohydrate intake, consumption of junk
food, physical activity, and knowledge of nutrition
with the incidence of obesity using the Chi-Square
Test.
3 RESULTS
3.1 Overview of Respondent
Characteristics
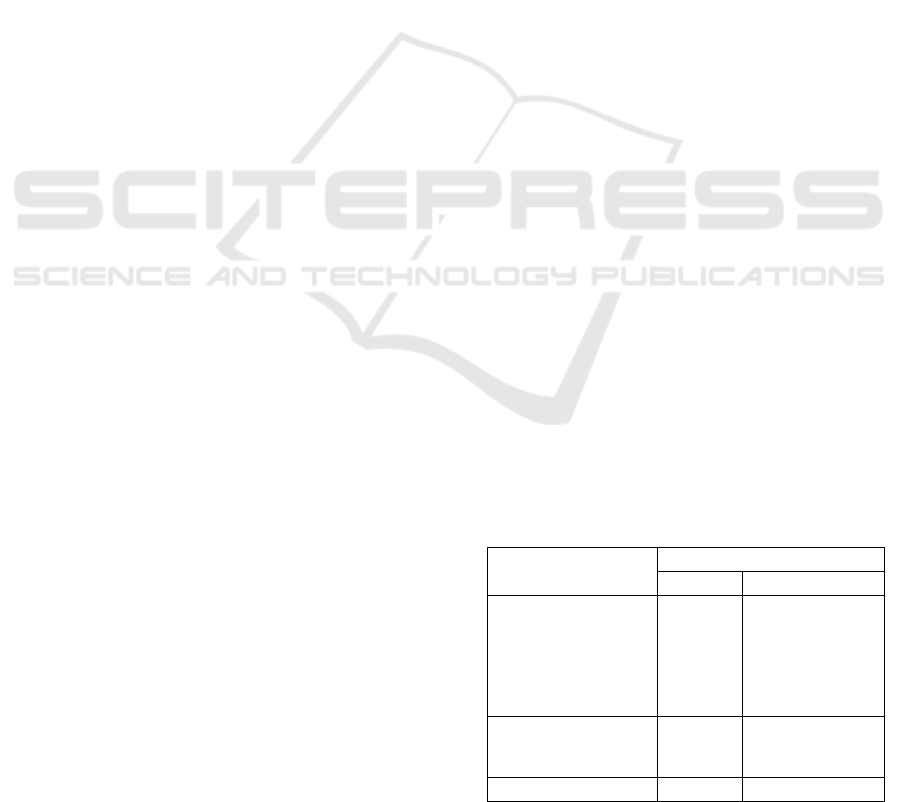
Table 1: Characteristics of Respondents.
Characteristics
Amount
n %
A
g
e
15 years
16 years
17 years
18 years
19
y
ears ol
d
4
27
30
4
1
6,1
40,9
45.5
6,1
1.5
Gender
Man
Woman
17
49
25,8
74,2
Total 66 100.0%
ICSDH 2023 - The International Conference on Social Determinants of Health
226
This research was conducted on 66 students of
SMAN 11 South Tangerang, which consisted of
students in class X and class XI. Based on Table 1,
most of the age of the respondents in this study were
16 and 17 years old. The gender characteristics of the
respondents were mostly female (74.2%), while
25.8% were male.
3.2 Univariate Analysis Results
Obesity is one of the health problems of adolescent
nutritional status. To find out, it can be calculated
using a z-score by looking at the age, gender, weight
and height of the student. To find out the distribution
data of the variable description, it can be seen in the
table below.
Table 2: Distribution of Respondents Based on Research
Variables.
Variable Category
Amount
n %
Nutritional
status
Obesity (BMI/U > +2SD)
Not Obese (BMI/U ≤
+2SD)
16
50
24,2
75.8
Total 66 100.0
Energy
Intake
More (>110% AKG)
Enough (80-110% RDA)
Less (<80% DDA)
1
8
57
1.5
12,1
86.4
Total 66 100.0
Protein
Intake
More (>110% AKG)
Enough (80-110% RDA)
Less (<80% DDA)
6
11
49
9,1
16,7
74,2
Total 66 100.0
Fat Intake
More (>30% AKE)
Enough (20-30% AKE)
Less (<20% AKE)
6
20
40
9,1
30,3
60,6
Total 66 100.0
Carbohydr
ate Intake
Enough (80-110% RDA)
Less (<80% DDA)
3
63
4,5
95.5
Total 66 100.0
Consumpti
on of Junk
Foo
d
Often (≥26.34)
Rarely (<26.34)
34
32
51.5
48.5
Total 66 100.0
Physical
Activity
Low (<600 METs)
Moderate (≥600
METs)
High (≥3000 METs)
13
45
8
19,7
68,2
12,1
Total 66 100.0
Nutrition
Knowledge
Less (<60%)
Enough (60-75%)
Good (>75%)
12
26
28
18,2
39,4
42,4
Total 66 100.0
Based on the research results obtained in Table 2,
there were 24.2% of respondents in the obese
nutritional status category. This figure far exceeds the
prevalence of obesity in South Tangerang, which is
15.9%.(Ministry of Health RI Banten, 2013).
According to WHO (2018) the prevalence of obesity
in adolescents has increased to 18%.
Respondents' intake of energy and macronutrients
was calculated based on the results of a 24-hour food
recall interview and compared with the AKG
(Nutrition Adequacy Rate)(Kemenkes, 2019). Based
on the results obtained in Table 2, it can be seen that
most of the respondents received energy, protein, fat
and carbohydrate intake which were categorized as
lacking (respectively: 86.4%; 74.2%; 60.6%; 95.5%).
The habit of consuming junk food is categorized
into rarely and often by using the cut off point in the
form of the mean from the distribution of the
respondent's data as was done by(Arifin, 2019).From
the results of the data in Table 2, it can be seen that
the consumption of junk food in the frequent category
is 51.5%.
Respondents' physical activity was obtained using
MET calculations and divided into three categories,
namely low/inactive (<600 MET minutes/week),
moderate/minimum active (≥600 MET
minutes/week), and high/active HEPA (≥3000 MET
minutes /Sunday). Data on the distribution of physical
activity can be seen in Table 2. It was found that some
respondents had moderate physical activity (68.2%).
There are respondents with low activity as much as
19.7% and high activity as much as 12.1%.
Respondents' nutritional knowledge was obtained
by filling out a nutritional knowledge questionnaire.
Based on Table 2, it can be seen that most of the
respondents have good nutrition knowledge (42.4%).
However, there are still respondents who have less
nutritional knowledge, namely as much as 18.2%.
3.3 Results of Bivariate Analysis
In this study, bivariate analysis was used to see if
there was a significant relationship between the
dependent variable (obesity) and the independent
variables (energy intake, intake of macronutrients,
physical activity, consumption of junk food, and
knowledge of nutrition). In this bivariate analysis, the
data were processed using the chi-square test with a
significance limit of α = 0.05. If the p-value <0.05 it
can be concluded that there is a relationship between
the two variables.
The Relationship Between Energy Intake, Macro Nutrition, and Other Factors with the Incidence of Obesity in Students of Senior High
School 11 South Tangerang
227

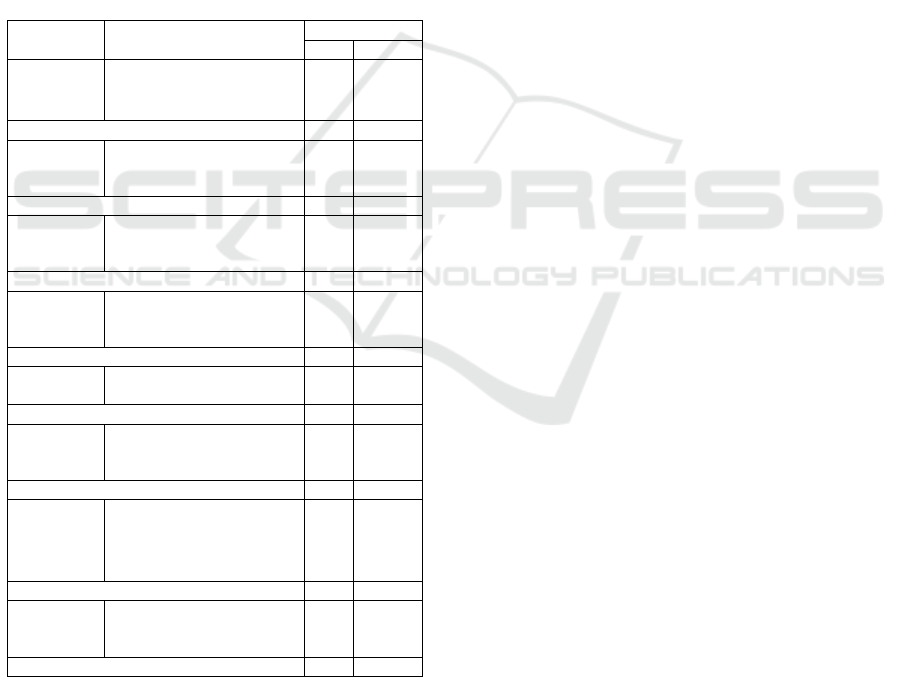
Table 3: The results of the relationship test between the
independent variables and obesity.
Varia bl e
Nutritional Status Total
P-value
Obesity Not Obese
n % n % n %
Ener
gy
Intake
More
(>110%
AKG
)
0 0.0 1 100 1 100
0.563
Enough
(80-110%
RDA
)
3 37.5 5 62.5 8 100
Less
(<80%
DDA)
13 22.8 44 77.2 57 100
Total 16 24.2 50 75.8 66 100
Protein Intake
More
(>110%
AKG
)
2 33.3 4 66.7 6 100
0.462
Enough
(80-110%
RDA
)
4 36.4 7 63.6 11 100
Less
(<80%
DDA)
10 20.4 39 79.6 49 100
Total 16 24.2 50 75.8 66 100
Fat intake
More
(>30%)
2 33.3 4 66.7 6 100
0.202
Enough
(
20-30%
)
2 10.0 18 90.0 20 100
Less
(
<20%
)
12 30.0 28 70.0 40 100
Total 16 24.2 50 75.8 66 100
Carbohydrate intake
Enough
(80-110%
RDA)
2 66.7 1 33.3 3 100
0.143
Less
(<80%
DDA)
14 22.2 49 77.8 63 100
Total 16 24.2 50 75.8 66 100
Junk food Consum
p
tion
Often
(
≥26.34
)
9 26.5 25 73.5 34 100
0.442
Rarely
(<26.34)
7 21.9 25 78.1 32 100
Total 16 24.2 50 75.8 66 100
Ph
y
sical Activit
y
Low
(<600
METs
)
8 61.5 5 38.5 13 100
0.002*
Moderate
(≥600
METs
)
7 15.6 38 84.4 45 100
High
(≥3000
METs)
1 12.5 7 87.5 8 100
Total 16 24.2 50 75.8 66 100
Nutrition Knowledge
Not
enough
4 33.3 8 66.7 12 100
0.712
Enough 6 23.1 20 76.9 26 100
Goo
d
6 21.4 22 78.6 28 100
Total 16 24.2 50 75.8 66 100
*Significant at α<0.05
3.3.1 Relationship of Energy Intake with
Obesity
Based on the results of the bivariate test in Table 3, it
shows that there is no significant relationship between
energy intake and the incidence of obesity with a p-
value >0.05. All respondents with more, sufficient, or
less energy intake categories have the same
proportion of obese and not obese.
3.3.2 Relationship of Macronutrient Intake
with Obesity
Based on Table 3, the results of statistical tests show
that there is no significant relationship between the
variables of protein, fat and carbohydrate intake and
the incidence of obesity in adolescents with a p-value
>0.05. The distribution of the data shows that all
respondents in the category of more, sufficient, or less
protein and fat intake have the same proportion of
obese and non-obese.
In contrast to protein and fat intake, the
distribution of data on carbohydrate intake shows that
respondents with sufficient intake have a higher
tendency to be obese compared to respondents who
have less carbohydrate intake. However, the results of
the chi-square test showed that the p-value was 0.143
(P>0.05), which means that there was no significant
relationship between carbohydrate intake and the
incidence of obesity in adolescents.
3.3.3 Relationship Between Junk Food
Consumption and Obesity
Based on the results of the bivariate test in Table 3, it
shows that there is no significant relationship between
the variable consumption of junk food and the
incidence of obesity with a P>0.05. All respondents
in the category of frequent or infrequent consumption
of junk food had the same proportion of obesity and
non-obesity.
ICSDH 2023 - The International Conference on Social Determinants of Health
228

3.3.4 Relationship of Physical Activity with
Obesity
The statistical test results obtained a p-value of 0.002
(P<0.05), so there is a significant relationship
between physical activity and obesity. Based on the
data distribution in Table 3, it can be seen that most
of the respondents with low physical activity category
were obese (61.5%), while most of the respondents
with moderate and severe physical activity had
nutritional status not obese (respectively: 84.4 %;
87.5%).
3.3.5 Relationship of Nutrition Knowledge
with Obesity
Based on Table 3, the results of the statistical test
obtained a p-value of 0.712 (P>0.05), which means
that there is no significant relationship between
nutritional knowledge and obesity in adolescents. The
distribution of the data shows that respondents with
poor, sufficient, and good nutrition knowledge
categories have the same proportion of obesity and
non-obesity.
4 DISCUSSIONS
4.1 Relationship of Energy and
Macronutrient Intake with Obesity
Energy intake is not related to obesity, these results
are in line with Fridawanti's research (2016) which
states that there is no relationship between energy
intake and obesity. Based on the results of 2x24 hour
food recall interviews with respondents, it shows that
respondents consumed food in small quantities and
types and had irregular eating patterns (eating 1 to 2
times a day), eating small portions, and the food
consumed was not varied. thus affecting the amount
of energy consumed. This is in accordance with the
respondents in Fridawanti's study (2016) which
showed that the food consumed by respondents in
their daily lives was lacking and not in accordance
with the RDA (Nutritional Adequacy Rate)
(Fridawanti, 2016).
Protein intake is not related to obesity, the results
of data on the distribution of protein intake are in line
with research conducted by Rahmani and Dewi
(2018) which shows that there is no significant
relationship between protein intake and obesity. This
is evidenced by the p-value obtained, namely 0.120
(>0.05). It is also similar to Pramono's research
(2015) which states that there is no relationship
between protein intake and the incidence of obesity
with a p value = 0.32 (>0.05). If energy intake is
lacking for various reasons, protein intake will be
used to meet energy needs, so that there is not enough
protein available for the formation of new tissue or
for repairing damaged tissue. Aside from being a
source of energy, protein also has a function that
cannot be replaced by other nutrients. which builds
and maintains the cells of the body's tissues. Protein
also functions to regulate fluid balance, maintain
body neutrality, form antibodies and also transport
nutrients(Pramono Dwi Sasmito, 2015).
Fat intake is not related to obesity, the results of
data on the distribution of fat intake are in line with
Praditasari's research (2018) which states that there is
no relationship between fat intake and obesity with a
p value = 0.240 (>0.05). Fat intake is not associated
with obesity status in adolescents, but the
contribution of fat to the RDA which is higher allows
obesity to occur. Food intake is one of the factors that
causes obesity, but besides fat intake, there are
intakes of carbohydrates, protein, water consumption,
and other micronutrients that can also cause obesity.
In addition to fatty acid composition, overweight and
obesity can be affected by the energy balance in the
body. In addition, food intake and energy expenditure
can be influenced by diet, hereditary
history(Praditasari & Sumarmik, 2018).
This research is not in line with Ainun (2022)
which states that there is a significant relationship
between fat intake and obesity, this is evidenced by
the p value <0.05, namely p = 0.0001. Excessive fat
intake over a long period of time can lead to obesity.
Accumulation of fat in the body will be stored in
adipose tissue which can cause obesity if it occurs
continuously(Ainun, 2022).
Carbohydrate intake is not related to obesity, the
results of the distribution of carbohydrate intake data
are in line with research conducted by Ainun (2022),
namely there is no relationship between carbohydrate
intake and obesity in adolescents with a p-value of
0.06 (>0.05). Excess carbohydrate intake will be
stored in muscle or fat. Excessive carbohydrate intake
in adolescents can increase insulin secretion, increase
fat storage, and increase serum triglyceride levels.
This will cause obesity if allowed to accumulate for a
long time(Ainun, 2022). It is also similar to the
research conducted by Pramono (2015) which states
that there is no relationship between carbohydrate
intake and the incidence of obesity. Adequate intake
is important to maintain the glycogen reserves
required for long-term physical activity. An increase
in muscle glycogen with the accumulation of
The Relationship Between Energy Intake, Macro Nutrition, and Other Factors with the Incidence of Obesity in Students of Senior High
School 11 South Tangerang
229

carbohydrates will increase stamina for 30-60
minutes longer(Pramono Dwi Sasmito, 2015).
4.2 Relationship Between Junk Food
Consumption and Obesity
Consumption of junk food is not related to obesity,
the results of this analysis test are in line with research
conducted by Indriawati and Soraya (2009) which
states that there is no significant relationship between
the frequency of consumption of junk food and
obesity with P>0.05(Indriawati & Soraya, 2009).
This research is not in line with research conducted
by Nugroho and Hikmah (2020) which states that
there is a significant relationship between the
frequency of consumption of junk food and the
incidence of obesity in adolescents with a p-value of
0.001 (<0.05)(Nugroho & Hikmah, 2020).
This happens because with the advancement of
technology, teenagers can find various kinds of
information, one of which is from social media. The
effects of using social media are various, one of
which is that many teenagers follow the trend that is
circulating. Junk food is one of the trends that is
usually followed by teenagers, because the marketing
of junk food on social media is quite extensive. The
rise of junk food marketing makes teenagers have a
high sense of curiosity to try these junk food products,
so that every time there is a new type of junk food,
teenagers have the desire to try it without thinking
about the impact or effects of frequent consumption
of junk food. Frequent consumption of junk food can
increase fat in the body which is not balanced, thus
increasing degenerative diseases(Tanjung et al.,
2022).
4.3 Relationship of Physical Activity
with Obesity
Physical activity is associated with the incidence of
obesity, this is in line with research conducted by
Ayu, Paramita, and Indonesiani et al. (2023) that there
is a significant relationship between physical activity
and the incidence of obesity in adolescents at SMAN
4 Denpasar with a p-value (<0.05)(Ayu, Paramita,
Indonesiani, & Gede, 2023). Similar to the research
conducted by Prima et al. (2018) which shows that
there is a relationship between physical activity and
the incidence of obesity in adolescents. This happens
because most adolescents who are obese do less
physical activity or do more light physical activity at
higher risk of developing obesity due to lack of
energy expenditure. Sedentary behavior in
adolescents is a strong risk factor for obese
adolescents(Mahasiswa, Biomedis, Prima, Andayani,
& Abdullah, 2018).
4.4 Relationship of Nutritional
Knowledge with Obesity
Nutritional knowledge is not related to obesity, this
result is in line with research conducted by Dewi and
Kartini (2017) which states that there is no
relationship between nutritional knowledge and the
incidence of obesity with a p-value of 0.076 (>0.05).
Nutritional knowledge is an indirect factor that can
affect a person's nutritional status, so if there is no
relationship between nutritional knowledge and the
incidence of obesity, then this can be influenced by
the direct factor, namely food consumption(P. L. P.
Dewi & Kartini, 2017).
This research is not in line with the research
conducted by Sineke et al. (2019) to students of SMK
Negeri 1 Biaro which stated that there was a very
strong relationship between the level of nutritional
knowledge and the incidence of obesity in students
with a p value = 0.042 (P<0.05) (Sineke, Kawulusan,
Purba, & Dolang, 2019).
5 CONCLUSIONS
Students of SMAN 11 South Tangerang have a
nutritional status of obesity as much as 24.2%. Intake
of energy and macronutrients (protein, fat, and
carbohydrates) of SMAN 11 South Tangerang
students are mostly in the less category, namely
86.4%, 74.2%, 60.6%, and 95.5%, respectively.
Some students of SMAN 11 South Tangerang have a
habit of consuming junk food frequently, namely
51.5%. As many as 68.2% of students at SMAN 11
South Tangerang have moderate physical activity.
There are 18.2% of students at SMAN 11 South
Tangerang who have poor nutritional knowledge.
There is no significant relationship between energy
intake, intake of macronutrients, consumption of junk
food, and knowledge of nutrition with the incidence
of obesity in students of SMAN 11 South Tangerang
with a p-value (>0.05).
ACKNOWLEDGMENTS
The author would like to thank all parties involved,
especially SMA Negeri 11 Tangerang Selatan who
have given permission to conduct research. In
addition, the author would like to thank the
ICSDH 2023 - The International Conference on Social Determinants of Health
230

Muhammadiyah University ICSDH committee Prof.
Dr. Hamka who has facilitated the author to convey
the results of this research.
REFERENCES
Ainun, N. (2022). Hubungan Asupan Zat Gizi Makro
Dengan Obesitas Pada Remaja (Studi Meta Analisis).
Poltekes Kemenkes Bengkulu, (8.5.2017), 2003–2005.
Arifin, N. A. (2019). Hubungan Status Gizi Dan Konsumsi
Junk Food Dengan Menarche Dini Pada Remaja Awal
(Studi Kasus Di 3 Sekolah Dasar Kota Malang).
Ayu, K., Paramita, T., Indonesiani, S. H., & Gede, L.
(2023). Hubungan Aktivitas Fisik dengan Kejadian
Obesitas pada Remaja SMAN 4 Denpasar Selama Masa
Pandemi Covid - 19. E Journal AMJ, 3(1), 117–123.
Dewi, A., Sulrieni, I. N., Ningsih, M. S., Studi, P., Terapan,
S., & Informasi, M. (2023). Faktor - Faktor Yang
Berhubungan dengan Kejadian Obesitas Pada Siswa
MAN 1 Kota Padang. 2(1), 159–171.
https://doi.org/10.55123/sehatmas.v2i1.1356
Dewi, P. L. P., & Kartini, A. (2017). Hubungan
Pengetahuan Gizi, Aktivitas Fisik dan Asupan Energi,
Asupan Lemak dengan Kejadian Obesitas pada Remaja
SMP. Journal of Nutrition College, 6(3), 257.
https://doi.org/10.14710/jnc.v6i3.16918
Fridawanti, A. P. (2016). Hubungan antara asupan energi,
karbohidrat, protein, dan lemak terhadap obesitas
sentral pada orang dewasa di Desa Kepuharjo,
Kecamatan Cangkringan, Yogyakarta. Ucv, I(02).
Retrieved from http://dspace.unitru.edu.pe/bitstream/
handle/UNITRU/10947/Miñano Guevara%2C Karen
Anali.pdf?sequence=1&isAllowed=y%0Ahttps://repos
itory.upb.edu.co/bitstream/handle/20.500.11912/3346/
DIVERSIDAD DE MACROINVERTEBRADOS
ACUÁTICOS Y SU.pdf?sequence=1&isAllowed=
Indriawati, R., & Soraya, F. (2009). Hubungan Konsumsi
Makanan Cepat Saji dan Tingkat Aktivitas Fisik
terhadap Obesitas pada Kelompok Usia 11-13 Tahun.
Mutiara Medika Edisi Khusus, 9(2), 121–128.
IPAQ. (2004). Guidelines for data processing and analysis
of the IPAQ-short and long forms. Med Sci Sports
Exercise, (April), https://www.physio-pedia.com/
images/c/c7/Quideline.
Irawan, D. H. D. (2022). Hubungan Pengetahuan Gizi,
Kebiasaan Konsumsi Junk Food, dan Makanan
Berserat Terhadap Status Gizi Siswa SMA N 1
Salaman. Universitas Islam Negeri Walisongo
Semarang.
Kemenkes, R. (2019). PMK RI Nomor 28 Tahun 2019
tentang Angka Kecukupan Gizi. 22, 1–8.
Kementerian Kesehatan RI Banten. (2013). Riskesdas
dalam Angka Provinsi Banten 2013. 320.
Mahasiswa, J. I., Biomedis, K., Prima, T. A., Andayani, H.,
& Abdullah, N. (2018). The Relationship of Junk Food
Consumption and Physical Activity With Obesity of
Adolescents in Banda Aceh. Jurnal Ilmiah Mahasiswa
Kedokteran Biomedis, 4(1), 20–27. Retrieved from
http://www.jim.unsyiah.ac.id/FKB/
Nugroho, P. S., & Hikmah, A. U. R. (2020). Kebiasaan
Konsumsi Junk Food dan Frekuensi Makan Terhadap
Obesitas. Jurnal Dunia Kesmas, 9(2), 185–191.
Retrieved from http://ejurnalmalahayati.ac.id/index.p
hp/duniakesmas/index
Praditasari, J. A., & Sumarmik, S. (2018). Asupan Lemak,
Aktivitas Fisik Dan Kegemukan Pada Remaja Putri Di
Smp Bina Insani Surabaya. Media Gizi Indonesia,
13(2),117. https://doi.org/10.20473/mgi.v13i2.117-122
Pramono Dwi Sasmito. (2015). Hubungan Asupan Zat Gizi
Makro (Karbohidrat, Protein, Lemak) Dengan Kejadian
Obesitas Pada Remaja Umur 13-15 Tahun di Propinsi
DKI Jakarta (Analisis Data Sekunder Riskesdas 2010).
Nutrire Diaita, 7(1), 8. Retrieved from https://ejurnal
.esaunggul.ac.id/index.php/Nutrire/article/view/1272
Sembiring, B. A., Rosdewi, N. N., & Yuningrum, H.
(2022). Hubungan Aktivitas Fisik dengan Kejadian
Obesitas pada Remaja di SMA Swasta Cerdas Bangsa,
Kecamatan Deli Tua, Kabupaten Deli Serdang, Medan.
Jurnal Formil (Forum Ilmiah) Kesmas Respati, 7(1),
87. https://doi.org/10.35842/formil.v7i1.421
Sineke, J., Kawulusan, M., Purba, R. B., & Dolang, A.
(2019). Hubungan Tingkat Pengetahuan Gizi Dan Pola
Makan Dengan Kejadian Obesitas Pada Siswa Smk
Negeri 1 Biaro. Jurnal GIZIDO, 11(01), 28–35.
https://doi.org/10.47718/gizi.v11i01.752
Suha, G. R., & Rosyada, A. (2022). Faktor-faktor yang
berhubungan dengan kejadian obesitas pada remaja
umur 13–15 tahun di Indonesia (analisis lanjut data
Riskesdas 2018). Ilmu Gizi Indonesia, 6(1), 43.
https://doi.org/10.35842/ilgi.v6i1.339
Tanjung, N. U., Amira, A. P., Muthmainah, N., Program, S.
R., Ilmu, S., Masyarakat, K., … Abstrak, M. (2022).
Junk Food dan Kaitannya dengan Kejadian Gizi Lebih
Pada Remaja. Jurnal Ilmiah Kesehatan Masyarakat,
14(3), 133–140. Retrieved from https://jikm.upnvj.
ac.id/index.php/home/article/view/343/129
Telisa, I., Hartati, Y., & Haripamilu, A. D. (2020). Faktor
Risiko Terjadinya Obesitas Pada Remaja SMA.
Faletehan Health Journal, 7(03), 124–131.
https://doi.org/10.33746/fhj.v7i03.160
The Relationship Between Energy Intake, Macro Nutrition, and Other Factors with the Incidence of Obesity in Students of Senior High
School 11 South Tangerang
231
