
Towards Generating 3D City Models with GAN and Computer Vision
Methods
Sarun Poolkrajang
a
and Anand Bhojan
b
School of Computing, National University of Singapore, Singapore
Keywords:
Generative Adversarial Networks, Neural Networks, Computer Vision, City Generation.
Abstract:
City generation for video games is a resource and time-consuming task. With the increasing popularity of
open-world games, studies on building virtual environments have become increasingly important for the game
research community and industry. The game development team must engage in urban planning, designate im-
portant locations, create population assets, integrate game design, and assemble these elements into a cohesive-
looking city. Based on our limited knowledge and survey, we are the first to propose a holistic approach that
integrates all features in generating a city, including the natural features surrounding it. We employ a gener-
ative adversarial network architecture to create a realistic layout of an entire city from scratch. Subsequently,
we utilize classical computer vision techniques to post-process the layout into separate features. The chosen
model is a simple Convolutional GAN, trained on a modest dataset of 2x2 km² snippets from over two thou-
sand cities around the world. Although the method is somewhat constrained by the resolution of the images,
the results indicate that it can serve as a solid foundation for building realistic 3D cities.
1 INTRODUCTION
Open-world games have been a popular genre of big
budget, ”AAA” (Triple-A) games for the past few
years now. Though the setting of the games ranges
from medieval to futuristic, there remains a common
denominator; most of them feature some form of city
or settlement areas. Be it for story or atmospheric pur-
poses, there is no question it is an integral part of the
genre. However, due to the amount assets required
to fully realize a city in-game, many developers find
them difficult and tedious, while players are often left
with small two-block villages being labeled cities.
Despite the large leaps in consumer-grade graphi-
cal performance, the city sizes in video games have
yet to approach that of our contemporary real life
counterparts. Among the biggest sits Cyberpunk
2077, estimated to be around 100-130 km
2
. For com-
parison, the Central Region of Singapore alone spans
132 km
2
. As player appetite for more immersive
game worlds increase, the developers would also need
more tools to work with in order to match their au-
dience’s expectations. In this paper, we explore the
usage of a generative adversarial network, which con-
a
https://orcid.org/0009-0004-1723-8258
b
https://orcid.org/0000-0001-8105-1739
tains generators (G) with learned weights to generate
all the features present in a city from scratch, and dis-
criminators (D) with learned weights to distinguish
between layouts of real cities and fake ones.
1.1 Contributions
We gathered over 10 thousand 2x2km
2
snippets from
two thousand real cities and color-coded the desired
features into rasterized images. A Generative Adver-
sarial Network is then trained on the dataset(s) of such
images to generate entire maps of new cities. Af-
ter new maps are generated, we use Computer Vi-
sion techniques to separate the features from the re-
sulting images. Then, we used procedural techniques
to generate roads and buildings of different sizes on
top of said map in a 3D graphics engine. We inferred
that such a method, as opposed to simulation meth-
ods, would not utilize much GPU resource. We felt
this was important, as having the inference process be
more resource consuming than rendering the actual
city in 3D may limit practical usage.
1.2 Novelty
Currently, there are very few holistic learning-based
methods for city generation available on the market.
Poolkrajang, S. and Bhojan, A.
Towards Generating 3D City Models with GAN and Computer Vision Methods.
DOI: 10.5220/0012315000003660
Paper published under CC license (CC BY-NC-ND 4.0)
In Proceedings of the 19th International Joint Conference on Computer Vision, Imaging and Computer Graphics Theory and Applications (VISIGRAPP 2024) - Volume 1: GRAPP, HUCAPP
and IVAPP, pages 211-219
ISBN: 978-989-758-679-8; ISSN: 2184-4321
Proceedings Copyright © 2024 by SCITEPRESS – Science and Technology Publications, Lda.
211

Many proposed methods focused on one aspect of
city generation, be it generating the road network, the
building footprints or textures, or the terrain itself.
Some have proposed simulation methods, which we
believe may yield the best results, but are also very
computationally expensive. Many of the adopted so-
lutions are using procedural methods, which we be-
lieve may be more limiting compared to deep learn-
ing solutions, as proposed procedural methods often
result in grid-like shapes, while real cities have more
variety.
We propose a holistic framework as a solution.
Every feature relevant to an urban city, be it roads,
buildings, houses, parks, rivers, etc. can be gener-
ated together. We believe there is merit to generating
all these features together, as the relationship between
them affect how cities in real life look.
We also believe a neural network that can be in-
ferred on relatively low-end hardware is important.
Otherwise, if the city generation process is resource
consuming, smaller developers, who may not have a
large team to build a city manually, would also be
locked out simply because they may not have the bud-
get for a render farm with the latest Quadro/RTX 6000
cards. We trained our model mainly on Google’s TPU
Cloud services, and performed inference and render-
ing on an RTX 3070.
2 RELATED WORKS
This section reviews existing works focusing on ur-
ban features and model synthesis. The first part of
this section reviews the currently available tools on
major graphical engines for this task. The second part
explores procedural approaches to the task, and the
third part reviews the approaches that used deep learn-
ing techniques. The final part of this section discusses
existing methods for generating the cities in 3D model
form.
2.1 Industry Methods
In the video game industry, creating cities as back-
drops or foregrounds is a big undertaking (O’Sullivan,
2021). In order to have a fully realized and cohe-
sive city, both the 3D assets and the layout of the
cities must be realistic to a degree. In many in-
stances, the developers/modelers had to make the
cities from scratch, meaning both the layouts and the
minute details throughout the city must also be man-
ually crafted, making it a very time-consuming pro-
cess. Several projects utilized scanning real cities and
building their in-world 3D city on top of that, saving
time on the urban design process and the overall ar-
chitecture. For games that are not open-world, the de-
velopers may opt to build only part of a city in detail,
and leave the non-playable areas messy and incoher-
ent. For open-world games, in many instances, they
must build out the whole city. The Grand Theft Auto
franchise is perhaps the most famous one for such
an undertaking, building entire fictional cities, though
they are often based on real ones (Brady, 2023).
Aside from manually constructing an entire city
or scanning a real city for further modifications, pro-
cedural generation is another popular way to gener-
ate cities from scratch. Houdini, a popular procedu-
ral/simulation software, has several rule-sets that can
be used to generate urban features. The recent ver-
sions of Unreal Engine adopted a plugin from Hou-
dini, to procedurally build a 3D city (Inc., 2023). This
method first generates a layout for roads with one pro-
cedural rule-set, then asks the user to define zones
in the city, then fills up the gaps between the roads
with procedurally generated buildings, based on an-
other rule-set.
Figure 1: Unreal Engine 5’s Tools (Inc., 2023).
Blender also has plugins for reading Geograph-
ical Information System (GIS) data and generating
meshes on top (vvoovv, 2023). This allows for a rel-
atively easy way to generate a 3D model recreation
of a real city. The building shapes are based on data
recorded in OpenStreetMap, including the footprint
shape recorded as vectors. The geometry nodes in the
program also allows for rule-sets to generate cities or
buildings from scratch.
Outside the aforementioned industries, there are
a few procedural methods used for urban planning.
ArcGIS claims to have a procedural rule-set that can
be used on top of real GIS data, generating improved
urban plans for real cities (ESRI, 2022).
GRAPP 2024 - 19th International Conference on Computer Graphics Theory and Applications
212
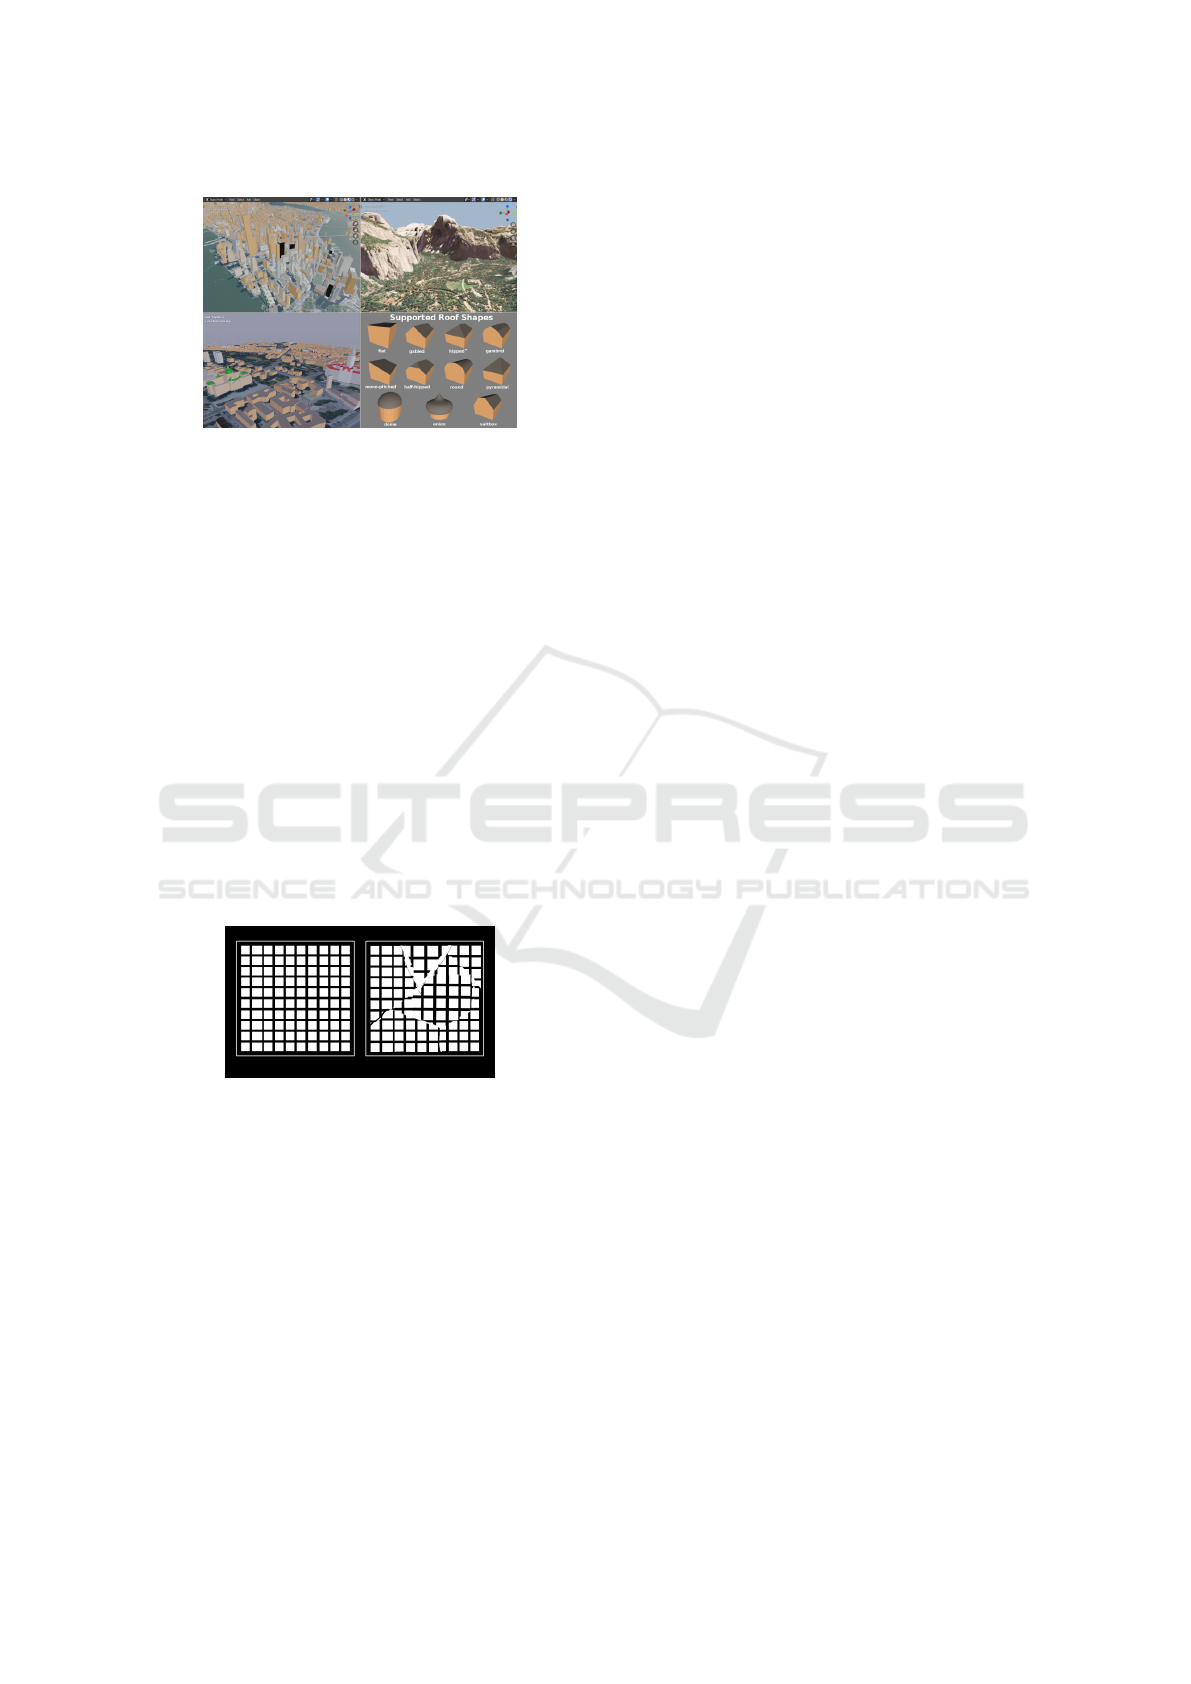
Figure 2: vvoovv’s Blender-OSM tool (Inc., 2023).
2.2 Related Literature: Procedural
Methods
There have been several research papers about city
generation using procedural methods. Most of them
can be grouped into two categories: road network
generation and building generation, with a few excep-
tions covering both.
2.2.1 Generating City Layouts
Most procedural methods involve generating a grid,
which would then form the basis of a city, serving as
locations for roads and buildings. These grids are then
broken up with some form of noise or texture, giving
some randomness to the city (See: Figure 3). The
buildings are then drawn on top of the generated grid,
and the building models themselves are also gener-
ated with another procedural algorithm.
Figure 3: Many proposed procedural methods involve gen-
erating a straight grid first, before adding noise to it to create
a more realistic road network.
Gao et al. (Gao et al., 2022) proposed a proce-
dural generation method to generate urban road net-
works based on data from OpenStreetMap (OSM).
They used the topological networks recorded within
OSM’s database to represent the road networks, and
proposed a rule-set to generate such networks so that
they can be used to recreate the roads in 3D. Benes et
al. (Bene
ˇ
s et al., 2014) proposed a different method
that takes into account rivers and traffic. This method
slowly generates smaller concentrations of roads first,
mirroring how settlements in the past are formed in-
dependently before slowly being joined over time into
mega-cities. After the roads are generated, they sim-
ulated the traffic flow within and between the settle-
ments, and use that as a condition to generate more
roads. The iteration repeats and more roads are gen-
erated on top, mimicking how in real life, cities ex-
pand with more roads to serve higher traffic demands.
Weber et al. (Weber et al., 2009) proposed what we
believe is currently the most detailed method; starting
from one user-defined road, they generated new roads
and buildings on top of the old repeatedly, modeled
as a time series. This mirrors how many city-builder
games start out, with one road cutting through a piece
of land for the player to build around. The method
seems to require natural features, such as a river, to
have been predefined in the user’s input, lest they be
entirely omitted; a limitation we hope to overcome.
2.2.2 Generating Building Models
In terms of generating the buildings, Biljecki et al.
(Filip Biljecki, 2016) proposed a procedural method
for generating 3D LODs for buildings in a city by
acquiring the footprint shape and reducing a gener-
alized building model to fit the footprint shape. Oliva
(Oliva, 2023) had also released a procedural building
generation plug-in for Blender. The plug-in uses a
few pre-existing assets, and then generates the build-
ings based on a given shape of the footprint, with the
number of floors and windows as parameters.
2.2.3 Combined Methods
In combining the two sides, Kelly et al. (Kelly and
McCabe, 2006) surveyed several methods to generate
cities, from the use of the voronoi texture to help gen-
erate a road network, to using geometric primitives
to create buildings. Seok Kim et. al (Joon-Seok Kim,
2018) proposed a procedural method to generate cities
starting from a base terrain, then generating a city lay-
out and road networks on top of that. Gaisbauer et
al. (Bo Lin, 2020) proposed a method to generate
smaller video game maps with procedural methods
using wave function collapse (WFC). Wave function
collapse involves using quantum mechanics, where a
wave function represents the probability distribution
of particles in a physical system, and uses a set of
input patterns or tiles to generate an output pattern.
The algorithm analyzes the local neighborhoods and
determining other possible configurations. They also
proposed using simple spatial mappings to generate a
3D voxel model representing the generated city. This
is the closest research to what we are looking for, as
the paper explored both generating a city layout and a
3D post-processing portion. However, their methods
also did not cover the generation of natural features.
Towards Generating 3D City Models with GAN and Computer Vision Methods
213

2.3 Related Literature: Learning
Methods
Unlike procedural methods, existing papers on this
topic using deep learning or other learning methods
mainly focus on generating city layouts, and less so
on generating the buildings. This section will focus
on the former aspect.
Most papers proposing a learning method uses
some form of neural network. Zhang et al proposed
MetroGAN (Weiyu Zhang, 2022) for generating a
satellite imagery-like morphology of cities by split-
ting the geographical features into different condi-
tions for the generator. However, the end results
largely contain road networks and little else, making
them unsuitable for post-processing in a 3D program.
Albert et al. (Albert et al., 2018) similarly generated
urban patterns using GANs, resulting in a heatmap-
like image of the buildings. This mainly captures the
shapes of building densities across a city, and is in fact
evaluated with building density patterns, but the re-
sulting images don’t have detailed building footprints.
Bachl et al. (Bachl and Ferreira, 2020) proposed a
learning method for urban styles when viewed at the
ground level, performing a style transfer task to gen-
erate a city with textures of another overlaid on top.
Song et al.(Jieqiong Song, 2021) proposed MapGen-
GAN, which focused on generating map-like images
from real satellite images, but did not generate new
cities. Shen et al. (Jiaqi Shen, 2020) performed a
style-transfer task, where an input road network was
filled with building blocks. They used GAN for the
task, and trained the generator on a dataset of real
cities in China with erased building footprints. The
generator outputs a map with the same road network
as the input data, but with building footprints filled
in. The discriminator is then trained to distinguish
between that output and the ground truth. There was
no road generation component to this paper, however.
Similarly, Fedorova (Fedorova, 2021) tackled a simi-
lar task, but instead of filling in all the buildings, they
focused on generating a missing block. Maps of real
cities with one block removed serves as the input, and
the output is that same city, but with the missing block
filled. This paper was highly focused on getting the
shapes of that generated block right, based on popu-
lation density of the surrounding areas.
2.4 Current Limitations
As discussed, most papers are focused on generating
city layouts, with the main features being roads and
buildings. However, none of the papers covered gen-
erating features such as rivers, lakes, and parks. In ad-
Figure 4: Samples captured from London, UK.
dition, most of the past research were not made with
the intent to be converted into a 3D model, which re-
sulted in layouts with highly detailed roads, but not
detailed building footprints, or vice versa. Many pro-
cedurally generated road networks did not include any
building generation, and simply assumed the negative
space between the roads to be filled with buildings.
3 DATA COLLECTION AND
PRE-PROCESSING
3.1 Data Source
Not many databases on the internet collect detailed
data about cities around the world. Among the
most famous, open-sourced ones is OpenStreetMap
(OSM). With a well built API for accessing their
database, we decided on building our dataset from
them.
We sampled rectangular snippets of cities of
2x2km
2
area. The features we collected are the
road network, rivers, lakes, canals, ocean, natural
parks, meadows, and building footprints, which were
grouped into landed housing, apartments, and com-
mercials.
As for our cities, we selected from a list of top 700
most populated cities in the world, a list of cities with
at least 1 million population, a list of biggest North
American cities, and a list of biggest European cities.
We collected five snippets from each city. 1
Collecting five snippets from over two thousand
cities gave us roughly ten thousand samples before
cleaning out samples that contained nothing, or only
a few roads. After cleaning, our biggest dataset is at
6591 samples.
3.2 Pre-Processing
OpenStreetMap’s API allows us to extract each urban
feature individually. We then color-coded them onto
a black canvas and stored them into 256x256 images.
The colors are as described in Table 1. We chose each
color based on what we inferred would be easily sep-
arated with computer vision methods.
GRAPP 2024 - 19th International Conference on Computer Graphics Theory and Applications
214

Table 1: Hex Color codes for each feature.
Feature Color Code
Meadow e0ff8a
Natural 54ff60
Grassland b8ffbd
Water 0f02fa
River 54a1ff
Canal 54e3ff
Lake 54a1ff
Apartment fff700
House fa0297
Commercial fa4c02
The cities are first sampled based on the latitude
and longitude coordinates of the city centers on Open-
StreetMap, then an additional four sample is created
by setting an offset to the north, south, east, and west
to capture those adjacent areas.
Figure 5: Samples captured from Bangkok (left) and Singa-
pore (right). Both have quite a lot of missing details.
Our datasets, however, are limited by two factors.
The size of 256x256 is often too small to fully cap-
ture 2x2km
2
snippets of dense cities, often result-
ing in pixelation of some features. This can lead to
noises and artifacts in the generated images, and sub-
sequently, in the 3D model. Then, there’s the limi-
tation of OpenStreetMap’s database, which is crowd-
sourced and requires people to input data of the places
they’re from manually. This creates a selection bias,
as smaller cities will have less data on them. On top
of that, since OpenStreetMap is an English-speaking
platform, data from non-English-speaking countries
will also be far more limited. A reason we chose
to specifically sample North American and European
cities is because they contain more data, and so we ex-
pected this would lead to a biased generator that leans
toward grid-styled cities common in the west.
4 TRAINING
4.1 Choosing the Generative Model
One of the aims for this project is the to generate ev-
erything from scratch, not even with a starting road or
terrain, and so we avoided methods that require some
form of user input. Thus, GAN models meant for a
style transfer task such as pix2pixGAN or CycleGAN
are not appropriate for this task.
We chose a simple Deep Convolutional GAN
(DCGAN) for the task. A simple DCGAN is proven
and versatile, and since it requires no user input, we
had more flexibility in how we color-code the features
of a city into an image (Dragan et al., 2022).
4.2 Model Architecture
We four deconvolutional blocks on the generator and
four convolutional blocks on the discriminator, with
both blocks using a Leaky ReLU layer. The generator
upsamples a random noise from 16x16 to 256x256,
and the discriminator downsamples from 256x256
down to 16x16 before flattening it. The activation
function of the generator is a tanh function. The dis-
criminator uses a dense layer to perform the final clas-
sification.
The model was trained on Google’s Cloud TPU
v2-8. There were eight TPU devices in total, though
we did not paralellize the training process. The train-
ing script was written in Python, utilizing the Tensor-
flow library, as it was developed for TPUs in mind.
The dataset was also hosted on a Google Cloud virtual
machine during training. The inference after train-
ing was done on an Nvidia RTX 3070, running on the
CUDA platform, also via Tensorflow.
We first trained the model on our largest dataset,
and we quickly found the results unusable. We then
experimented with four more datasets created from
sub-sections of the previous datasets. We found the
model trained from the set with 3197 samples, only
used cities from the list of the world’s biggest, to per-
form the best. The FID scores are shown in Table 2.
Table 2: FID scores for each datasets.
Criteria FID Score
Top 200 Cities by population 533.2098
Top 500 Cities by population 427.9565
Cities with over 1M population 413.7835
The above set + Top 500 NA Cities 520.8111
The above set + Top 500 EU Cities 475.0358
The FID scores only judge the quality of the gen-
erated images, which we used as a comparative mea-
sure to evaluate which dataset performs the best. We
will perform further post-processing before evaluat-
ing the city layouts.
Towards Generating 3D City Models with GAN and Computer Vision Methods
215
5 POST PROCESSING WITH
COMPUTER VISION
TECHNIQUES
We used classical computer vision methods to sepa-
rate the city features encoded in the images. These
methods produces separate images for each feature,
allowing our 3D engines to easily create 3D equiva-
lents from the given layout.
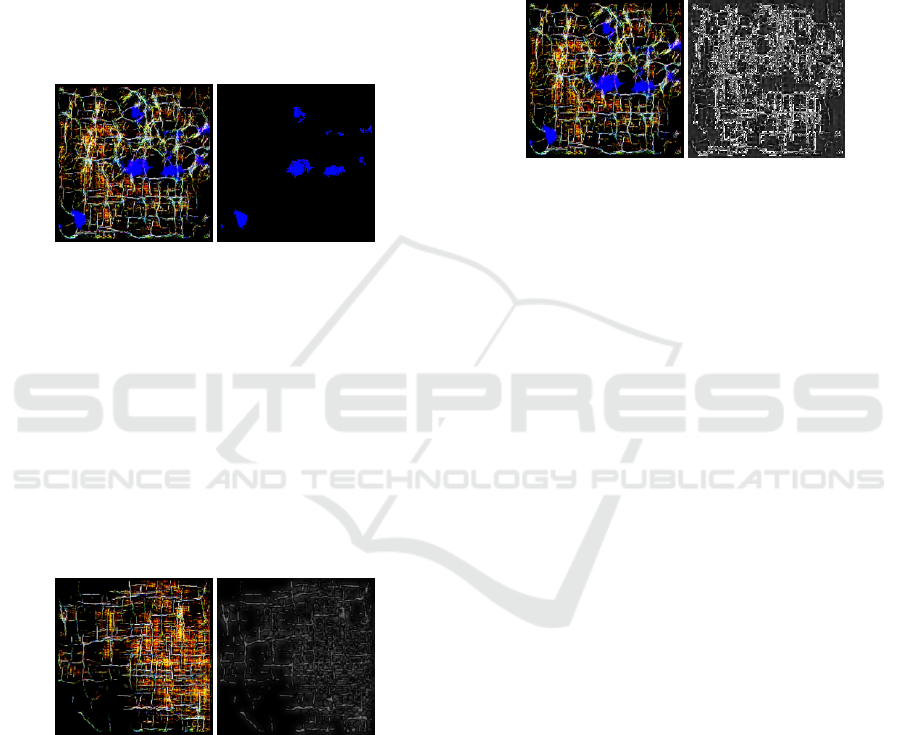
5.1 Hue-Saturation-Value Masking
Figure 6: Original output (left) and masked output (right).
Features such as nature and water are encoded with
striking blue and green coloring. Since both are dis-
tinct hues, and we know what their exact hex values
are, they can be easily separated using a simple HSV
mask. The by-product of this method is that we also
got rid of noises of these features. A lone blue pixel
near a road will not have the same HSV value due
to compression, for example, and can be filtered out
with this method.
5.2 Bandpass Filter
Figure 7: Original output (left), a Bandpass-filtered output
(right).
The road networks encoded in white pixels act like a
texture in our images. They have a specific frequency
in the image, making a Bandpass Filter the perfect
tool for isolating them. Using an implementation with
a pair of Butterworth Low and High Pass filters, we
obtain an isolated road network.
We targeted the frequencies of the image for this
task and experimented with several parameters. We
found that passing the higher frequencies would end
up capturing the buildings as a part of the road net-
work, as their color is often the most dominating in a
map. By keeping the frequencies low, we are able to
filter out the buildings and also smooth out the noise
in the road networks. The filtered image has more
consistent roads than the original image, where some
roads often end abruptly due to noise in the image.
5.3 Bandreject Filter
Figure 8: Original output (left), and a Bandreject-filtered
output (right).
The building footprints are the dominant color in the
maps. They are the opposite of the roads striking
through, thus, intuitively, a bandreject filter should al-
low us to isolate the building footprints. The previ-
ously extracted road network can then be subtracted
out from the current bandreject result, preventing
building footprints from spawning on top of roads.
5.4 Reading into a 3D Engine
We used Blender and its Python library to perform the
conversion to 3D. Similar to the methods used by Lin
et al.(Bo Lin, 2020), we create a Voxel model first
before perform further processing. We first read the
image map and its supplementary filtered images. We
then read the map, layer by layer, and create simple
meshes on top of them. For the building layers, we
may need to also multiply the colors of the original
output with the filtered output, so that we can still tell
how tall each building should be, relative to one an-
other. We’ve set the commercial buildings to be the
highest, followed by apartment buildings, and then
landed housing. Each class of building will have a
range of height they can be randomly generated on
top of.
The buildings themselves can be represented with
simple cube meshes or more complex procedurally
generated models. Their positions are based on the
white spots on the bandreject output. Figure 9 shows
some of the final output we achieved
GRAPP 2024 - 19th International Conference on Computer Graphics Theory and Applications
216
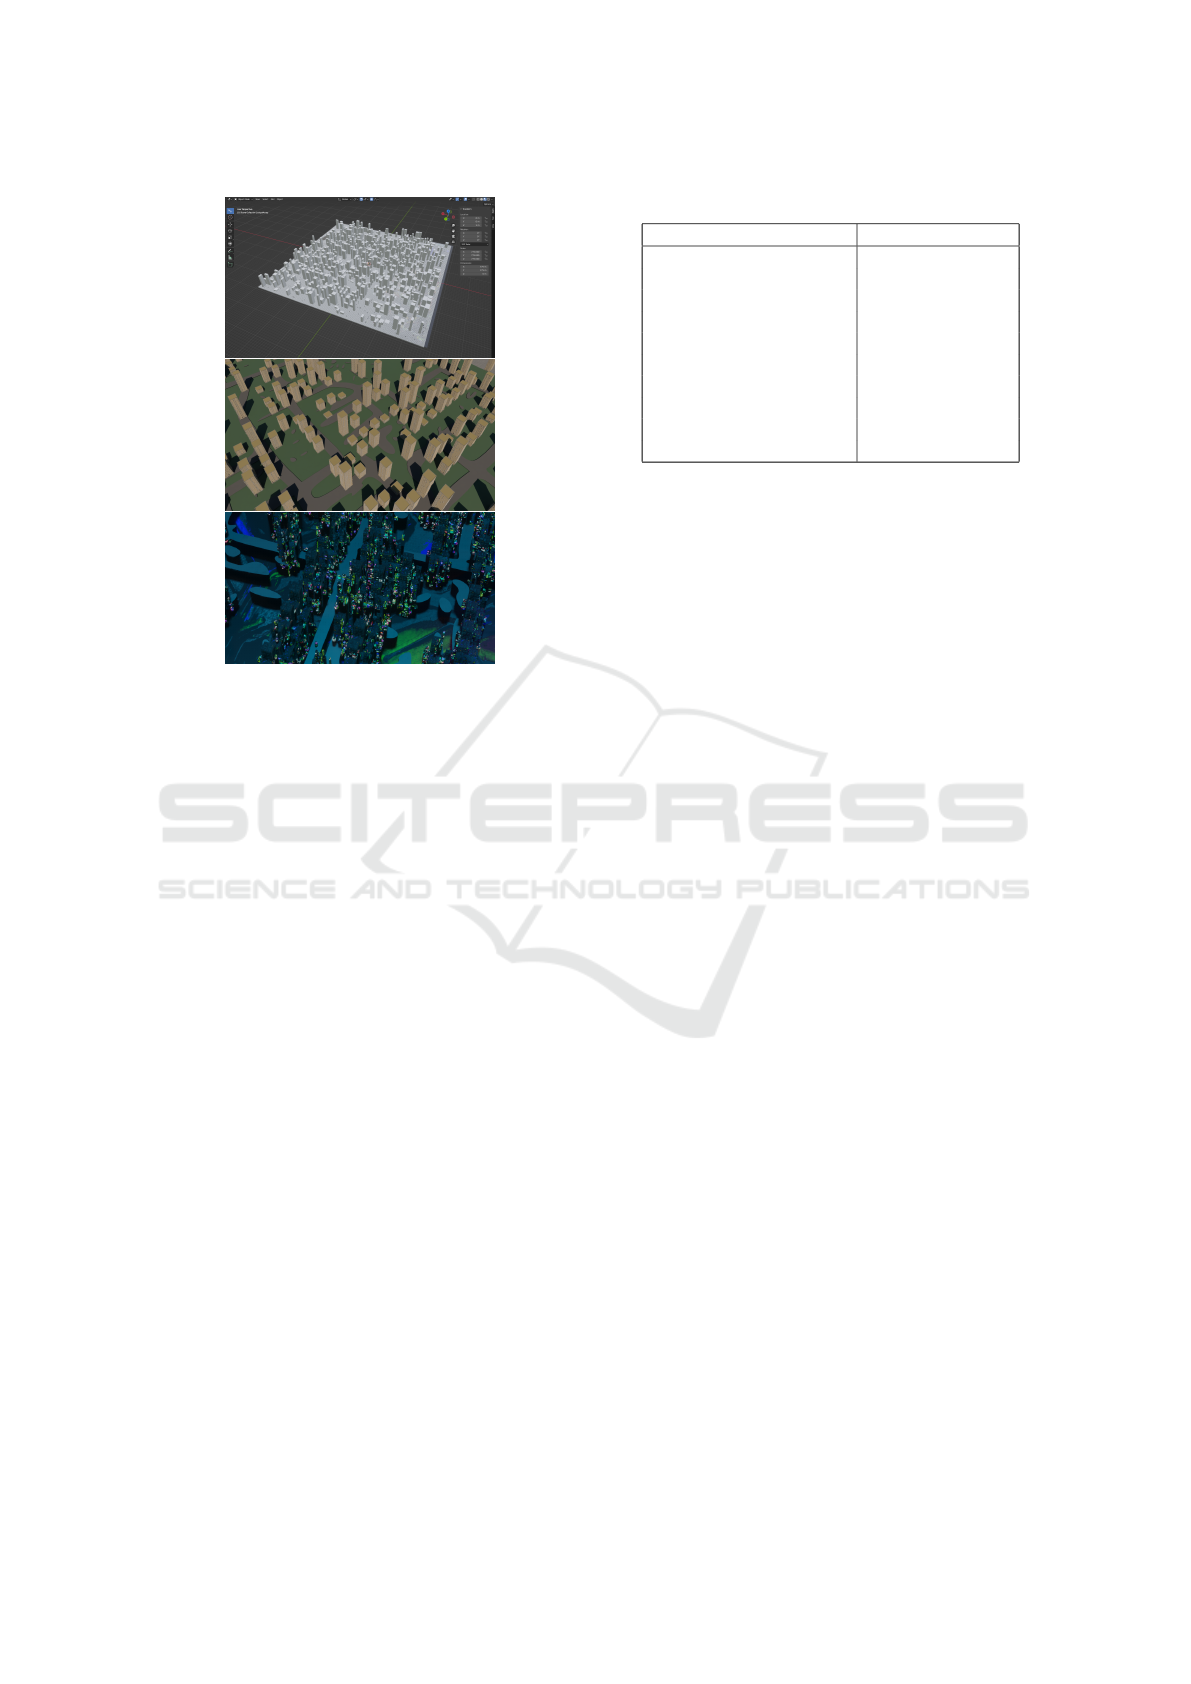
Figure 9: Final outputs rendered in different styles. A prim-
itive mesh-only render (top left), a procedurally generated
building render(top right), and a textured render (bottom).
6 EVALUATION AND FURTHER
RESEARCH
Bloomberg (O’Sullivan, 2021) once interviewed
game designers on the topic of city generation, and
what makes for a realistic one. It was said that,
while audiences may not notice bad (as in fake) urban
planning, they will notice a contradiction; anything
that makes the city look incoherent. For example, a
non-circular roundabout or an out-of-era building will
stand out to the player. We evaluated our model based
on this observation.
6.1 Subjective Evaluation Survey
We surveyed 30 participants with 10 pairs of cities be-
ing compared side by side. The participants are asked
which city they prefer at first glance, without being
told one is a faked layout and the other is based on a
real city. We thought it best not to tell the participants
that there is a fake, as there are some imperfections
with our 3D models (i.e. floating top building floors),
so we did not want those nitpicks to sway the partic-
ipants. Rather, we want their impressions of a city at
first glance, and whether they feel it is familiar (real)
or not (fake).
We paired the fake and real cities with similar fea-
tures. Four out of ten pairs on our survey resulted in
Table 3: Surveyed Pairs.
Category Selected Fake (%)
River through city 17
Dual Avenue 47
Intersections 27
Intersections 63
Intersections 13
Main Roads w/ Branches 80
Main Roads w/ Branches 73
River vs landed 7
River vs landed 90
River through city 26
the majority of participants choosing the fake outputs
over the real ones. This suggests that there are some
areas where the generated cities are good enough to
fool people. Looking into our categories, we see that
the fake cities performed very well for areas that are
a simple main road branching off into smaller roads.
On intersections, only one pair won, and when it
comes to rivers, the fake model only won once.
Looking at the renders subjectively, we believe
this is because the bodies of water generated by our
model do not form a line, creating a river. Rather,
they are often lakes around the map. And when it
comes to intersections, the model struggles with cre-
ating coherent intersection shapes. The only pair the
fake one won is the pair where the real map had some
graphical issues with its roads.
6.2 Comparisons to Past Research
Among the papers reviewed above, most are excellent
in generating one aspect of the city, though there are
no previous model that can generate all the features.
In this section, we cherry-picked the best generated
features from each paper and compared them with our
results.
In terms of the road layouts, many past papers
were able to generate detailed road networks, either
by procedural or deep learning methods. The past
results were well recorded onto images, better than
ours. However, they do not cover an area as large.
Most of them are also restricted to grid-like layouts,
or are only capable of urban city-center roads. Our
model is capable of generating a suburban-like area,
where the urban concentration tapers off to one or two
roads leading out.
In terms of building footprints, our models often
results in too concentrated, and the footprints aren’t
detailed enough as a result. Compared to other pa-
pers, some that focused on smaller blocks were able
to generate more detailed footprints. However, com-
pared to papers generating larger city blocks, the level
of detail is not as far behind.
Towards Generating 3D City Models with GAN and Computer Vision Methods
217
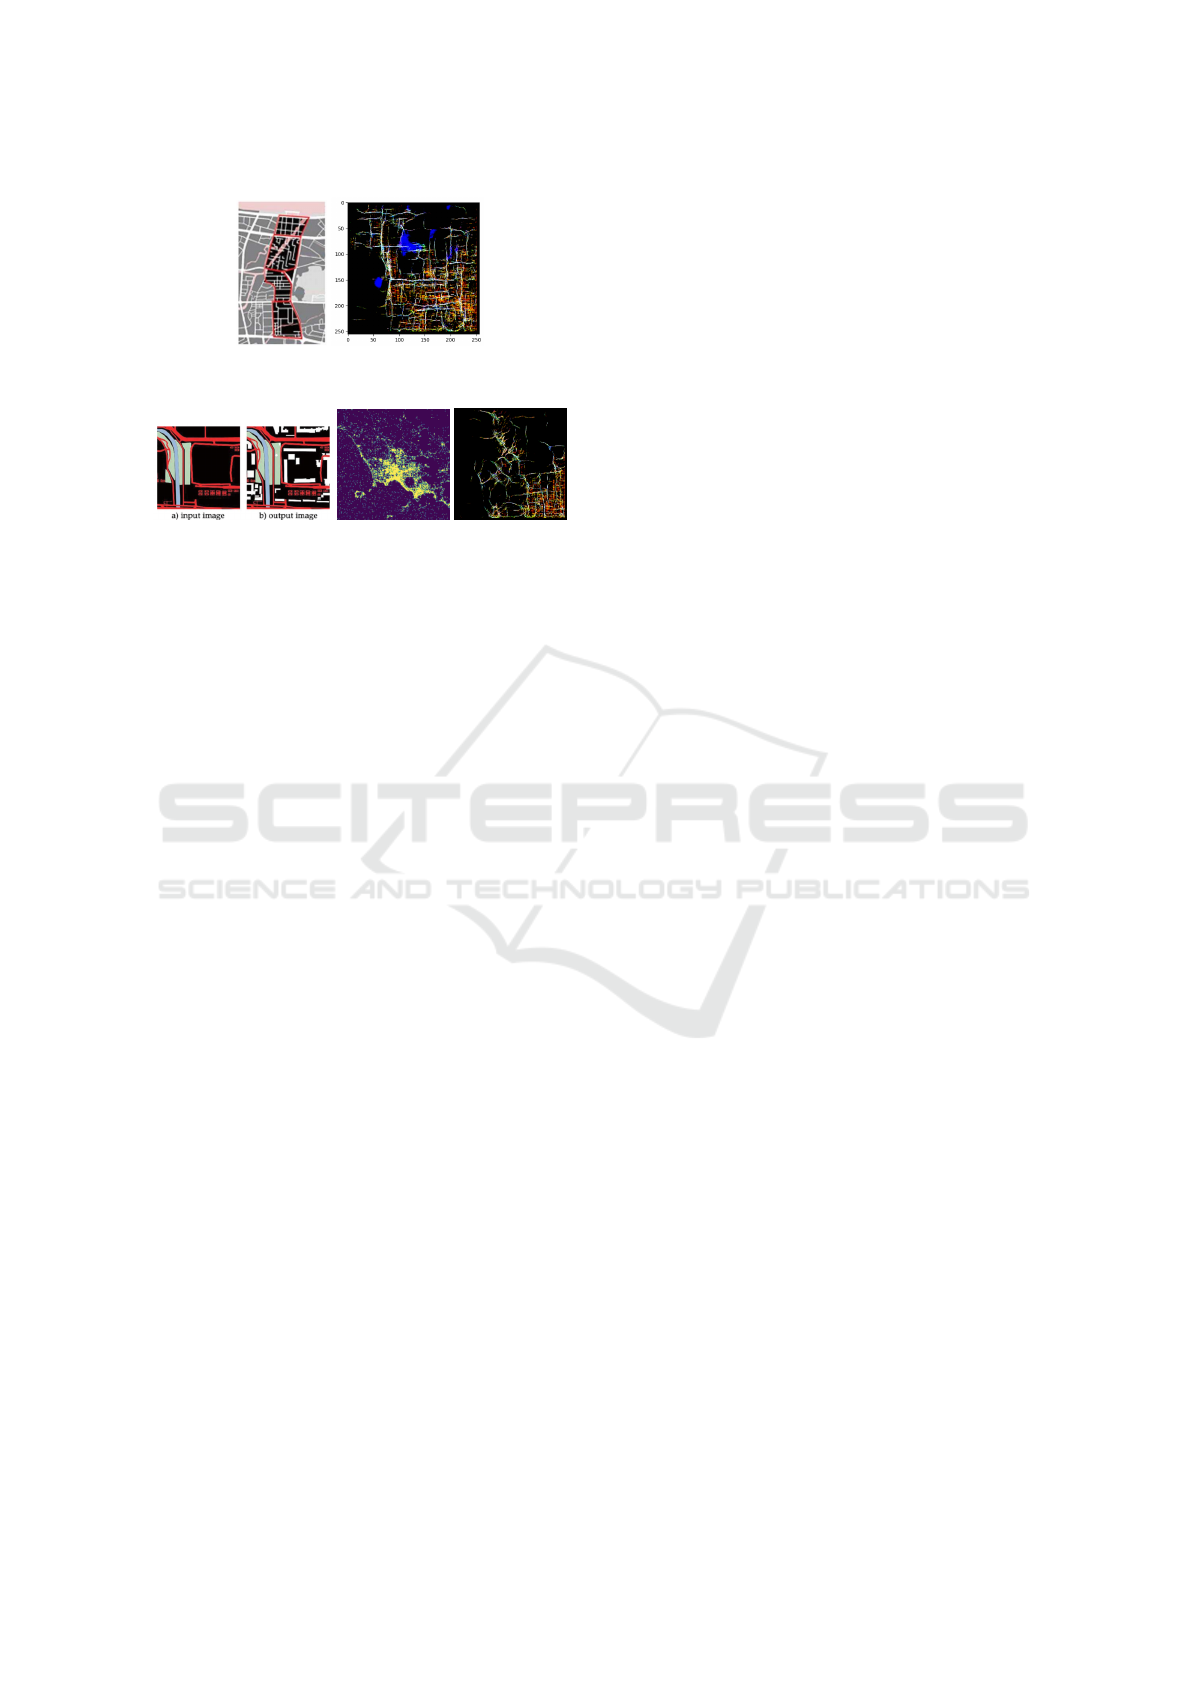
Figure 10: Comparison of generated road layouts of a past
paper (Bo Lin, 2020) and our own.
Figure 11: Comparison of generated building footprints of
a past paper with a smaller area (left) (Jiaqi Shen, 2020),
a similar area (middle)(Weiyu Zhang, 2022) and our own
(right).
7 SUGGESTIONS FOR FUTURE
RESEARCH
For future research, we may suggest training and
generating each feature of the city separately in-
stead. Based on the method used for MetroGAN
(Weiyu Zhang, 2022), giving each training feature a
different lost function can result in a more accurate
layout. Methods suggested by Lin et al. (Bo Lin,
2020) also involved splitting city features before com-
bining them to get the final results. If we generate
the terrain and water, then the road network, then the
building footprints, once feature at a time, the result-
ing image from each feature should suffer less from
pixelation and eliminate the issue of noise caused by
the extraction methods altogether.
Image resolution is also another limiting factor.
We observed some noise caused by the pixelation of
the images, which caused some of the 3D renders to
be imperfect. The process of separating each feature
for the 3D render also created some noise, resulting in
some undesired renders. Perhaps performing this task
on a larger resolution can work. Diffusion models
have since proven robust, so perhaps a future iteration
of this idea could utilize that, as newer diffusion mod-
els can generate higher resolution images. Exploring
the use of a super-resolution model may also be ben-
eficial, as that may allow the end result to be upscaled
and matched 1:1 with its real size. Right now, the
2x2km plot mapped onto a 256x256 image results in
approximately 8x8 square meters per pixel. Having a
super-resolution model that can always guarantee 1x1
square meter per pixel should also help alleviate the
compression issues.
Over the past year, improvements in diffusion
methods have since proven robust, especially in vi-
sual quality (Rombach et al., 2022). Perhaps it is
worth to explore such methods combined with other
map generation techniques. Such hybrid approaches
may be able to leverage the better visual quality of dif-
fusion methods (Stability.ai, 2022). It will be one of
our future works to combine diffusion methods with
our map generation methods.
We initially explored the idea of using OSM’s vec-
tor information directly, instead of flattening every-
thing into rasterized images. On paper, using the vec-
tors should produce more precise results, and would
be far easier to post-process. However, due to the
way OSM is set up, taking a rectangular snap will not
”crop” the vectors. Instead, certain features will con-
tinue out of bounds (i.e. a snippet of London may
contain a segment of the Thames thrice the length
of the snippet itself). Combined with the incredibly
dense amount of data included, the data processing
part would be far more complicated, and we deemed
it infeasible for the scope
8 CONCLUSION
In this paper, we have explored several aspects of gen-
erating a 3D city from scratch. Specifically, we have
collected snippets for over two thousand cities around
the world and created layout maps from them. Then,
we trained a GAN that learnt to generate those maps
from scratch and used computer vision techniques to
extract the data of each feature from the generated
maps before rendering them in Blender.
The experiment shows that the model performs the
best when the data is somewhat balanced. The smaller
datasets can be sufficient in training the model. We
do feel the process is rather limited by the resolu-
tion of the images, as the pixelation that was already
present in the training dataset is then taught to the
GAN model. The generated cities also lack some
features. Most generated water bodies are lakes and
rarely a river. The resulting 3D renders are still lack-
ing some assets and features. The buildings have no
orientation to the roads they are supposed to be facing,
the roads going over bodies of water are just floating
roads instead of a bridge, and the terrain is completely
flat.
Compared to past papers, we introduced a novel
method to generate the whole cities, with all the fea-
tures, instead of focusing on one or two features such
as roads or buildings. We also proposed a compre-
hensive method to generate 3D models on top of the
image layout, using a mix of procedural and computer
vision methods.
GRAPP 2024 - 19th International Conference on Computer Graphics Theory and Applications
218

ACKNOWLEDGEMENTS
This work is supported by the Singapore Min-
istry of Education Academic Research grant T1
251RES2205, “Realtime Distributed Hybrid Render-
ing with 5G Edge Computing for Realistic Graphics
in Mobile Games and Metaverse Applications”.
REFERENCES
Albert, A., Strano, E., Kaur, J., and Gonzalez, M. (2018).
Modeling urbanization patterns with generative adver-
sarial networks.
Bachl, M. and Ferreira, D. C. (2020). City-gan: Learning
architectural styles using a custom conditional gan ar-
chitecture.
Bene
ˇ
s, J., Wilkie, A., and Krivanek, J. (2014). Procedural
modelling of urban road networks. Computer Graph-
ics Forum, 33.
Bo Lin, Wassim Jabi, R. D. (2020). Urban space simu-
lation based on wave function collapse and convolu-
tional neural network. SimAUD ’20: Proceedings of
the 11th Annual Symposium on Simulation for Archi-
tecture and Urban Design.
Brady, R. (Retrieved 2023). Architecture in video games:
The satirical urban commentaries of grand theft auto.
Dragan, C.-M., Saad, M. M., Rehmani, M. H., and
O’Reilly, R. (2022). Evaluating the quality and diver-
sity of dcgan-based generatively synthesized diabetic
retinopathy imagery. MEDAL23: Advances in Deep
Generative Models for Medical Artificial Intelligence
(Springer Nature series).
ESRI (2022). About arcgis.
Fedorova, S. (2021). Gans for urban design. SimAUD 2021.
Filip Biljecki, H. Ledoux, J. S. (2016). Generation of multi-
lod 3d city models in citygml with the procedural
modelling engine random3dcity. IPSPRS Ann. Pho-
togramm. Remote Sens. Spatial Inf. Sci.Volume: IV-
4/W1.
Gao, T., Gao, Q., and Yu, T. (2022). A procedural gen-
eration method of urban roads based on osm. pages
242–248.
Inc., E. G. (Retrieved 2023). City sample quick start - gen-
erating a city and freeway in unreal engine 5.
Jiaqi Shen, Chuan Liu, Y. R. e. a. (2020). Machine learn-
ing assisted urban filling. Proceedings of the 25th In-
ternational Conference on Computer-Aided Architec-
tural Design Research in Asia (CAADRIA).
Jieqiong Song, Jun Li, H. C. e. a. (2021). Mapgen-gan: A
fast translator for remote sensing image to map via un-
supervised adversarial learning. IEEE Journal of Se-
lected Topics in Applied Earth Observations and Re-
mote Sensing.
Joon-Seok Kim, Hamdi Kavak, A. C. (2018). Procedural
city generation beyond game development. SIGSPA-
TIAL Special 10(2):34-41.
Kelly, G. and McCabe, H. (2006). A survey of procedural
techniques for city generation. 14.
Oliva, P. (Retrieved 2023). Buildify 1.0.
O’Sullivan, F. (2021). What designers of video game cities
understand about real cities.
Rombach, R., Blattmann1, A., Lorenz, D., and Esser, P.
(2022). High-resolution image synthesis with latent
diffusion models.
Stability.ai (2022). Stable diffusion public release.
vvoovv (Retrieved 2023). blender-osm: Openstreetmap and
terrain for blender.
Weber, B., M
¨
uller, P., Wonka, P., and Gross, M. (2009).
Interactive geometric simulation of 4d cities. EURO-
GRAPHICS 2009.
Weiyu Zhang, Yiyang Ma, D. Z. e. a. (2022). Metrogan:
Simulating urban morphology with generative adver-
sarial network. arXiv:2207.02590 [cs.CY].
Towards Generating 3D City Models with GAN and Computer Vision Methods
219
