
Examining the Impact of Weather, Temporal Factors, and User
Traits on Multimodal Shared Micromobility Systems in Non-Urban
Campus Environments: The MORE Sharing Case Study
Maryna Pobudzei
a
and Silja Hoffmann
b
Professorship for Intelligent, Multimodal Transportation Systems, University of the Bundeswehr Munich,
Werner-Heisenberg-Weg 39, 85577 Neubiberg, Germany
Keywords: Shared Micromobility, non-Urban Contexts, University Campus, Corporate Campus, Neighborhoods,
Communities, E-Bikes, E-Cargo Bikes, E-Scooters, E-Mopeds, Machine Learning Models, Weather Impact,
Time Impact, More Sharing.
Abstract: Although shared micromobility systems in cities have been extensively studied, their potential for non-urban
settings such as university campuses and rural communities has not been explored much yet. This study aims
to fill this gap by examining a multimodal shared micromobility service that offers various options through a
single app, such as city bikes, e-bikes, e-cargo bikes, e-mopeds, and e-scooters. The study analyzed this
campus-based system's first four months, considering factors like weather, time, user demographics, pre-
reservation duration, and vehicle types. Machine learning models like Negative Binomial Regression,
Random Forests, Gradient Boosted Regression Trees, and Neural Networks were used to analyze the data.
The study found that e-scooters were the most popular, followed by e-bikes. E-mopeds were used less but
were reserved for more extended periods. Most trips were taken on weekdays, especially between 8 AM and
6 PM. Reservation numbers peaked in the first month, and subsequent months showed longer reservation
durations and distances. Rain decreased trip numbers and distances but increased reservation durations.
Reservations on Fridays, weekends, and holidays were shorter but covered more distance. Female users
tended to travel longer distances. These findings can benefit similar non-urban environments, broadening the
application of shared micromobility systems.
1 INTRODUCTION
The 21st century has seen a rise in shared
micromobility as a form of urban transportation.
While most research has focused on city-wide
commercial projects facilitated by private mobility
companies, there is potential for implementing shared
micromobility solutions in smaller settings such as
residential neighborhoods, non-urban communities,
campuses, and corporate settings. These unique
contexts present opportunities and challenges that
require thorough investigation, as successful
implementation requires a deep understanding of
local dynamics and community requirements.
The University of the Bundeswehr in Munich,
Germany, is a suitable case study for exploring shared
micromobility in microenvironments. This 140-
a
https://orcid.org/0000-0002-3219-9144
b
https://orcid.org/0000-0002-0499-0342
hectare campus is one of the largest campus-based
institutions in Germany, with a diverse population of
5,300 members. This population comprises 72%
students, 16% academic staff, 8% non-academic
personnel, and 4% professors (UniBw, 2023b). The
student body comprises military officers and civilians
from various regions and countries, primarily aged
20-30, within the middle-income bracket, and
predominantly residing on campus. Approximately
27% of students and 25% of academic staff are female
(UniBw, 2023a).
To meet the transportation needs of this
population, the university recently introduced
"MORE Sharing," a micromobility sharing system
operated by a third-party contractor (evhcle, 2023;
Huber, 2023; MORE Sharing, 2023; Pobudzei,
Kemmerzehl, et al., 2023). Users can book and access
a variety of vehicles via a mobile app, which displays
Pobudzei, M. and Hoffmann, S.
Examining the Impact of Weather, Temporal Factors, and User Traits on Multimodal Shared Micromobility Systems in Non-Urban Campus Environments: The MORE Sharing Case Study.
DOI: 10.5220/0012341900003702
Paper published under CC license (CC BY-NC-ND 4.0)
In Proceedings of the 10th International Conference on Vehicle Technology and Intelligent Transport Systems (VEHITS 2024), pages 193-203
ISBN: 978-989-758-703-0; ISSN: 2184-495X
Proceedings Copyright © 2024 by SCITEPRESS – Science and Technology Publications, Lda.
193

rental prices and automatically selects the most cost-
effective rate based on the rental duration. Users are
also provided with the option of a complimentary
monthly mobility budget after registration and
payment details submission. Additional credits can be
earned by participating in surveys offered by the
service (evhcle, 2023; Pobudzei, Wichmann, et al.,
2023).
MORE Sharing users are not confined to the
operating zone during their rides and can venture
beyond it, with the app offering a park mode for
breaks without terminating the rental. However,
rentals must be concluded within the operating zone,
requiring users to ensure sufficient battery charge for
their return trip (evhcle, 2023). This integrated
multimodal micromobility system, coupled with the
unique offering of a free mobility budget, sets MORE
Sharing apart from other platforms and represents an
area of shared micromobility that has received limited
exploration (Pobudzei, Wichmann, et al., 2023).
This study aims to provide insights into the
utilization patterns and influential factors of shared
micromobility systems, thereby contributing to the
development of sustainable transportation initiatives
in microenvironments like campuses, corporate
landscapes, residential neighborhoods, and non-urban
communities. Specifically, this paper evaluates
metrics such as hourly trip counts, trip durations, and
reservation lengths during the initial months of the
micromobility sharing system's operation on the
university campus.
The analysis considers variables such as weather
conditions, time of day, vehicle type, reservation
duration, and user demographics, considering their
potential impact on these metrics. Advanced
analytical techniques, including Negative Binomial
Regression (NBR), Random Forests (RF), Gradient
Boosted Regression Trees (GBRTs), and Neural
Networks (NN), are employed for this analysis. The
outcomes of this research provide valuable insights
for policymakers, urban planners, and transportation
providers, enhancing shared micromobility system
design and implementation across various settings,
including residential areas and large campus
environments.
2 LITERATURE REVIEW
Shared micromobility systems are becoming
increasingly common in urban areas. However, these
systems are typically single-mode, meaning that each
service provider's app only offers a specific mode of
transport, such as city bikes, e-bikes, e-scooters, e-
cargo bikes, or e-mopeds. Users must register with
multiple providers to access different mobility
options.
Users' demographics for each shared mode of
transport vary depending on the provider and location
(Pobudzei, Wichmann, et al., 2023). For example,
shared city bikes, e-bikes, and e-scooters are more
popular among younger adults and men, while
women and older populations use them less
frequently (NACTO, 2022; Rérat, 2021).
In the United States, e-scooter users and bike
share members typically embark on rides lasting 11-
15 minutes, covering up to 3 kilometers (NACTO,
2022; Younes et al., 2020). Station-based bike share
users usually opt for longer trips, lasting 24-28
minutes and covering approximately 5 kilometers
(NACTO, 2022). However, data on usage patterns for
shared e-cargo bikes and e-mopeds is limited,
indicating a gap in current research (Pobudzei,
Kemmerzehl, et al., 2023).
In Munich, shared e-scooters are most frequently
used on Friday and Saturday afternoons, with longer
trips taken on weekends and holidays than on
workdays (Pobudzei et al., 2022; Schreier et al., 2022;
Tießler et al., 2023). The use of shared e-scooters
witnesses an increase in frequency and duration from
July to November, in contrast to the winter months
(Pobudzei et al., 2022).
Shared city bikes and e-bikes see higher usage
rates on weekdays, especially during peak commute
hours (Fishman, Washington, & Haworth, 2015;
Fishman, Washington, Haworth, et al., 2015; Rérat,
2021; Younes et al., 2020). However, some cities also
witness a surge in usage during lunchtime and
weekends, catering to recreational purposes
(Pobudzei, Wichmann, et al., 2023). Shared e-cargo
bikes are typically used on weekdays for commercial
and delivery purposes (Becker & Rudolf, 2018),
while shared e-mopeds e-mopeds are popular for
weekday commuting and recreational use on
weekends and evenings (Pobudzei, Wichmann, et al.,
2023).
Weather conditions also play a significant role in
the usage of shared micromobility. Extreme
temperatures and adverse weather conditions like
high winds, rain, snow, and other precipitation
discourage users due to safety and comfort concerns
(Gebhart & Noland, 2014; Noland, 2021; Pobudzei et
al., 2022).
Despite the literature on shared micromobility in
urban settings, more research should be conducted on
systems deployed in non-urban settings and
microenvironments such as university or corporate
VEHITS 2024 - 10th International Conference on Vehicle Technology and Intelligent Transport Systems
194

campuses, residential neighborhoods, or non-urban
communities.
This paper addresses this gap by focusing on the
shared micromobility service at the University of the
Bundeswehr in Munich, where users can access
multiple micromobility modes within a single
application. The investigation aims to analyze hourly
trip counts, trip distances, and durations for shared city
bikes, e-bikes, e-cargo bikes, e-scooters, and e-mopeds
within a micromobility sharing system in the campus
environment. The findings of this study could be
helpful in similar environments, thereby expanding the
applicability of shared micromobility systems.
3 DATA AND METHODS
3.1 MORE Sharing Setup and Data
On the 6
th
of March, 2023, the MORE Sharing service
was officially launched and communicated to the
university community via email notification. Soon
after, on the 15
th
of March, a launch event was
organized to introduce potential users to the service.
The event assisted with the app installation, a
comprehensive tutorial on how to use it, and an
introduction to the range of available vehicles.
Additionally, a dedicated webpage with instructional
videos and frequently asked questions was established
and made accessible to help users understand the
service (Huber, 2023; MORE Sharing, 2023).
The MORE Sharing service is only available to
members affiliated with the University of the
Bundeswehr, including students and staff. Upon
registration, users can choose a mobility budget of up
to 300 Euros, automatically renewing monthly. The
unused monthly mobility budget cannot be
transferred to the following months. Users can also
earn extra credits by participating in surveys. The
pricing structure for MORE Sharing is 0.13 Euros per
minute for riding and parking any vehicle, with a
daily cap of 25 Euros. The system applies the most
economical rate, minute-based or daily, depending on
the rental duration. Users can reserve a vehicle for up
to 15 minutes at no cost before starting their ride.
From March to June 2023, MORE Sharing
provided 94 vehicles, including 25 city bikes, 24 e-
bikes, 7 e-cargo bikes, 9 e-mopeds, and 29 e-scooters.
Users can start a ride by scanning a vehicle's QR code
or selecting it directly from the map view in the app.
After confirming the rental, the digital lock is
activated. Users can pause and end their rides using
the MORE Sharing app. For city bikes or e-cargo
bikes, users need to manually secure the lock, while
e-bikes, e-scooters, and e-mopeds use automatic
locking mechanisms. People who want to ride e-
mopeds must have a valid driver's license, which must
be verified within the app, and are required to wear a
helmet.
The MORE Sharing service operates within the
university campus and extends to specific public
transport stops within a 3-kilometer radius. Users can
start or end their rides at these stops. However, they
must finish their trips within the designated
operational area, even if they travel beyond the 3-
kilometer radius. Users can activate the parking mode
if they need to park their vehicles outside the
operational area (MORE Sharing, 2023a; Pobudzei,
Kemmerzehl, et al., 2023).
The MORE Sharing app collects reservation
details such as the reservation time, user ID, vehicle
ID, start and end times of each journey, and the initial
and final mileage readings of the vehicles. Between
March and June 2023, we analyzed the data to
calculate the frequency of trips, distance covered, and
rental duration for each vehicle type hourly. Please
note that the MORE Sharing service was not available
on May 17
th
, 18
th
, and June 24
th
, 2023, due to local
on-campus events.
Apart from the reservation data, we also collected
meteorological data from weather station ID 3,379,
located in Munich City at coordinates 48.16 latitude,
11.54 longitude, and an elevation of 515 meters. This
weather dataset included meteorological parameters
such as wind chill index, relative humidity, and
recorded precipitation levels (DWD, 2023).
3.2 Modeling Methods
The study aims to analyze the patterns of hourly trip
counts, trip distances, and durations observed during
the initial four months of operation of a
micromobility sharing system deployed on a
university campus. The study's main objectives are to
gain insights into user behaviors, evaluate the
system's effectiveness, and comprehensively
understand usage patterns.
In addition to descriptive methods, the study
explored the application of various machine learning
models, including Negative Binomial Regression
(NBR), Random Forests (RF), Gradient Boosted
Regression Trees (GBRTs), and Neural Networks
(NN). The models were trained using 80% of the
dataset and tested on the remaining 20%. The random
seed was set to 42 to ensure consistent results.
The NBR model is suitable for counting data that
shows overdispersion, where the variance exceeds the
mean. It can effectively handle categorical and
Examining the Impact of Weather, Temporal Factors, and User Traits on Multimodal Shared Micromobility Systems in Non-Urban Campus
Environments: The MORE Sharing Case Study
195

continuous predictor variables (Noland, 2021;
Pobudzei et al., 2022).
RF constructs numerous decision trees by
leveraging random data subsets and combines the
predictions of individual trees to produce a final
forecast. This approach mitigates overfitting and
enhances the model's robustness by selecting random
feature subsets for each tree. RF demonstrates
proficiency in handling continuous and categorical
variables, allowing it to model complex non-linear
relationships (Breiman, 2001).
GBRTs adopt an iterative approach, initially
fitting a simple decision tree to the data and then
concentrating on the areas where the model exhibits
weaknesses. These problematic instances are
assigned higher weights, prompting the training of
new decision trees to refine the model's predictions.
GBRTs typically excel when dealing with smaller
datasets, although they demand more computational
resources for training compared to other methods
(Davis, 2014).
Lastly, NN leverages a multilayered architecture
comprising numerous interconnected neurons.
During training, the weights that control the strength
and direction of signal transmission between neurons
are adjusted to enhance the model's predictive
capabilities. NNs are proficient in modeling complex
non-linear relationships and can handle diverse input
data types, including images, text, and numerical
data. It is important to note that they come with higher
computational demands, mainly when applied to
larger datasets (Analytics Vidhya, 2023).
4 RESULTS AND DISCUSSION
By June 2023, the number of registered users for
MORE Sharing had grown to 2,379. There was a
significant surge in registrations during the first three
weeks after the service launch (Figure 1). All
registered users received a monthly mobility budget
of 300 euros that was automatically renewed
monthly. The unused monthly mobility budget cannot
be transferred to the following months. Figure 1
shows that the majority of users fall within their 20s,
and 81.8% of users are male, 17.7% are female, and
0.4% identify as diverse, reflecting the demographics
of the university community.
Between March and June 2023, MORE Sharing
facilitated 25,742 distinct trips, with an average of
approximately 238 daily trips. 66% of registered
users utilized the service during this time, and 1,570
unique customers engaged with the service. Table 1
analyzes the cumulative trip count, distance traveled,
and reservation duration for individual customers
during the periods of March–April 2023 and May–
June 2023. Specifically, during March–April 2023,
1,242 unique customers engaged with MORE
Sharing, while the number increased to 1,333
customers during May–June 2023. Although May–
June witnessed an increase in active customers, some
users who had availed the service in March–April did
not do so in May–June, resulting in a cumulative
count of 1,570 customers encompassing both periods.
During the first two months, customers took an
average of approximately 10.8 trips each. However,
in the following period, the average number of trips
per customer decreased to approximately 9.2. In the
first two months of operation, 75% of customers
made 15 trips or fewer. This number decreased to 12
trips or fewer in the following period. Despite this
trend, some customers used the service much more
frequently than the average. These observations
indicate a broad spectrum of user engagement levels,
behaviors, and preferences, ranging from less active
members to prolific users.
Table 1 shows that the cumulative distance
traveled and reservation duration per customer
increased overall from the first to the second period.
This suggests that users optimize their utilization
within each trip, resulting in an overall increase in
distance covered and reservation duration. A subset
of users covered significantly longer distances in both
periods, indicating potential usage of MORE Sharing
for journeys beyond the immediate campus vicinity.
Additionally, some users preferred reserving vehicles
for extended durations, possibly for activities or
events requiring prolonged mobility. Extended
reservations per customer are also aligned with the
fact that MORE Sharing users had a monthly mobility
budget of 300 euros.
Between March and June 2023, MORE Sharing
boasted a fleet comprising 94 vehicles, encompassing
25 city bikes, 24 e-bikes, 7 e-cargo bikes, 9 e-mopeds,
and 29 e-scooters. To gauge the utilization rates for
each vehicle type, we calculated the ratio of daily
trips to the number of available vehicles of that
particular type (Figure 2). These metrics revealed that
e-scooters were the most frequently utilized vehicle
type within the MORE Sharing system, with e-bikes
closely following (Figure 2). This trend, especially
evident in the initial weeks of system operation,
indicates that e-scooters and e-bikes enjoy heightened
popularity among users, presumably due to their
convenience and ease of use. E-cargo bikes and city
bikes exhibited similar utilization patterns, while e-
mopeds recorded the lowest average utilization
(Figure 2).
VEHITS 2024 - 10th International Conference on Vehicle Technology and Intelligent Transport Systems
196
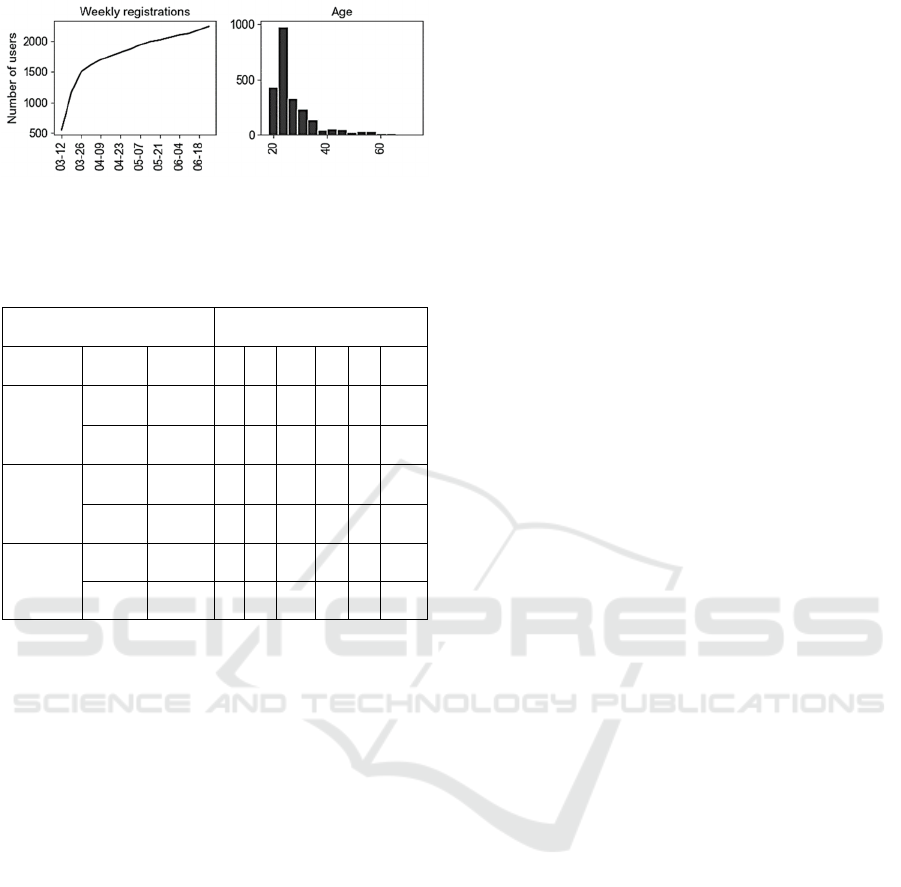
Figure 1: MORE Sharing user registrations and
demographics
Table 1: Cumulative sum of trips, driven distance, and
reservation duration per customer.
Parameters Cumulative sum per customer
Parameter Period
Active
customers
Min 25% Mean 50% 75% Max
Trips
3. -
4.2023
1,242 1 3 10.8 7 15 103
5. -
6.2023
1,333 1 2 9.2 5 12 87
Driven
Distance,
Kilometers
3. -
4.2023
1,242 0.0 5 23 13 31 325
5. -
6.2023
1,333 0.0 4 24 11 29 432
Reservation
Duration,
Minutes
3. -
4.2023
1,242 0.2 34 577 134 419 17,308
5. -
6.2023
1,333 0.3 31 861 145 623 25,897
However, the lower average utilization of e-
mopeds does not mean a lack of popularity. Users
often reserved e-mopeds for extended periods
compared to other vehicle types (Table 2). E-cargo
bikes follow suit, with an average reservation
duration approximately three times shorter than e-
mopeds. E-bikes and e-scooters displayed
comparable average reservation durations, while city
bikes featured the shortest mean reservation duration
(Table 2).
An analysis of driven distances, as presented in
Table 2, indicates that e-mopeds typically cover the
greatest mean distance, implying their use for longer
journeys compared to other vehicle types.
Nonetheless, it is crucial to note that half of the trips
made on e-mopeds are less than or equal to 2
kilometers, suggesting a mix of shorter and longer
trips. E-bikes, e-cargo bikes, and e-scooters exhibit
comparable average distances traveled, while city
bikes demonstrate the lowest mean distance traveled.
Figure 3 offers an overview of trip distribution
across different distance and duration categories for
each vehicle type. Predominantly, short trips in both
duration and distance categories dominate the usage
patterns across all vehicle types within MORE
Sharing. This observation underscores the primary
utilization of the service for brief journeys within the
campus vicinity or nearby areas.
Extended reservation durations do not necessarily
correlate with greater distances traveled, as these
often involve extended idle times rather than
continuous movement (Figure 3). This observation
suggests that users reserve vehicles for longer
durations to accommodate their needs, including
extended breaks or multiple stops during their
journeys, rather than solely focusing on covering
longer distances. E-mopeds, e-cargo bikes, and e-
bikes are utilized for longer distances during longer-
duration rentals (Figure 3), indicating that users
prefer these vehicle types for more extensive journeys
or tasks requiring greater distances.
Kernel density estimate (KDE) plots (Figure 4)
depict the distribution of trips across different
micromobility modes throughout the week and at
various times of the day. Most trips, irrespective of
vehicle type, occur on weekdays, in line with the
primary user base consisting of students, faculty, and
staff members who are more active on campus during
weekdays.
Trip numbers rise between 6 AM and 8 AM,
corresponding to the morning commute on campus.
From 8 AM to 6 PM, the trip counts for all
micromobility modes remain consistently high. After
7 PM, the number of trips declines, indicating
reduced demand during the evening hours when users
likely conclude their campus activities. E-mopeds
exhibit a distinct peak in usage between 1 PM and 6
PM, possibly due to various reasons, such as using e-
mopeds for longer trips, leisure activities, or running
errands during the mid-afternoon period.
The study investigated the effects of time,
weather, user demographics, and vehicle types on
MORE Sharing's hourly trip counts, reservation
duration, and driven distance (Table 3). Results from
the Negative Binomial Regression (NBR) model for
hourly trip counts revealed that precipitation has a
negative impact on the number of shared
micromobility trips (Table 3).
Unfavorable weather conditions or safety
concerns may decrease trip counts during wet
conditions (Table 3). However, parameters like wind
chill index and humidity level did not significantly
affect hourly trip rates. Comparing the number of
trips per hour for different vehicle types (Table 3), it
was found that e-scooters, e-bikes, and city bikes had
higher trip counts compared to e-cargo bikes. This
discrepancy could be attributed to factors such as
vehicle availability or specific use cases contributing
to differences in trip counts.
Examining the Impact of Weather, Temporal Factors, and User Traits on Multimodal Shared Micromobility Systems in Non-Urban Campus
Environments: The MORE Sharing Case Study
197
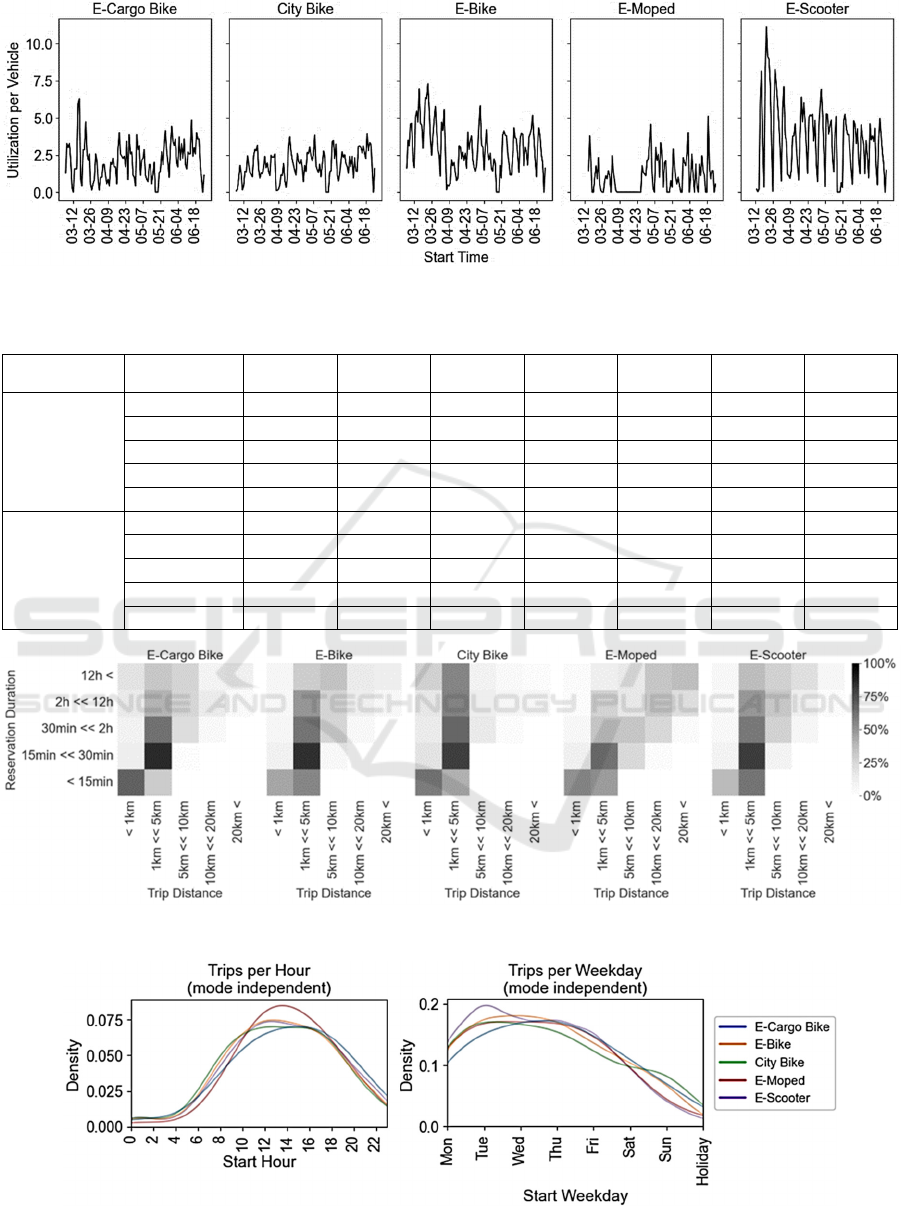
Figure 2: Daily utilization rate per vehicle type.
Table 2: Reservation duration (minutes) and driven distance (kilometers) per vehicle type.
Parameter Vehicle type
Number of
trips
Min 25% Mean 50% 75% Max
Reservation
duration, minutes
City Bike 4,803 0.1 4.3 83.3 8.0 26.8 16,024.7
E-Bike 7,769 0.0 4.3 55.4 8.2 32.2 8,924.7
E-Cargo Bike 1,525 0.1 5.2 95.1 12.2 47.4 4,460.0
E-Moped 977 0.1 2.2 262.1 20.9 107.1 9,796.7
E-Scooter 10,668 0.0 4.4 59.3 8.5 33.5 10,197.8
Trip distance,
kilometers
City Bike 4,803 0.0 0.5 1.6 1.0 1.7 38.5
E-Bike 7,769 0.0 0.8 2.3 1.4 2.6 57.0
E-Cargo Bike 1,525 0.0 0.5 2.3 1.2 2.7 63.5
E-Moped 977 0.0 0.0 5.8 2.0 8.0 58.0
E-Scooter 10,668 0.0 0.9 2.5 1.6 3.0 38.3
Figure 3: Distribution of MORE Sharing trips across different distance and duration categories.
Figure 4: Kernel density plots (mode independent): distribution of MORE Sharing trips.
VEHITS 2024 - 10th International Conference on Vehicle Technology and Intelligent Transport Systems
198
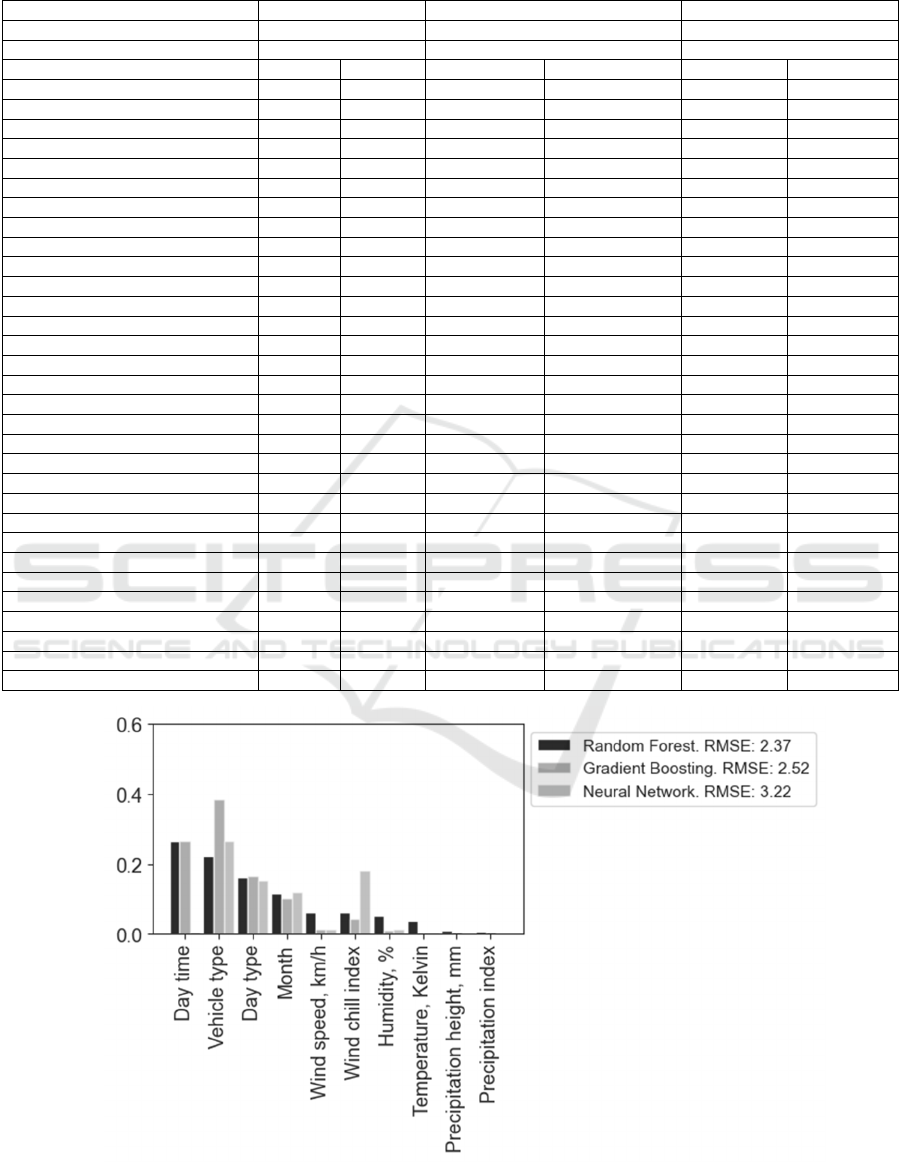
Table 3: Modeling hourly trip counts, reservation durations, and trip distances with Negative Binomial Regression (NBR).
Bolded values indicate statistical significance at p < 5%.
Hourly trip counts Reservation duration, minutes Trip distance, kilometers
N 5,325 20,516 20,516
RMSE 2.63 324.7 3.24
Variable coef z coef z coef z
Vehicle pre-reserved, minutes
0.01 6.86 0.04 16.86
User age
0.02 12.94 0.00 0.11
User registered since, days
0.01 13.20 0.00 -3.60
Female
0.04 1.48 0.07 2.49
Humidity, % -0.01 -0.46 0.00 -0.76 0.00 -0.30
Precipitation index -0.19 -4.44 0.17 9.25 -0.10 -4.36
Wind chill index 0.00 0.81 0.01 33.72 0.00 7.08
E-Bike 0.95 17.00 -0.64 -20.37 -0.01 -0.39
City Bike 0.64 11.21 -0.21 -6.38 -0.39 -9.66
E-Moped 0.11 1.40 0.85 18.34 0.85 16.39
E-Scoote
r
1.32 23.73 -0.53 -17.29 0.07 1.92
3-5AM -0.27 -2.21 0.97 12.70 -0.09 -0.93
6-7AM 0.47 5.06 0.15 2.74 -0.07 -1.03
8-9AM 0.89 10.16 0.05 0.96 0.05 0.75
10-11AM 1.02 11.71 0.17 3.43 0.13 2.20
12AM-1PM 1.12 12.69 0.26 5.22 0.14 2.26
2-3PM 1.02 11.44 0.11 2.09 0.21 3.46
4-5PM 1.06 11.89 0.06 1.18 0.22 3.60
6-7PM 0.93 10.35 0.25 5.00 0.15 2.37
8-9PM 0.54 5.87 -0.02 -0.32 -0.05 -0.83
10-11PM 0.38 4.02 0.12 2.25 -0.18 -2.64
Tuesday -0.06 -1.02 0.01 0.39 -0.07 -2.49
Wednesday -0.09 -1.54 0.18 6.97 -0.04 -1.42
Thursday -0.11 -1.89 0.05 1.82 -0.13 -4.18
Friday -0.15 -2.50 -0.15 -5.67 -0.01 -0.20
Saturday -0.47 -7.38 -0.18 -6.26 0.12 3.34
Sunday -0.67 -9.80 -0.02 -0.58 -0.02 -0.40
Holiday -0.73 -6.14 -0.14 -2.15 0.19 2.61
April, 2023 -0.26 -5.62 0.29 14.82 0.08 3.39
May, 2023 -0.19 -3.55 0.40 16.51 0.11 3.68
June, 2023 -0.32 -5.42 0.53 19.51 0.17 5.25
Figure 5: Feature importance for hourly trip count models
Examining the Impact of Weather, Temporal Factors, and User Traits on Multimodal Shared Micromobility Systems in Non-Urban Campus
Environments: The MORE Sharing Case Study
199

Analysis of the hourly trip rates throughout the
day (Table 3) revealed an increase in trip counts
between 6 AM and 11 AM compared to the period
between 0 and 2 AM. This indicates higher demand
during the morning hours, likely related to
commuting and the start of daily activities. Most
bookings occurred between 12 PM and 5 PM,
reflecting lunchtime and mid-afternoon activities.
After 6 PM, the trip rate started to decline, suggesting
reduced campus activity during the evening hours.
Significantly fewer trips were observed on Fridays,
weekends, and holidays than on Mondays. This pattern
suggests that MORE Sharing experiences reduced
usage during non-working days and weekends when
the campus community may have fewer obligations or
different transportation needs. The first month of
MORE Sharing operations also had more hourly
reservations than subsequent months.
When modeling hourly trip counts, the Random
Forest (RF), Gradient Boosted Regression Trees
(GBRTs), and Neural Networks (NN) models
exhibited similar performance but varied in feature
importance rates (Figure 5). RF placed considerable
importance on parameters such as the time of day
vehicle type, weekday type, and month when
predicting hourly trip counts. GBRTs also considered
vehicle type and time-related parameters as priorities.
NN assigned the highest importance to vehicle type,
followed by the wind chill index, day type, and
month. These disparities in feature importance
highlight the factors influencing trip counts and the
potential of different models to capture and predict
these patterns.
To estimate reservation durations and traveled
distances, additional parameters like pre-reservation
duration in minutes, user age, and the length of user
registration on MORE Sharing were included (Table
3). The NBR model indicated that these factors
played a minor role in predicting reservation duration
in minutes (Table 3). However, reservations made
during rainy weather tended to last longer, suggesting
that users prefer to reserve vehicles for extended
periods when weather conditions are unfavorable,
possibly to allow for flexibility or contingency plans.
E-cargo bikes had longer reservation durations
compared to e-bikes, city bikes, or e-scooters,
implying that users may require more time when
using e-cargo bikes, possibly due to the nature of
transporting goods or engaging in activities that
necessitate the use of e-cargo bikes. E-mopeds had
the longest reservations, potentially for more
extensive trips or specific purposes (Table 3).
Reservations between 3 and 5 AM consistently
exhibited the longest durations, and daytime
reservations generally surpassed those between
midnight and 2 AM (Table 3). Furthermore,
reservations on Fridays, weekends, and holidays
tended to be shorter than on Mondays. The duration
of reservations continuously increased since March
2023, with each successive month showing higher
average reservation durations.
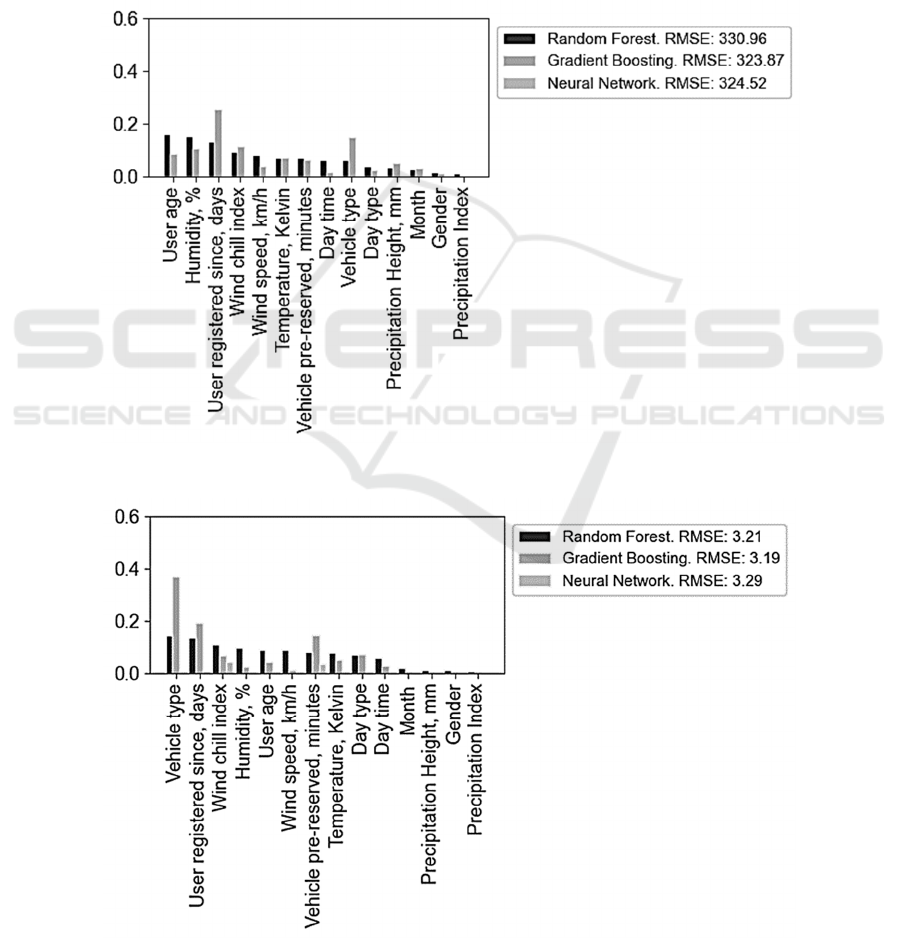
While the Negative Binomial Regression (NBR)
model suggested only minor effects of user age, the
length of user registration, and pre-reservation
duration on predicting reservation durations (Table
3), both the Random Forest (RF) and Gradient
Boosted Regression Trees (GBRTs) effectively
utilized these parameters in predicting reservation
durations (Figure 6). Weather-related parameters
such as humidity and wind chill index also played a
role in predictions, with the wind chill index
demonstrating slightly higher feature importance than
wind speed and temperature parameters alone.
Vehicle type proved to be a relevant factor for RF and
GBRTs in predicting reservation duration, suggesting
that different vehicle types may exhibit distinct usage
patterns that influence the duration of reservations. In
contrast, the Neural Network (NN) model did not
reveal particular features important for predicting
reservation durations.
Concerning driven distances, users who pre-
reserved vehicles tended to cover longer distances
compared to those who made spontaneous reservations
(Table 3). This suggests that individuals who plan their
trips in advance may have specific destinations or
longer journeys in mind, resulting in increased
distances traveled. Additionally, female users traveled
longer distances than their male counterparts,
indicating potential variations in travel patterns,
purposes, or preferences within the MORE Sharing
system. Further exploration is necessary to elucidate
the underlying factors driving these differences.
Distances traveled were generally shorter during
rainy weather conditions (Table 3). This phenomenon
could be attributed to users opting for shorter trips or
seeking sheltered transportation alternatives during
adverse weather. E-cargo bikes were consistently
used for longer distances than city bikes,
underscoring their suitability for transporting goods
or engaging in activities necessitating extended
travel. The longest distances were covered by e-
mopeds, suggesting that users opt for e-mopeds when
they require swift and substantial distance coverage.
These results highlight the advantages of
incorporating multiple vehicle types within a shared
mobility system, as each type caters to distinct
purposes and accommodates a broad spectrum of
travel needs.
VEHITS 2024 - 10th International Conference on Vehicle Technology and Intelligent Transport Systems
200
Distances traveled were higher during daytime
and evening hours than nighttime (Table 3), aligning
with typical travel patterns as users engage in various
daytime activities. On Tuesdays and Thursdays, trips
covered shorter distances, potentially reflecting
specific weekday routines or shorter commutes.
Conversely, trips on weekends and holidays tended to
be more extensive, implying that users engage in
extended leisure activities during these periods.
Overall, the length of trips in kilometers has exhibited
a steady increase since March 2023. Factors such as
increased familiarity with the service, expanded
usage scenarios, or evolving user preferences may
contribute to this observed growth.
RF and GBRTs underscored the significance of
vehicle type and the duration of user registration on
the MORE Sharing platform in predicting the
distance traveled (Figure 7). The wind chill index
emerged as a significant distance predictor,
representing the combined influence of temperature
and wind speed. Additionally, GBRTs factored in
whether the vehicle was pre-reserved, signifying the
impact of this factor on the distance traveled.
Figure 6: Feature importance for reservation duration models.
Figure 7: Feature importance for trip distance models
Examining the Impact of Weather, Temporal Factors, and User Traits on Multimodal Shared Micromobility Systems in Non-Urban Campus
Environments: The MORE Sharing Case Study
201

5 CONCLUSIONS
While shared micromobility systems in urban areas
have been extensively researched, these systems still
need to be studied more in non-urban settings and
smaller contexts, such as university or business
campuses, residential neighborhoods, and non-urban
communities. This study aims to bridge this
knowledge gap by investigating the multimodal
shared micromobility service at the University of the
Bundeswehr in Munich. This unique service allows
users to access multiple micromobility modes
through a single app and offers a complimentary
mobility budget.
Our research focused on tracking hourly trip
metrics, including trip counts, trip lengths, and
reservation times, during the initial four months of
this campus-based micromobility service. We
considered factors, including weather conditions,
time of day and week, lead times for reservations,
user demographics, and various vehicle types such as
shared city bikes, e-bikes, e-cargo bikes, e-scooters,
and e-mopeds. To gain insights into usage patterns,
we employed several machine learning models,
including Negative Binomial Regression (NBR),
Random Forests (RF), Gradient Boosted Regression
Trees (GBRTs), and Neural Networks (NN).
Our findings revealed diverse user engagement
levels, behaviors, and preferences within the MORE
Sharing service. E-scooters emerged as the most
frequently used vehicle type, closely followed by e-
bikes. E-cargo bikes and city bikes exhibited similar
usage rates, while e-mopeds had the lowest average
usage. However, it is essential to note that lower
average usage of e-mopeds does not equate to lower
popularity; users often reserve e-mopeds for extended
periods compared to other vehicle types. E-cargo
bikes follow a similar trend, with e-bikes and e-
scooters having comparable average reservation
times, while city bikes recorded the shortest
reservation durations. E-mopeds covered the most
extended distances, with e-bikes, e-cargo bikes, and
e-scooters showcasing similar average travel
distances, while city bikes covered the least distance.
These findings underscore the benefits of offering
multiple vehicle types within a shared mobility
system, catering to diverse travel needs and purposes.
Our research also highlighted that most trips,
regardless of vehicle type, occur on weekdays.
Furthermore, reservations on Fridays, weekends, and
holidays tend to be shorter in duration compared to
Mondays but involve longer distances during
weekends and holidays. The peak in the number of
trips typically falls between 6 AM and 8 AM, remains
high from 8 AM to 6 PM for all micromobility modes,
and decreases after 6 PM. Reservations between 10
AM and 7 PM generally exhibit the most extended
reservation times and travel distances.
We observed more hourly reservations during the
initial month of MORE Sharing operations than in
subsequent months. However, since March 2023,
both reservation durations and travel distances have
steadily increased, with each new month surpassing
the previous month's average reservation duration.
Rainy weather decreased the number of shared
micromobility trips and the distances traveled.
However, during rainy periods, reservations tend to
last longer. Users who reserve vehicles in advance
tend to cover greater distances than those who make
spontaneous reservations. On average, female users
travel farther than their male counterparts.
This research underscores the significance of
understanding local contexts and community needs
when implementing shared micromobility systems in
non-urban settings. Policymakers, urban planners,
and transportation providers can leverage these
insights to enhance the design and implementation of
shared micromobility systems in various
microenvironments, such as campuses, residential
neighborhoods, and corporate settings. This study
contributes to the broader objective of promoting
sustainable transportation initiatives and
environmentally friendly mobility options across
diverse settings. Examining and optimizing shared
micromobility solutions in various contexts can pave
the way for more efficient and accessible mobility
solutions.
ACKNOWLEDGEMENTS
This research is part of the project MORE – Munich
Mobility Research Campus. The project is funded by
dtec.bw – Digitalization and Technology Research
Center of the Bundeswehr. dtec.bw is funded by the
European Union –NextGenerationEU. We want to
thank eVhcle (Richard Kemmerzehl, Christoph
Ulusoy, Bastian Biener, Constantin Mossgraber, and
Zeeshan Zahoor) for their successful cooperation in
the MORE Sharing project.
REFERENCES
Analytics Vidhya. (2023). Regression Analysis Using
Artificial Neural Networks.
Becker, S., & Rudolf, C. (2018). Exploring the Potential of
Free Cargo-Bikesharing for Sustainable Mobility.
VEHITS 2024 - 10th International Conference on Vehicle Technology and Intelligent Transport Systems
202

GAIA - Ecological Perspectives for Science and
Society, 27(1), Article 1. https://doi.org/10.14512/
gaia.27.1.11
Breiman, L. (2001). Random Forests (45). 45, Article 45.
https://doi.org/10.1023/A:1010933404324
Davis, J. (2014). Gradient Boosted Regression Trees for
Forecasting Daily Solar Irradiance from a Numerical
Weather Prediction Grid Interpolated with Ordinary
Kriging.
DWD. (2023). Weather and Climate in Munich.
evhcle. (2023). FAQs MORE Sharing. https://evhcle.com/
faqmoreshare
Fishman, E., Washington, S., & Haworth, N. (2015).
Bikeshare’s impact on active travel: Evidence from the
United States, Great Britain, and Australia. Journal of
Transport & Health, 2. https://doi.org/10.1016/
j.jth.2015.03.004
Fishman, E., Washington, S., Haworth, N., & Watson, A.
(2015). Factors influencing bike share membership: An
analysis of Melbourne and Brisbane. Transportation
Research Part A Policy and Practice, 71, 17–30.
https://doi.org/10.1016/j.tra.2014.10.021
Gebhart, K., & Noland, R. (2014). The impact of weather
conditions on bikeshare trips in Washington, DC.
41(6), 1205–1225. https://ideas.repec.org/a/kap/transp/
v41y2014i6p1205-1225.html
Groen, G. (2009). Wind chill equivalent temperature
(WCET) Climatology and scenarios for Schiphol
Airport.
Huber, R. (2023). Mobilität der Zukunft: Der richtige Mix
ist entscheinend. Mobile Faszination, 3.
MORE Sharing. (2023). MORE Sharing für die Universität
der Bundeswehr.
NACTO. (2022). Shared Micromobility in the US: 2020-
2021. https://nacto.org/wp-content/uploads/2022/12/
2020-2021_shared_micro_snapshot_Dec7_2022.pdf
Noland, R. B. (2021). Scootin’ in the Rain: Does Weather
Affect Micromobility? Transportation Research Part
A: Policy and Practice, 149, 114–123. https://doi.org/
10.1016/j.tra.2021.05.003
Pobudzei, M., Kemmerzehl, R., Ulusoy, C., & Hoffmann,
S. (2023). Beyond the City: Testing Shared
Micromobility with MORE Sharing. 25th Euro Working
Group on Transportation Meeting (EWGT 2023),
Santander.
Pobudzei, M., Sellaouti, A., Tießler, M., & Hoffmann, S.
(2022). Riders on the Storm: Exploring Meteorological
and Temporal Impacts on Shared E-Scooters (SES) in
Munich, Germany. 1–6. https://doi.org/10.1109/
ISC255366.2022.9922429
Pobudzei, M., Wichmann, I., & Hoffmann, S. (2023).
Unlocking the Wheel: Insights into Shared
Micromobility Perceptions and Adoption on Campus.
9th International Conference on Vehicle Technology
and Intelligent Transport Systems (VEHITS 2023).
Rérat, P. (2021). The rise of the e-bike: Towards an
extension of the practice of cycling? Mobilities, 16(3),
Article 3. https://doi.org/10.1080/17450101.2021.1897
236
Schreier, H., Sellaouti, A., Tiessler, M., Pobudzei, M.,
Hoffmann, S., Hager, A., Hericks, K., Grimm, C., &
Brümmer, M. (2022). Evaluierung der verkehrlichen
Wirkungen von E-Tretrollern. Landeshauptstadt
München.
https://muenchenunterwegs.de/content/1423/download
/220530-bericht-eva-et-final-web.pdf
Tießler, M., Pobudzei, M., Sellaouti, A., & Hoffmann, S.
(2023). Electric Scooters and Where to Find Them—A
Spatial Analysis of the Utilization of Shared E-Scooter
in Munich, Germany.
UniBw. (2023a). Die zivile Gleichstellungsstelle der UniBw
M. Gleichstellung. https://www.unibw.de/gleich
stellung
UniBw. (2023b). Karriere an der Universität der
Bundeswehr München.
Younes, H., Zou, Z., Wu, J., & Baiocchi, G. (2020).
Comparing the Temporal Determinants of Dockless
Scooter-share and Station-based Bike-share in
Washington, D.C. Transportation Research Part A:
Policy and Practice, 134, 308–320. https://doi.org/
10.1016/j.tra.2020.02.021
Examining the Impact of Weather, Temporal Factors, and User Traits on Multimodal Shared Micromobility Systems in Non-Urban Campus
Environments: The MORE Sharing Case Study
203
