
Students Want to Experiment While Teachers Care More About
Assessment! Exploring How Novices and Experts Engage in Course
Design
Atezaz Ahmad
1 a
, Jan Schneider
1 b
, Marcel Schmitz
3 c
, Daniel Schiffner
1 d
and Hendrik Drachsler
1,2 e
1
DIPF - Leibniz Institute for Research and Information in Education, Frankfurt, Germany
2
Institute for Computer Science, Goethe University, Frankfurt, Germany
3
Zuyd University of Applied Sciences, Heerlen, Netherlands
Keywords:
Learning Analytics, Learning Design, Learning Activities, Indicators, Pedagogies, Discourse Analysis,
Thematic Analysis, Co-Designing, Comparative Study.
Abstract:
Learning Design (LD) is the strategic orchestration of educational components to create a rewarding experi-
ence for students and educators. Adapting it to real-world scenarios with evolving technologies, like learning
analytics (LA), adds complexity but offers the potential for enhanced learning outcomes and engagement.
Prior research highlights the growing importance of LA in informing LD decisions. The FoLA
2
method of-
fers a collaborative approach to course design considering LA implications. This study pursues two primary
objectives. Firstly, to enhance the FoLA
2
method by granting course designers access to the Open Learning
Analytics Indicator Repository (OpenLAIR) that facilitates visual connections between LD pedagogies, LD-
LA activities, LA indicators and their metrics. Secondly, to explore how novice and expert groups utilize the
FoLA
2
methodology to design a course in Technology Enhanced Learning. The findings indicate that Open-
LAIR aided both groups while designing the course. Moreover, findings show that the design of novice and
expert groups aligns at a fundamental level on how theory needs to be communicated and then diverges in the
practical application of it where novices prioritized pedagogy and activity design, while experts focused more
on data harvesting and LA application.
1 INTRODUCTION
Learning design is about planning and creating a
learning experience that works well for both students
and teachers. It has the potential to optimize pedagog-
ical efficacy and learner outcomes, while simultane-
ously enhancing student engagement and satisfaction
(Deterding et al., 2011; Harrington et al., 2014). A
professional Learning Design (LD) involves defining
the appropriate pedagogies, selecting relevant learn-
ing activities and their interactions, organizing the
course content and learning materials, choosing suit-
able assessment methods, evaluating the course out-
comes, and adopting the appropriate technologies
a
https://orcid.org/0000-0003-4894-8258
b
https://orcid.org/0000-0001-8578-6409
c
https://orcid.org/0000-0002-1816-6178
d
https://orcid.org/0000-0002-0794-0359
e
https://orcid.org/0000-0001-8407-5314
(Schmitz et al., 2022). Designing an effective and
adequate course is thus not trivial and requires pro-
fessional training. It becomes even more complex
when a course is brought into practice and faces vari-
ous stakeholder needs and conditions in the field. The
challenges increase when we introduce new methods
and technologies, like Learning Analytics (LA) to the
design for learning (Zhu et al., 2018).
The integration of LA and LD has increasingly be-
come a focal point in research. It is recognized that
the efficacy of LA is contingent upon the availability
of rich contextual information, which is partially in-
formed by LD and empirical evaluations of previous
courses and cohorts (Banihashem et al., 2022; Ah-
mad et al., 2022a; Drachsler, 2023). The results of
this research can be observed in various instruments,
such as the work of Gruber (Gruber, 2019) that intro-
duced LD-Cards by adding LD-LA activities to LD
events, other initiatives such as LA-Deck (Alvarez
Ahmad, A., Schneider, J., Schmitz, M., Schiffner, D. and Drachsler, H.
Students Want to Experiment While Teachers Care More About Assessment! Exploring How Novices and Experts Engage in Course Design.
DOI: 10.5220/0012537900003693
Paper published under CC license (CC BY-NC-ND 4.0)
In Proceedings of the 16th International Conference on Computer Supported Education (CSEDU 2024) - Volume 1, pages 15-26
ISBN: 978-989-758-697-2; ISSN: 2184-5026
Proceedings Copyright © 2024 by SCITEPRESS – Science and Technology Publications, Lda.
15

et al., 2020), and general co-creation tools (Vezzoli
et al., 2020).
Notably, studies like (Mangaroska and Giannakos,
2018; Nguyen et al., 2022) have further emphasized
the role of how LA informs LD decisions in online
education. In traditional face-to-face educational en-
vironments, such instances are comparatively rare. In
this context, the FoLA
2
method by Schmitz et al.
(Schmitz et al., 2022; Schmitz et al., 2023) stands
out as a novel approach that enables teachers, stu-
dents, and advisors to collaboratively design effective
courses while considering the implications of using
LA for the course. For example, if you want to de-
sign a course in Mathematics that exploits the benefits
of Learning Analytics and Learning Technologies it
is recommended to involve all stakeholders (teachers,
students, technology advisors, assessment specialists,
study coaches and more) either by getting them in
the co-design session or play their role during the co-
design. The FoLA
2
method provides a systematic ap-
proach to enable this (Schmitz et al., 2022; Schmitz
et al., 2023). However, optimizing the educational
outcomes of a course derived from the FoLA
2
method
requires participants to possess an in-depth grasp of
the possible synergies between LD and LA, knowl-
edge that most stakeholders might not have. Thus,
as an initial objective in this research, we investigated
the potential for augmenting the FoLA
2
method by of-
fering course designers access to the Open Learning
Analytics Indicator Repository (OpenLAIR) of LA
indicators for their learning activities (Ahmad et al.,
2022b). For example, OpenLAIR can show LA tech-
niques that have already been tested and used to in-
fer the student’s motivation when solving a specific
Mathematical problem. OpenLAIR offers a visual
depiction and assistance of the interconnections be-
tween previously researched LA indicators, LD-LA
activities, and LD pedagogies.
The employment of appropriate instruments of-
ten streamlines the creative process. For instance,
while pencils and oil paints serve as enablers for artis-
tic creation, their mere possession does not guarantee
the production of a masterpiece like the Mona Lisa.
Analogously, we do not anticipate uniform outcomes
in LD among different course designers utilizing the
FoLA
2
methodology. Therefore, a secondary objec-
tive of this study involves a comparative analysis of
how two distinct groups employ FoLA
2
in the design
of an identical learning course. To achieve the dual
objectives outlined for this research, we conducted an
empirical investigation involving two distinct cohorts:
a group of novice Educational Technology students
and a group of expert staff members. Both groups
were tasked with designing an Educational Technol-
ogy lecture utilizing the FoLA
2
methodology, aug-
mented by the OpenLAIR. The study was guided by
the subsequent research questions (RQs):
• RQ1: How do novices and experts in the field of
Educational Technologies utilize the OpenLAIR
while following the FoLA
2
method?
• RQ2: In terms of the thematic focus, what are
the main similarities and differences between the
novice and expert groups during the design of a
course utilizing FoLA
2
with the OpenLAIR?
• RQ3: In terms of discourse, what are the main sim-
ilarities and differences between the novice and
expert groups during the design of a course utiliz-
ing FoLA
2
with the OpenLAIR?
2 BACKGROUND
2.1 Learning Design with Learning
Analytics
Since the early 2000s, LD has gained prominence,
with the IMS Global Learning Consortium leading
the development of a standardized framework. This
framework aims to coordinate learning activities and
resources for enhanced interoperability and reusabil-
ity in education. LD involves deliberate planning
and organization of instructional materials, activities,
and assessments to facilitate effective learning expe-
riences. It fosters pedagogical innovation, student en-
gagement, and achievement, aligning with construc-
tivist principles. By integrating technology and con-
sidering diverse learner needs, effective LD empow-
ers educators to create engaging, learner-centered en-
vironments, promoting deep understanding and skill
acquisition (Laurillard, 2013).
LA has the potential to play a pivotal role in
supporting LD in assessment by providing instruc-
tors with data-driven insights that inform and en-
hance the assessment process (Greller and Drachsler,
2012; Gaševi
´
c et al., 2016). Reflecting on the de-
sign and gathering feedback from students for itera-
tive improvements is crucial (de Quincey et al., 2019).
Therefore, LA and LD are two related fields that help
create effective and engaging hybrid (face-to-face and
online) courses (Lockyer and Dawson, 2011).
Numerous research studies have explored poten-
tial links between LA and LD. For instance, (Ver-
poorten et al., 2007; Leclercq and Poumay, 2005) pre-
sented a framework demonstrating how LA can en-
hance LD, particularly in the context of case-based
learning scenarios. Additionally, studies by (Bakharia
CSEDU 2024 - 16th International Conference on Computer Supported Education
16

et al., 2016; Martin et al., 2016) introduced frame-
works in which LA serves to inform educators about
the effectiveness of their course LD strategies. (Mar-
tin et al., 2016) argued that the process of data col-
lection and analysis, based on the Quality Matters
framework, supports educators in evaluating their LD
practices. A study by (Blumenstein, 2020) empha-
sized that aligning students’ learning activities with
their learning outcomes yields positive effects on stu-
dent learning, fostering collaborative and self-reliant
learning skills. A study by (Ahmad et al., 2022a) in-
troduced a framework that uses and aligns LD-LA ac-
tivities and provides/recommends LA indicators and
their metrics to assess users in the application of LA,
based on their selection of LD-LA learning activities.
A structured and learner-centered approach us-
ing LD principles helps educators design effective
courses. The approach requires clear learning ob-
jectives and aligned pedagogical approaches (Biggs
et al., 2022; Brady et al., 2010). It analyzes the
needs and characteristics of the learners by identify-
ing sequenced learning activities (Dunn and Dunn,
1992) and incorporates appropriate technology and
resources (Bates and Poole, 2003). Within a well-
designed learning experience, assessments should
align seamlessly with the stated learning objectives,
offering both formative and summative evaluation op-
portunities (Suskie, 2018). This learner-centric ap-
proach ensures that course design is effective, engag-
ing & conducive to meaningful learning experiences.
It is challenging for educators alone to follow a
learner-centric approach and design a course where
both teachers and students equally benefit from its
outcomes because everyone has different expectations
and perspectives (Beatty, 2019; Schmitz et al., 2017).
Therefore, it is important for course designers to col-
laboratively communicate with students when design-
ing a curriculum (Raes et al., 2020; Weitze et al.,
2013). Previous studies (Alvarez et al., 2020; Vez-
zoli et al., 2020) suggested the collaboration of all
the stakeholders when designing a course that ben-
efits everyone. As a result, such student-centric de-
signs will enhance engagement, motivation, learning
experiences, and learning outcomes and will greatly
increase transparency, satisfaction, and retention (De-
terding et al., 2011; Harrington et al., 2014). Further-
more, these designs promote a collaborative and in-
clusive educational experience that benefits both stu-
dents and instructors (Bergmark and Westman, 2016).
Participatory methods such as FoLA
2
by Schmitz et
al. (Schmitz et al., 2022; Schmitz et al., 2023), pro-
vide stakeholders with timely feedback helping to un-
derstand the consequences of choices, and encourag-
ing them to adjust their views (Sitzmann, 2011), thus
making them suitable to co-design a course.
2.2 The FoLA
2
Method & OpenLAIR
The FoLA
2
Method: The (Fellowship of Learn-
ing Activities and Analytics) FoLA
2
(Schmitz et al.,
2022; Schmitz et al., 2023) method is designed to
facilitate the creation of effective learning activities
while proactively considering the integration of tech-
nology and LA within the design process. FoLA
2
offers an interactive and educational framework that
immerses participants in a simulated environment, en-
abling a deeper exploration of the principles and prac-
tices of LA and learning technologies.
Through FoLA
2
, users engage in collaborative,
critical analysis and informed decision-making, al-
lowing them to navigate the complexities of designing
impactful learning activities for a course enriched by
data-driven insights. This method empowers users to
assume various roles and perspectives, tackle design
challenges, and harness analytics to enhance educa-
tional practices.
FoLA
2
comprises eight sequential steps. First, it
begins with role assignments and guiding questions.
Second, participants discuss and choose a learning
activity and select student and teacher cards that de-
pict the target group. Third, participants discuss the
possible challenges and organizational requirements
that they should consider during the designing and
planning phase. Fourth, subsequently, participants
evaluate various types of learning activities and
make a choice regarding pedagogy. Fifth, during the
development phase, participants decide on interaction
sequences and consider the Learning Enhancing
Technologies (LETs) for each interaction type. Sixth,
they identify LA indicators for each interaction,
determine measurement tools, and specify data
elements (LA metrics). Seventh, the choices in steps
5 and 6 are evaluated through simulation, assessing
alignment with the characteristics of the target
group and allowing for changes if needed. Finally,
participants may adapt their selections based on
simulation outcomes. The organization of the steps
and decisions of the users are regulated by a central
board, where participants place cards to keep track of
their decisions.
OpenLAIR: To further amplify the capabilities
of FoLA
2
and facilitate the selection of pedagogies,
learning activities, and the identification of LA
indicators, we introduce a OpenLAIR
1
. OpenLAIR
is designed to assist individuals in the process of
choosing relevant LA indicators for certain learning
1
https://edutec-tool.github.io/
Students Want to Experiment While Teachers Care More About Assessment! Exploring How Novices and Experts Engage in Course Design
17

activities in order to measure the learning process
effectively and evidence-based.
The data and insights within the OpenLAIR are
rooted in a literature review undertaken by (Ahmad
et al., 2022a). This thorough review involved the
manual extraction of data from 161 relevant LA pa-
pers published over a decade. The outcomes of
this literature review revealed promising synergies
between learning activities in LD and LA, bridging
these two domains. In addition, to assess the function-
ality and practical utility of OpenLAIR, an evaluation
study (Ahmad et al., 2022b) was undertaken with the
participation of experts. Tools such as LAxplore and
information harvester are developed to keep Open-
LAIR updated automatically (Ahmad et al., 2023).
OpenLAIR is a web-based application that offers
users a structured approach to select evidence-based
indicators tailored to educational practices, facilitat-
ing the integration of LA into their courses based on
LD principles. This tool systematically and categori-
cally organizes various instruments related to LD and
LA. These instruments include LD events or peda-
gogies (e.g., exploring or creating), LD-LA activities
(e.g., watching or writing), LA indicators (e.g., en-
gagement or self-regulation), and their corresponding
LA metrics (e.g., time or initiative). For example,
OpenLAIR can be used in the following way: in a
Mathematics course the teacher want students to fol-
low the Practice LD-Event. To practice, students will
do an Exercise as a LD Activity. For this LD Activity,
the teacher wants to see the student’s self-efficiency.
To get the self-efficiency indicator, OpenLAIR will
show the data (metrics e.g. time spent) needed to be
collected in order to infer it.
3 RESEARCH METHODOLOGY
The current study took place in the context of a
Technology-Enhanced Learning lecture at the Goethe
University Frankfurt. Bachelor and Master students in
Computer Science, Bioinformatics, and Business in-
formatics are allowed to participate in the lecture and
receive six ECTS credits. The lecture runs through
the whole semester where students every week learn
about different topics such as learning theories, intel-
ligent tutoring systems, LA, etc. The lecture is run
by the EduTec team members who specialize in dif-
ferent topics of Technology-Enhanced Learning. To
accredit the lecture the students had to conceptualize
and present a Technology-Enhanced Learning solu-
tion, and also pass a written exam.
For this study, there were two different groups of
participants. The first group (novice) consisted of six
students (1 male, 5 females) from the Technology-
Enhanced Learning lecture. Participation in the study
happened almost at the end of the semester, thus the
students were supposed to have a basic understanding
of the topics related to Technology-Enhanced Learn-
ing. For participating in the study, the students re-
ceived five extra points on top of their exam scores.
The second group (expert) of participants consists of
six members of the Technology-Enhanced Learning
staff (1 female and 5 males; 1 Postdoc and 5 Ph.D.
students). For the expert group, participation in the
study was voluntary.
According to (Wiggins and McTighe, 2005), the
extent of staff participating in course design can fluc-
tuate significantly contingent on the context, institu-
tion, and course intricacy. Frequently, course design
materializes as a cooperative task, engaging numer-
ous individuals with diversified roles and competen-
cies. On average, the number of contributors or stake-
holders engaged in course design typically ranges
from five to six individuals. These parties might en-
compass instructional designers, educators, assess-
ment specialists, students, educational technologists
(such as Technology-Enhanced Learning or Learn-
ing Analytics advisors), and educational consultants,
among others. The precise composition of the team is
contingent upon institutional norms and the specific
requirements of the course. Given this experience, we
are confident that involving six participants is suffi-
cient for the lecture’s design.
For each group of participants, we conducted a
FoLA
2
session. The objective of the FoLA
2
session
was to design/improve a lecture in Educational Tech-
nologies. To facilitate and oversee the course design
process using FoLA
2
and OpenLAIR, we appointed
two moderators. The first moderator, acting as the
game master, was responsible for managing FoLA
2
activities. The second moderator assisted the game
master and provided support through the OpenLAIR,
including demonstrations of the tool’s capabilities
during learning events/pedagogies, learning activities,
or LA indicators and their metrics (measurements).
Additionally, the second moderator documented the
progress by capturing images of the FoLA
2
board
approximately every ten minutes. Each member of
both groups has to take a different role in the FoLA
2
method, such as learner, teacher, learning analytics
advisor, technology-enhanced learning advisor, ed-
ucational advisor, instructional designer, assessment
advisor, study coach, and manager.
Each group played the game once, with an aver-
age session duration of 59.5 minutes. The game be-
gan with an introduction and explanation of the rules
by the first moderator. OpenLAIR was introduced as
CSEDU 2024 - 16th International Conference on Computer Supported Education
18

a supportive resource to aid participants in selecting
relevant instruments.
In this study, we incorporated the Eight Learn-
ing Event Model (8LEM) pedagogy, as developed
by Leclercq & Poumay (Verpoorten et al., 2007;
Leclercq and Poumay, 2005), within both the FoLA
2
and OpenLAIR. The 8LEM serves as a widely rec-
ognized pedagogical reference model, aiding educa-
tors and course designers in broadening the spectrum
of learning approaches available to students. This
model encompasses eight distinct learning events:
create, explore, practice, imitate, receive, debate,
meta-learn/self-reflect, and experiment. Furthermore,
we utilized the FoLA
2
board game to design a
Technology-Enhanced Learning course, fostering ef-
fective learning activities with technology and LA in-
tegration. It offers an interactive, educational frame-
work for deepening LA and learning technology un-
derstanding. Additionally, we leveraged OpenLAIR
to provide guidance and assess the choices made
by course designers in selecting relevant instruc-
tional methods. We used one smartphone microphone
placed at the center of the table to record the audio of
the FoLA
2
sessions. Furthermore, we used a second
smartphone to take pictures of the FoLA
2
boards to
document the course development.
We analyzed the pictures from both FoLA
2
boards
transforming them into a tabular format for better rep-
resentation and understanding (see Tables 1, 2, and 3).
Furthermore, for data analysis, we employed the
trial version of the Trint software to transcribe the au-
dio recordings. Subsequent verification, contextual
annotation, and noise reduction were executed within
the Trint software to enhance the accuracy and inter-
pretability of the dialogic transcripts. We further re-
moved the filling words that were meaningless for our
analysis such as “Okay”, “Ahh”, “Umm”, irrelevant
discussions, and a repeat of sentences.
The transcripts were exported as two spreadsheets
(expert and novice). The spreadsheets contained per-
son roles, timestamps, and dialogues. Codes and
group types (expert and novice) were assigned manu-
ally to the spreadsheets.
During the code extraction and assigning process,
ChatGPT 3.5 was used to help and assess in summa-
rizing long (more than two sentences) dialogues into
two to three words. This was performed nine times for
the expert group and six times for the novice group.
The main researcher then reviewed if the extracted
words could be used as a code.
To further assess the reliability of inter-rater
kappa coefficients for the applied codes, we devised
multiple-choice surveys containing 20 randomly se-
lected dialogues/statements from each pool of 335 to-
tal dialogues for the novice group and 303 dialogues
for the expert group. Each dialogue featured two to
five code assignments. For example, if a dialogue
had four code assignments, we introduced four ad-
ditional random codes, resulting in a total of eight
codes, where only four were supposed to be correct.
The raters were then asked to select four codes from
this list (eight codes) for the respective dialogue. If
a dialogue had two correct codes we provided a list
of four codes, where only two were true. Five expert
raters (n=5) were invited to participate in the code as-
signment evaluation.
For the novice group, we obtained an 83% inter-
rater agreement, and for the expert group an 86%
inter-rater agreement. According to Landis & Koch’s
(Landis and Koch, 1977) inter-rater kappa coeffi-
cient, an agreement percentage exceeding 80% is con-
sidered almost perfect. In accordance with Fleiss’
(Fleiss, 1971) criteria, a final value surpassing 75%
is deemed excellent.
To further analyze the data, we applied Epistemic
Network Analysis (ENA) (Shaffer and Ruis, 2017) to
our data using the ENA Web Tool (version 1.7.0). The
ENA algorithm uses a moving window to construct
a network model for each line in the data, showing
how codes in the current line are connected to codes
that occurred previously (Ruis et al., 2019), defined
as 4 lines (each line plus the 3 previous lines) within
a given conversation. For ENA graphs we used the
online ENA tool (app.epistemicnetwork.org).
We have generated two ENA models for both
groups (novice and expert). The first content-based
(thematic focus) ENA model included the follow-
ing codes: Activity, Apply knowledge, Knowledge
gained, Assessment, Constraint, Create event, Debate
event, and more. The second discourse-based model
included the following codes: Agreement, Disagree-
ment, Proposal, Assumption, Irrelevant discussion,
moderation, Reminder, and more. We defined con-
versations as all lines of data associated with a single
value of Groups subsetted by PersonRole.
To provide a clearer visualization for our analysis,
we merged the following codes together: Wearables,
Mind mapping tools, PowerPoint, SmartScreen, and
Virtual reality were merged into “technology adop-
tion”. We also merged all the constraints together
into the category of “constraint”, which includes hy-
brid settings, weather, time, small class, constructive
alignment, and using Moodle. Finally, we merged
peer assessment, final grade, automatic assessment,
self-assessment, peer review, formative assessment,
and exam into “assessment”.
We applied ENA for two different analyses, the
first one regarding the thematic focus of the discus-
Students Want to Experiment While Teachers Care More About Assessment! Exploring How Novices and Experts Engage in Course Design
19

sion (e.g. pedagogies, activities, technologies, etc.)
and the second one regarding the discourse flow (e.g.
asking questions, agreeing, clarifications, etc.).
4 RESULTS
Table 1 provides an overview of the constraints that
emerged during the course design process, as identi-
fied by both the novice and expert groups. Among
these constraints, hybrid settings and the integration
of Moodle into the course design were recognized
as common challenges by both groups. However,
there were divergent perspectives as well. The novice
group emphasized the importance of weather, timing,
and location as significant constraints, factors that
directly impact their engagement and participation.
In contrast, the expert group highlighted the chal-
lenges associated with managing smaller class sizes
and achieving constructive alignment, underscoring
their focus on pedagogical and instructional consid-
erations.
Table 2 provides a comprehensive overview of
the data-sharing agreements and technology adoption
readiness levels among both the novice and expert
groups. The novice group, exhibited a moderate level
of concern when it came to sharing students’ and
teachers’ data, and they displayed a strong willing-
ness to embrace new technologies. In contrast, the ex-
pert group expressed a high degree of openness from
teachers to share data. These findings highlight vari-
ations in data-sharing attitudes while emphasizing a
shared readiness for technology integration.
Table 3 provides insights into the pedagogical
choices made by both the novice and expert groups.
Notably, the novice group employed four distinct ped-
agogies, whereas the expert group opted for three.
Both groups concurred on the use of ’Receive’ and
’Practice’ pedagogies. It’s evident that the novice
group exhibited a stronger inclination towards fos-
tering experimentation and facilitating discussions to
apply the knowledge acquired during the lecture. In
contrast, the expert group demonstrated a preference
for engaging in the creation and construction of ideas
presented in the lecture.
Table 4 offers a detailed analysis of the utiliza-
tion and preference for learning activities, pedago-
gies, interaction types, LETs, and LA tools among
both novice and expert groups. The table was com-
piled based on photographs taken of the final results
of the FoLA
2
board.
In Table 4, the "Interaction types" column illus-
trates the flow of interactions associated with a spe-
cific learning activity. For instance, it clarifies the ini-
Table 1: Possible constraints set for the lectures.
Constraints Explanation N E
Hybrid
setting
Course is online and in-person. ✔ ✔
Moodle as
LMS
Course is fully accessible and
participable via Moodle.
✔ ✔
Weather Course is accessible regardless
of weather.
✔ –
Time and
place
Course is accessible anytime,
anywhere & without time limits.
✔ –
Small
class
Course design should ensures
low student numbers do not af-
fect learning objectives.
– ✔
Constructive
alignment
Course design must align learn-
ing outcomes, assessment meth-
ods, & teaching activities to sup-
port effective learning.
– ✔
*LMS = Learning Management System
Table 2: Novice-expert group data provision and technol-
ogy adoption agreement level.
Group Subject Data & Technology L M H
Novice Student Share data – ✔ –
Technology adoption – – ✔
Novice Teacher Share data – ✔ –
Technology adoption – – ✔
Expert Student Share data – ✔ –
Technology adoption – – ✔
Expert Teacher Share data – – ✔
Technology adoption – – ✔
*L=low *M=medium *H=high
tiator of each activity. The first interaction in Table 4,
denoted as "teacher to learner" in the first row, signi-
fies that a teacher is responsible for conveying knowl-
edge to the learners. The "LETs" column provides ad-
ditional details regarding the technology employed to
facilitate each proposed activity, including tools like
SmartScreens and video clips. Meanwhile, the "LA
indicators" column highlights the potential LA indi-
cators, such as resource usage awareness and learning
patterns, that could prove valuable for assessing and
presenting the outcomes of the learning experiences.
Table 4 reveals a blend of similarities and dif-
ferences in the selection of learning activities by
Table 3: Novices and experts pedagogy usage.
Events Explanation N E
Receive Students receive content from
the teacher
✔ ✔
Debate Discuss knowledge through so-
cial interaction
✔ –
Experiment Students learn by doing and han-
dling objects
✔ –
Practice Exercise/repeat skills to improve ✔ ✔
Create Design or construct something – ✔
*N = Novice *E = Expert
CSEDU 2024 - 16th International Conference on Computer Supported Education
20
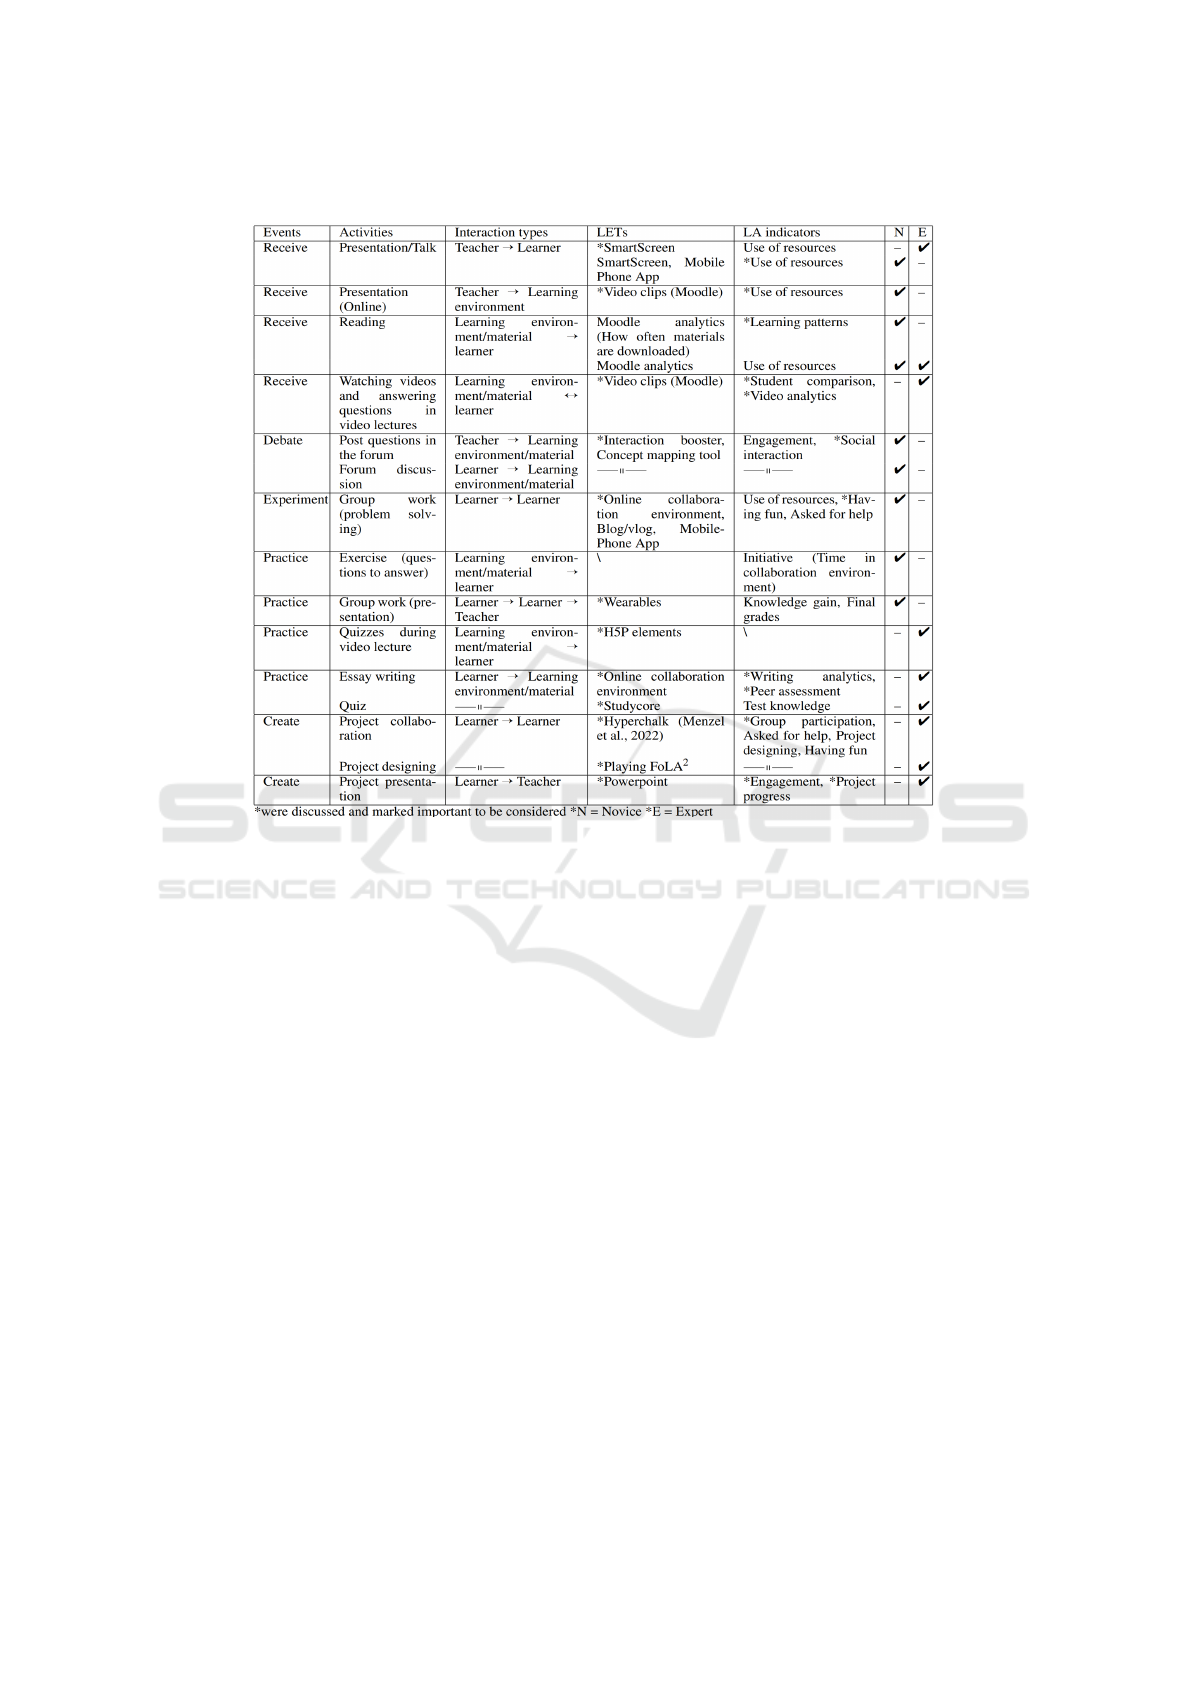
Table 4: Novices and experts LD-LA instruments and technologies usage.
both groups. Both the novice and expert groups
proposed common options like presenting, reading,
group work, watching videos, and quizzes. How-
ever, noteworthy distinctions emerge, with the novice
group favoring forum discussions while the expert
group leaned toward essay writing and project design
as part of the course design process. The same obser-
vation extends to LETs and LA indicators. Common-
alities included the utilization of SmartScreens and
video clips (within Moodle) as technological tools.
Additionally, there was a shared emphasis on LA
indicators such as video analytics, resource usage
awareness, engagement, online collaboration, and the
measurement of having fun. When examining the
recordings, both groups initially proposed the "hav-
ing fun" indicator, signifying that the novice group
proposed to derive enjoyment from activities like ex-
perimentation or project development. However, the
expert group did not attribute significant importance
to this indicator. In contrast, the novice group deemed
it essential and engaged in further discussion. Ulti-
mately, the novice group reached a consensus that the
degree of engagement could serve as a measurable
metric for assessing the level of enjoyment in learn-
ing activities.
LETs such as interaction boosters and wearables
were exclusively suggested by the novice group,
whereas H5P Moodle elements and engaging with
FoLA
2
were proposed by the expert group. In terms
of LA indicators, the novice group introduced con-
cepts like social interaction and learning patterns,
while the expert group brought forward ideas such as
student comparison and peer assessment.
To compare the thematic focus between the novice
and expert groups we used ENA (see Figure 1).
Along the X axis, a two sample t test assum-
ing unequal variance showed Novice (mean=-0.33,
SD=0.15, N=8 was statistically significantly differ-
ent at the alpha=0.05 level from Experts (mean=0.33,
SD=0.13, N=8; t(13.55)= -9.54, p=0.00, Cohen’s
d=4.77). Along the Y axis, a two sample t test as-
suming unequal variance showed Novice (mean=0,
SD=0.30, N=8 was not statistically significantly dif-
ferent at the alpha=0.05 level from Experts (mean=0,
SD=0.40, N=8; t(12.93)= 0.00, p=1.00, Cohen’s
d=0.00).
Figure 1 illustrates that the novice group dis-
plays a stronger preference for a course design em-
phasizing experimentation, (forum) discussion activ-
ities, debates, and exercises. This orientation high-
lights their inclination toward collaborative problem-
solving discussions and practical knowledge applica-
Students Want to Experiment While Teachers Care More About Assessment! Exploring How Novices and Experts Engage in Course Design
21

tion. In contrast, the expert group showed a prefer-
ence for a comparable learning activity but adopted a
distinct approach. Instead of experiments and weekly
exercise-centered lectures, they proposed a project-
based course structure. Under this approach, students
would select a project in groups at the beginning of
the course and collaborate on it throughout the lec-
ture, culminating in a final project presentation at the
course’s conclusion. Additionally, the course will
have more feedback and quiz activities.
To delve deeper into the utilization of the Open-
LAIR by both groups, we conducted an analysis
and identified multiple instances where the Open-
LAIR was referenced (see Figure 1). Notably, the
expert group referenced the topic of the OpenLAIR
43 times, whereas the novice group referenced it 37
times throughout the dialogue analysis. ENA in Fig-
ure 1, reveals that the expert group exhibited a greater
association between OpenLAIR and LA, OpenLAIR
and Data collection, OpenLAIR and Assessment, and
more. In contrast, the novice group displayed more
pronounced associations between OpenLAIR and Ex-
periment event, OpenLAIR and Exercise, OpenLAIR
and Discussion activity, OpenLAIR and Forum activ-
ity, among others. In summary, these findings sug-
gest that the expert group predominantly employed
the OpenLAIR to discuss data collection and the ap-
plication of LA, whereas the novice group tended to
focus on LD-related topics.
When examining the recordings we noticed an in-
teresting observation concerning the thematic focus
of the analysis. The novice group exhibited a greater
degree of experimentation by modifying the order of
events (pedagogies) three times after initially placing
the cards and their associated activities. In contrast,
the expert group never placed a card before reaching
a consensus and never changed the order of the cards.
The novice group placed a total of 32 cards, in-
cluding everything (events, interactions, etc.) which
took them 50 minutes to finish the task. In contrast,
the experts placed 27 cards and took them 69 minutes.
Figure 2 presents the ENA depicting discourse
analysis within both the novice and expert groups.
Along the X axis, a two sample t test assum-
ing unequal variance showed novice group (mean=-
0.20, SD=0.08, N=8 was statistically significantly
different at the alpha=0.05 level from expert group
(mean=0.20, SD=0.09, N=8; t(13.95)= -9.36, p=0.00,
Cohen’s d=4.68). Along the Y axis, a two sample t
test assuming unequal variance showed novice group
(mean=0.00, SD=0.51, N=8 was not statistically sig-
nificantly different at the alpha=0.05 level from expert
group (mean=0.00, SD=0.42, N=8; t(13.46)= 0.00,
p=1.00, Cohen’s d=0.00).
In the context of discourse analysis, the expert
group demonstrated a prevalence of codes related to
Assumptions (23 for experts vs. 6 for the novice
group) and Discussions (40 vs. 24) during proposal
development, resulting in a higher frequency of Dis-
agreements (11 vs. 5). Conversely, the novice group
posed more Questions (30 for novice vs. 19 for ex-
perts) and generated slightly more Idea proposals (41
vs. 36 for experts) concerning technology, activities,
and indicators. This led to a greater degree of Idea
elaboration (34 vs. 17) in comparison to the expert
group. Additionally, the novice group displayed a
slightly higher level of uncertainty (Unsure) (12 vs. 7
times for experts) when agreeing with peers or seek-
ing clarification through questions. Codes such as
Agreements (59 for novice vs. 56 for experts), An-
swers (17 vs. 19 for novice), and Objections (14 vs.
11 for novice) exhibited similar frequencies between
the two groups.
Another noteworthy finding from the discourse
analysis is the prevalence of irrelevant discussions
within the expert group. During various stages of the
session, such as making assumptions, raising objec-
tions, proposing ideas, agreeing with others, or ask-
ing questions, the expert group frequently engaged
in discussions unrelated to the current task at hand.
These discussions often revolved around personal ex-
periences or past lectures, which were not directly rel-
evant to the ongoing task. As a result, the moderator
needed to intervene three times during the session to
redirect the discussion back to the primary topic.
For the expert group, we can observe strong as-
sociations between Assumption and Discussion, Pro-
posal and Assumption, Agreement and Irrelevant
discussion, Agreement and Objection, and Agree-
ment and Clarification. For the novice group, we
see stronger associations between Proposal and Idea
Elaboration, Agreement and Reminder, Reminder and
Proposal, Discussion and Idea Elaboration, and Ques-
tion and Moderation.
To sum up, the expert group displayed a pattern
characterized by a higher frequency of Assumptions,
Discussions, and Disagreements, indicating their ten-
dency to engage in in-depth discussions. In contrast,
the novice group exhibited more Questions, Idea pro-
posals, and Idea elaboration, suggesting their active
exploration of topics. novices also showed slightly
more uncertainty. The expert group had a tendency
for irrelevant discussions, leading to moderator inter-
vention. Strong associations were found between cer-
tain codes within each group.
An intriguing observation within the novice group
is the active but mostly silent role of the student des-
ignated as the instructional designer. This individual
CSEDU 2024 - 16th International Conference on Computer Supported Education
22
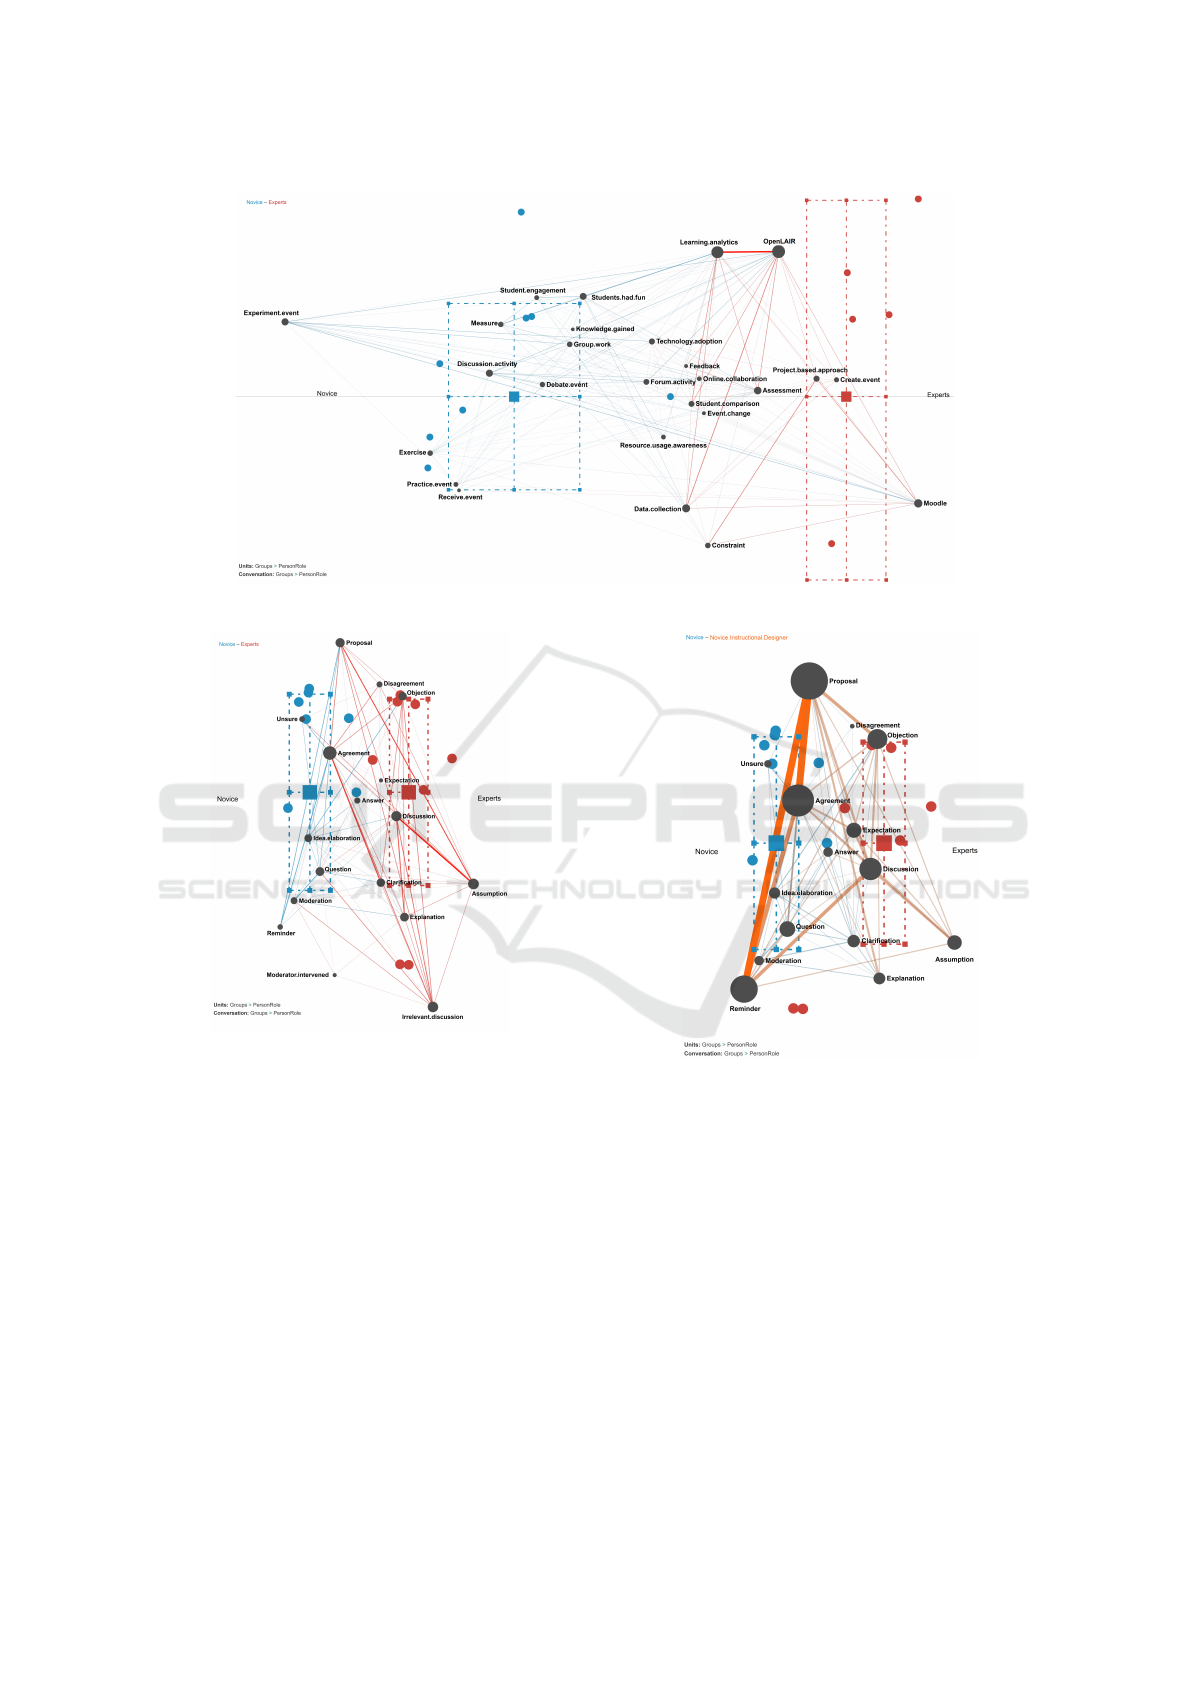
Figure 1: Thematic-based ENA for novice and expert groups.
Figure 2: Discourse analysis for both groups.
consistently intervened to emphasize critical aspects
in the proposals made by peers, particularly in rela-
tion to the initial lecture constraints that needed to be
upheld during the design process (refer to Figure 3).
5 DISCUSSION & CONCLUSION
RQ1 examines the usage of the OpenLAIR while
playing FoLA
2
within novice and expert groups. Our
findings indicate that both groups extensively utilized
OpenLAIR during their participation in FoLA
2
. Both
of them utilized all the LD-LA instruments of the
OpenLAIR. Nonetheless, the ENA analysis, as de-
picted in Figure 1, sheds light on the differing ap-
proaches employed by these groups. The expert group
Figure 3: Instructional designer in the novice group.
predominantly employed OpenLAIR for the applica-
tion of LA and data collection and the novice group
utilized it more for LD instruments selection, thereby
addressing our initial research question.
This discrepancy can be elucidated by disparities
in knowledge levels, a phenomenon well-documented
in the literature (Siebert-Evenstone et al., 2017).
Within the domain of course design, experts typically
possess a deep and nuanced understanding of LD, bol-
stered by years of experience and a wealth of domain-
specific knowledge (Chi et al., 1981). This expertise
instills in them a sense of confidence in their LD deci-
sions, prompting a preference for relying on their own
well-honed judgment rather than resorting to external
Students Want to Experiment While Teachers Care More About Assessment! Exploring How Novices and Experts Engage in Course Design
23

repositories. Experts primarily used OpenLAIR in
pedagogical knowledge for implementing LA, seek-
ing well-established and tested solutions to derive ac-
tionable insights into student performance and behav-
ior (Siemens and Long, 2011). Conversely, novices,
who have a less comprehensive grasp of LD activities,
tend to depend more on the LD instruments available
in the OpenLAIR. Their limited expertise led them to
perceive the OpenLAIR as a valuable tool for scaf-
folded support and guidance in navigating the com-
plexities of LD (Shulman, 1987).
This variation in approach may also be attributed
to differences in motivation and priorities, an exten-
sively acknowledged occurrence within the field of
educational psychology (Ko et al., 2020). The ex-
pert group, comprising seasoned researchers and ed-
ucators, exhibited a strong interest in obtaining high-
quality data, aligning with their commitment to data-
driven decision-making, a perspective that has been
highlighted in prior research (Peer et al., 2014). Their
primary objective was to enable data-driven decision-
making, which would ultimately contribute to the im-
provement of learning outcomes (Siemens and Long,
2011). Their commitment to the improvement of
learning experiences was deeply rooted in their pro-
fessional roles and responsibilities. In contrast, the
student participants were primarily driven by extrin-
sic motivations (Ryan and Deci, 2022). Their focus
was directed toward transforming the course into a
more appealing, engaging, and enjoyable educational
experience (Deterding et al., 2011). Their priorities
aligned with their expectations and preferences for a
learning environment that transcended mere effective-
ness, emphasizing interactivity and fun.
RQ2 delves into the similarities and disparities ob-
served in the choice of various LD-LA instruments,
constraints, data sharing, technology adoption, and
utilization between the two groups. Both the expert
and the novice groups stated the relevance of a hybrid
setting to make the course as accessible as possible.
Furthermore, the design of both groups highlights the
Receive and Practice pedagogies fundamental for the
course.
When looking at the differences the most appar-
ent one is that the novice group highlighted the rele-
vance of the Debate pedagogy and focused a signifi-
cant amount of their effort on designing how to imple-
ment the Experiment pedagogy in order to assimilate
the already received theory. In contrast, the expert
group focused more on the Create pedagogy in order
for students to rehearse the received theory and de-
liver a project for teachers to assess.
This variance can be explained by the inherent dif-
ferences in perspective and approach between novice
and expert groups, a phenomenon widely recognized
in educational research (Chi et al., 1981). novices of-
ten have fewer constraints and a propensity to think
innovatively and beyond conventional boundaries. In
our study, the novice group, unburdened by precon-
ceived notions of time constraints and course logis-
tics, viewed experimentation as an exciting, valuable,
and enjoyable endeavor. They were open to explor-
ing unconventional ideas and approaches. In contrast,
the expert group’s perspective was influenced by their
extensive experience and practical knowledge (Erics-
son and Lehmann, 1996). They were acutely aware of
the potential challenges and logical intricacies associ-
ated with experimentation, which led them to adopt a
more pragmatic stance. Rather than seeking novel so-
lutions, the experts focused on optimizing and adapt-
ing existing pedagogical practices within the course.
This dichotomy is in line with the findings of Chi
et al. (Chi et al., 1981), which suggest that novices
often exhibit more exploratory behavior, while ex-
perts tend to rely on established schemas and domain-
specific knowledge. In our study, the experts’ deci-
sion to incorporate peer assessment as a new learning
and assessment activity exemplified their inclination
toward refining established practices. These findings
highlight the importance of considering both novice
and expert viewpoints in the design and implementa-
tion of educational interventions.
Another notable difference in terms of the the-
matic focus is the number of cards discussed and
thus placed by the novice and the expert group where
the novice group in less time discussed roughly 15%
more cards. We argue that an explanation for this can
be identified in the findings of our discourse analysis
RQ3.
RQ3 is about the differences between the novice
and expert groups in terms of their discourse while
playing FoLA
2
. To answer this question, our findings
reveal distinct communication patterns and behaviors
exhibited by both groups during the proposal and con-
sensus development phase. These patterns shed light
on the nature of their interactions, the prevalence of
specific discourse elements, and the degree of engage-
ment in the collaborative process.
The expert group demonstrated a higher preva-
lence of codes related to Assumptions and Discus-
sions. This indicates that they engaged in extensive
discussions regarding underlying assumptions and de-
liberated more extensively on the proposed ideas.
This emphasis on assumptions and discussions among
experts led to a higher frequency of Disagreements,
suggesting a more critical evaluation of ideas within
the group. These findings align with the notion that
experts often possess a deeper understanding of the
CSEDU 2024 - 16th International Conference on Computer Supported Education
24

subject matter and are more likely to scrutinize as-
sumptions and engage in robust discussions. Con-
versely, the novice group displayed a different dis-
course pattern. They posed more Questions and
generated slightly more Idea proposals, leading to
a greater degree of Idea elaboration. This suggests
that novices may rely on questioning and idea gener-
ation as a means to understand the topic better and
contribute creatively. The higher frequency of un-
certainty (Unsure) in the novice group indicates their
willingness to seek clarification and engage in a more
exploratory discourse (Morrison, 2006).
The presence of irrelevant discussions within the
expert group, as indicated by the discourse analy-
sis, raises important considerations for collaborative
problem-solving sessions. Our findings suggest that
these discussions, often centered around personal ex-
periences or past lectures, detracted from the effi-
ciency of the collaborative process. The phenomenon
of irrelevant discussions within expert groups is not
unique to this study. Irrelevant discussions, often
stemming from personal experiences or tangential
topics, can indeed impact the efficiency and effective-
ness of collaborative efforts (Hoffman, 1987). Such
deviations from the primary task can lead to time inef-
ficiencies and may hinder the achievement of the ses-
sion’s objectives.
Future collaborative endeavors may benefit from
a proactive approach to managing such discussions to
enhance productivity and achieve desired outcomes.
The findings presented in this study provide in-
sights into the distinguishing factors of significance
between expert and novice practitioners. These find-
ings underscore the critical importance of revisiting
the course design process and actively involving stu-
dents in its co-creation. Such a collaborative approach
holds the potential to yield mutual benefits and en-
hance overall educational outcomes.
This study presents three primary limitations. Ini-
tially, there exists the possibility of minor human er-
rors or oversights during the transcription, analysis,
and coding phases. Secondly, the intricate and ever-
evolving nature of course design can create difficul-
ties for individuals in maintaining strict adherence to
their designated roles (e.g., Teacher or Instructional
Designer), also highlighted in educational literature
(Stasser et al., 1995). This challenge may arise from
factors such as varying interests, diverse experiences,
interpersonal dynamics, multifaceted responsibilities,
pedagogical shifts, and other factors identified in prior
studies (Ko et al., 2020). Thirdly, we only examined
one expert and one novice group pointing out the im-
portance of being cautious when trying to generalize
the insights obtained in this study.
REFERENCES
Ahmad, A., Schneider, J., Griffiths, D., Biedermann, D.,
Schiffner, D., Greller, W., and Drachsler, H. (2022a).
connecting the dots–a literature review on learning an-
alytics indicators from a learning design perspective.
Journal of Computer Assisted Learning.
Ahmad, A., Schneider, J., Schiffner, D., Islamovic, E., and
Drachsler, H. (2023). Laxplore: An nlp-based tool for
distilling learning analytics and learning design instru-
ments out of scientific publications. pages 230–239.
Ahmad, A., Schneider, J., Weidlich, J., Di Mitri, D., Yau,
J. Y.-K., Schiffner, D., and Drachsler, H. (2022b).
what indicators can i serve you with? an evaluation of
a research-driven learning analytics indicator reposi-
tory. In CSEDU ’14, pages 58–68. SciTePress.
Alvarez, C. P., Martinez-Maldonado, R., and Bucking-
ham Shum, S. (2020). La-deck: A card-based learning
analytics co-design tool. In LAK ’10, pages 63–72.
Bakharia, A., Corrin, L., De Barba, P., Kennedy, G., Gaše-
vi
´
c, D., Mulder, R., Williams, D., Dawson, S., and
Lockyer, L. (2016). A conceptual framework linking
learning design with learning analytics. In LAK ’6.
Banihashem, S. K., Noroozi, O., van Ginkel, S., Mac-
fadyen, L. P., and Biemans, H. J. (2022). A systematic
review of the role of learning analytics in enhancing
feedback practices in higher education. ERR.
Bates, T. and Poole, G. (2003). Effective teaching with tech-
nology in higher education: Foundations for success.
Beatty, B. (2019). Hybrid-flexible course design. EdTech
Books London, UK.
Bergmark, U. and Westman, S. (2016). Co-creating curricu-
lum in higher education: Promoting democratic values
and a multidimensional view on learning. IJAD.
Biggs, J., Tang, C., and Kennedy, G. (2022). Ebook: Teach-
ing for Quality Learning at University 5e. McGraw-
hill education (UK).
Blumenstein, M. (2020). Synergies of learning analytics
and learning design: A systematic review of student
outcomes. Journal of Learning Analytics, 7(3):13–32.
Brady, K. P., Holcomb, L. B., and Smith, B. V. (2010). The
use of alternative social networking sites in higher ed-
ucational settings: A case study of the e-learning ben-
efits of ning in education. JIOL, 9(2).
Chi, M. T., Feltovich, P. J., and Glaser, R. (1981). Cate-
gorization and representation of physics problems by
experts and novices. Cognitive science, 5(2):121–152.
de Quincey, E., Briggs, C., Kyriacou, T., and Waller, R.
(2019). Student centred design of a learning analytics
system. In LAK ’9, pages 353–362.
Deterding, S., Dixon, D., Khaled, R., and Nacke, L. (2011).
From game design elements to gamefulness: defining"
gamification". In MindTrek ’15, pages 9–15.
Drachsler, H. (2023). Towards highly informative learning
analytics.
Dunn, R. S. and Dunn, K. J. (1992). Teaching elementary
students through their individual learning styles: Prac-
tical approaches for grades 3-6.
Students Want to Experiment While Teachers Care More About Assessment! Exploring How Novices and Experts Engage in Course Design
25

Ericsson, K. A. and Lehmann, A. C. (1996). Expert and ex-
ceptional performance: Evidence of maximal adapta-
tion to task constraints. Annual review of psychology.
Fleiss, J. L. (1971). Measuring nominal scale agreement
among many raters. Psychological bulletin.
Gaševi
´
c, D., Dawson, S., Rogers, T., and Gasevic, D.
(2016). Learning analytics should not promote one
size fits all: The effects of instructional conditions in
predicting academic success. IHE, 28:68–84.
Greller, W. and Drachsler, H. (2012). Translating learning
into numbers: A generic framework for learning ana-
lytics. ET&S, 15(3):42–57.
Gruber, M. (2019). Designing for great teaching with
learning design cards. UZH philosophy facultydigital
teaching and research.
Harrington, K., , et al. (2014). Engagement through part-
nership: Students as partners in learning and teaching
in higher education.
Hoffman, R. R. (1987). The problem of extracting the
knowledge of experts from the perspective of exper-
imental psychology. AI magazine, 8(2):53–53.
Ko, A., Pick, C. M., Kwon, J. Y., Barlev, M., Krems, et al.
(2020). Family matters: Rethinking the psychology of
human social motivation. PPS, 15(1):173–201.
Landis, J. R. and Koch, G. G. (1977). The measurement of
observer agreement for categorical data. biometrics,
pages 159–174.
Laurillard, D. (2013). Teaching as a design science: Build-
ing pedagogical patterns for learning and technology.
Leclercq, D. and Poumay, M. (2005). The 8 learning events
model and its principles (release 2005-1).
Lockyer, L. and Dawson, S. (2011). Learning designs and
learning analytics. In LAK ’11, pages 153–156.
Mangaroska, K. and Giannakos, M. (2018). Learning an-
alytics for learning design: A systematic literature
review of analytics-driven design to enhance learn-
ing. IEEE Transactions on Learning Technologies,
12(4):516–534.
Martin, F., Ndoye, A., and Wilkins, P. (2016). Using learn-
ing analytics to enhance student learning in online
courses based on quality matters standards. Journal
of Educational Technology Systems, 45(2):165–187.
Morrison, D. (2006). Critical thinking in a collaborative
online learning environment. Advanced Technology
for Learning, 3(4):255–262.
Nguyen, Q., Rienties, B., and Whitelock, D. (2022). In-
forming learning design in online education using
learning analytics of student engagement. Open World
Learn, 1:189–207.
Peer, E., Vosgerau, J., and Acquisti, A. (2014). Reputa-
tion as a sufficient condition for data quality on ama-
zon mechanical turk. Behavior research methods,
46:1023–1031.
Raes, A., Detienne, L., Windey, I., and Depaepe, F. (2020).
A systematic literature review on synchronous hybrid
learning: gaps identified. Learning Environments Re-
search, 23:269–290.
Ruis, A., Siebert-Evenstone, A., Pozen, R., Eagan, B., and
Shaffer, D. W. (2019). Finding common ground: a
method for measuring recent temporal context in anal-
yses of complex, collaborative thinking.
Ryan, R. M. and Deci, E. L. (2022). Self-determination
theory. In Encyclopedia of quality of life and well-
being research, pages 1–7. Springer.
Schmitz, M., Scheffel, M., Bemelmans, R., and Drachsler,
H. (2022). Fola 2–a method for co-creating learn-
ing analytics-supported learning design. Journal of
Learning Analytics, 9(2):265–281.
Schmitz, M., Scheffel, M., Bemelmans, R., and Drachsler,
H. (2023). Evaluating the impact of fola2 on learning
analytics knowledge creation and acceptance during
the co-design of learning activities. Interaction De-
sign and Architecture (s), 55:9–33.
Schmitz, M., Van Limbeek, E., Greller, W., Sloep, P., and
Drachsler, H. (2017). Opportunities and challenges
in using learning analytics in learning design. In EC-
TEL 2017, Tallinn, Estonia, September 12–15, 2017,
Proceedings 12, pages 209–223. Springer.
Shaffer, D. and Ruis, A. (2017). Epistemic network analy-
sis: A worked example of theory-based learning ana-
lytics. Handbook of LA.
Shulman, L. (1987). Knowledge and teaching: Founda-
tions of the new reform. Harvard educational review,
57(1):1–23.
Siebert-Evenstone, A. L., Irgens, G. A., Collier, W.,
Swiecki, Z., Ruis, A. R., and Shaffer, D. W. (2017). In
search of conversational grain size: Modeling seman-
tic structure using moving stanza windows. Journal of
Learning Analytics, 4(3):123–139.
Siemens, G. and Long, P. (2011). Penetrating the fog: An-
alytics in learning and education.
Sitzmann, T. (2011). A meta-analytic examination of the
instructional effectiveness of computer-based simula-
tion games. Personnel psychology, 64(2):489–528.
Stasser, G., Stewart, D. D., and Wittenbaum, G. M. (1995).
Expert roles and information exchange during dis-
cussion: The importance of knowing who knows
what. Journal of experimental social psychology,
31(3):244–265.
Suskie, L. (2018). Assessing student learning: A common
sense guide. John Wiley & Sons.
Verpoorten, D., Poumay, M., and Leclercq, D. (2007). The
eight learning events model: A pedagogic conceptual
tool supporting diversification of learning methods.
Interactive Learning Environments, 15(2):151–160.
Vezzoli, Y., Mavrikis, M., and Vasalou, A. (2020). Inspi-
ration cards workshops with primary teachers in the
early co-design stages of learning analytics. In LAK
’10, pages 73–82.
Weitze, C. L., Ørngreen, R., and Levinsen, K. (2013). The
global classroom video conferencing model and first
evaluations. In ECEL ’12, pages 503–510. Academic
Conferences and Publishing International.
Wiggins, G. P. and McTighe, J. (2005). Understanding by
design. Ascd.
Zhu, M., Bonk, C. J., and Sari, A. R. (2018). Instructor ex-
periences designing moocs in higher education: Ped-
agogical, resource, and logistical considerations and
challenges. Online Learning, 22(4):203–241.
CSEDU 2024 - 16th International Conference on Computer Supported Education
26
