
Prediction of the Employee Turnover Intention Using Decision Trees
Ana Živković
a
, Dario Šebalj
b
and Jelena Franjković
c
Faculty of Economics in Osijek, Josip Juraj Strossmayer University of Osijek, Trg Ljudevita Gaja 7, Osijek, Croatia
Keywords: Employee Turnover, Employee Job Satisfaction, Machine Learning, Organizational Commitment.
Abstract: This study examines the effectiveness of Decision Tree methodology in predicting employee turnover
intention, an area in which this method has received limited research. In this paper, primary research was
conducted and four Decision Tree algorithms were applied to a sample of 511 respondents. The study
incorporates several predictor variables into the model, including job satisfaction, perceived organizational
commitment, perceived organizational justice, perceived organizational support, and perceived alternative job
opportunities, to assess their influence on turnover intention. The assessment measure of the model was Recall.
The results indicate that the Decision Tree model using the RandomTree algorithm is relatively successful in
predicting turnover intentions (almost 60% accuracy rate), with job satisfaction, especially opportunities for
personal growth and affective organizational commitment being significant predictors. Other influencing
factors include satisfaction with salary and the job itself, as well as interpersonal relationships. This study
underscores the potential of the Decision Tree method in human resource management and provides a basis
for future research on the role of predictive analytics in understanding employee turnover dynamics.
1 INTRODUCTION
Employee turnover is a phenomenon that has been
studied for more than half a century in more than 3000
published articles by experts, academics and
researchers in the fields of psychology, sociology,
economics and especially behavioural economics. It
is a problem faced by every industry and every
organization, and in some fields, such as medicine, it
is so pronounced that attrition is very often the focus
of polemics in many of the world's scientific medical
journals. The employee turnover intention predicts
actual turnover and is the last measurable step an
organisation can monitor before an employee actually
leaves. Turnover intention can be predicted in several
ways, primarily by observing past behaviour and
current attitudes. Analysing basic attitudes toward the
organisation, which are closely related to work and
the workplace, could predict employees' future
movements.
Predicting employee turnover intention involves
the identification of factors and variables that
contribute to an employee's propensity to leave their
a
https://orcid.org/0000-0002-6469-4377
b
https://orcid.org/0000-0002-8295-7847
c
https://orcid.org/0000-0001-7725-3098
current job or organization. These factors include a
wide range of variables. Analyzing and understanding
the complex interplay of these factors is critical to
developing effective retention strategies and fostering
a supportive work environment that promotes
employee satisfaction and long-term engagement.
In recent years, Decision Tree algorithms have
gained popularity due to their ability to analyze
complex data sets and make predictions. The aim of
this paper is to evaluate the application of Decision
Trees in predicting employee turnover intention and
to assess its effectiveness, limitations and possible
areas of improvement. There are not so many papers
that use the Decision Tree method to predict
employee turnover. Therefore, the objective of this
paper is to determine whether the aforementioned
technique can correctly predict employee turnover,
and more specifically, turnover intention.
We believe that Decision Trees provide a
powerful framework for modeling and predicting
employee turnover intention because they can handle
heterogeneous data sets and capture nonlinear
relationships between predictor variables and
turnover outcomes. In contrast to traditional statistical
Živkovi
´
c, A., Šebalj, D. and Franjkovi
´
c, J.
Prediction of the Employee Turnover Intention Using Decision Trees.
DOI: 10.5220/0012538400003690
Paper published under CC license (CC BY-NC-ND 4.0)
In Proceedings of the 26th International Conference on Enterprise Information Systems (ICEIS 2024) - Volume 2, pages 325-336
ISBN: 978-989-758-692-7; ISSN: 2184-4992
Proceedings Copyright © 2024 by SCITEPRESS – Science and Technology Publications, Lda.
325

methods, Decision Trees provide intuitive and
easily interpretable decision rules, which makes them
particularly attractive to stakeholders with different
levels of technical expertise, including HR
professionals and organizational leaders. Therefore,
the proposed approach could be suitable for solving
the critical problem of employee turnover.
The rest of the paper is organized as follows:
Section 2 gives an overview of the relevant literature;
Section 3 presents the methodology of the scholarly
research; Section 4 contains the results, while the
final Section 5 provides a discussion, conclusions and
implications.
2 LITERATURE REVIEW
2.1 Decision Trees and Employee
Turnover
In the context of employee turnover, Decision Tree
algorithms have been mainly tested and compared
with some other machine learning methods. For
example, Alaskar et al. (2019) compared the
efficiency of five machine learning methods (Logistic
Regression, Decision Tree, Naïve Bayes, Support
Vector Machines – SVM, and AdaBoost) to predict
employee turnover. The best results were obtained by
the Support Vector Machines (accuracy: 97%) and
the Decision Tree (accuracy: 95%).
Similar methods have used by Asiri and Abdullah
(2019), who attempted to predict employee
absenteeism using three predictive models: Naïve
Bayes, Decision Tree and Random Forest. The
accuracy was 91%, 90%, and 92%, respectively.
Absenteeism was also predicted by Skorikov et al.
(2020), who applied several machine learning
classification algorithms (zeroR, Decision Tree,
Naïve Bayes, and k-Nearest Neighbor – kNN). The
kNN algorithm yielded the highest accuracy of
92.3%. Out of 20 attributes, disciplinary failure is the
most important in predicting absenteeism.
The group of authors (Bao et al., 2017) studied the
turnover of software developers. They applied several
classifiers, including Naïve Bayes, Support Vector
Machines, Decision Tree, k-Nearest Neighbor, and
Random Forest. Random Forest achieved the best
accuracy (79.7%), while Naïve Bayes (0.81) had the
best recall.
Yuan (2021) compared the prediction accuracy of
the five commonly used algorithms – SVM, Random
Forest, Neural Network, Logistic Regression, and
Decision Tree. The SVM model had the best recall
rate (0.950), followed by Neural Network (0.943),
Random Forest (0.934), Decision Tree (0.796), and
Logistic Regression (0.722). The main variables were
Promotional chance, Organizational Commitment,
especially Affective Commitment, and Normative
Commitment. Shah et al. (2020) also compared
several machine learning methods. They proposed
Neural Networks and Deep Learning algorithms that
can predict workplace absenteeism. The results show
that Deep Neural Network had 90.6% performance
compared to 73.3% performance for single layer
Neural Network and 82% performance for Decision
Tree, SVM and Random Forest.
Some authors used a different approach. For
example, de Jesus et al. (2018) used the social
network LinkedIn to predict employees' likelihood of
quitting. They collected professional profiles from
LinkedIn and used them as a source of attributes
about employees’ intention to quit. The most
effective method was the Decision Tree with 88%
accuracy. Gao et al. (2019) presented a new method
based on an improved Random Forest algorithm,
called the Weighted Quadratic Random Forest
algorithm (WQRF). They compared the WQRF with
the Random Forest, C4.5, Logistic Regression, and
Back Propagation algorithms. The results show that
the WQRF algorithm has the best recall metric
(0.653). The most important factors affecting
employee turnover are monthly income, overtime,
age, distance from home, length of service, and
percentage salary increase. Ghazi et al. (2021) used 9
different models to predict employee turnover, with
the Generalized Linear Model, Deep Learning, and
Logistic Regression being the most successful. The
most important attribute was the number of overtime
hours.
There were several studies where the authors used
decision trees exclusively. For example, Girmanova
and Gašparova (2018) used the C5.0, rpart, and ctree
algorithms. Kang et al. (2020) sought to identify
important predictors of turnover intention among
U.S. federal employees. They conducted
Classification and Regression Tree (CART), and the
importance scores of the predictors showed that the
most important attribute was job satisfaction,
followed by satisfaction with the organization,
loyalty, accomplishment etc. The CART model was
also introduced in the study conducted by Singer and
Cohen (2020). Their ordinal CART model can be
used to identify subgroups of employees with specific
absenteeism patterns. The type of Decision Tree
analysis was also used in the study by Ruso et al.
(2021), who employed CHAID Decision Tree
analysis and concluded that education level, career
development activities, type of company ownership,
ICEIS 2024 - 26th International Conference on Enterprise Information Systems
326

type of workplace, and the number of LinkedIn
contacts they gain are the variables that most
influence employee turnover. In the study by Wahid
et al. (2019), four different tree-based machine
learning algorithms were used. They applied Decision
Tree, Gradient Boosted Tree, Random Forest, and
Tree Ensemble to the dataset of a courier company to
predict employee absenteeism at work. Gradient
Boosted Tree produced the best result with 82%
accuracy and Tree Ensemble had the lowest accuracy
(79%).
2.2 Determinants of Employee
Turnover Intention
The independent variables observed for turnover
intention (TI) in this study are job satisfaction (JS),
perceived organizational commitment (POC),
perceived organizational justice (POJ), perceived
organizational support (POS), and perceived
alternative job opportunities (PAJO). Most studies
addressing job satisfaction show a direct negative
correlation between JS and TI, placing JS in a key
position in the decision to leave an organization (Lee
and Liu, 2007; Wright and Bonett, 2007; Cha, 2008;
Holtom et al., 2008; Rahman et al., 2008; Dardar et
al., 2012; Eslami and Gharakhani , 2012; Bryant and
Allen, 2013; Olusegun, 2013; Garner and Hunter,
2014; Pepra-Mensah et al., 2015; Lee et al., 2017).
Organizational commitment emerges as the second
most frequently queried attitude, and all three types
of commitment (affective, continuous, and
normative) have a combined negative effect on TI and
actual turnover (Mowday et al., 1979; Mowday et al.,
1982; Price and Mueller, 1981, 1986; Holtom et al.,
2008; Rahman et al., 2008; Robbins and Judge, 2010;
Bryant and Allen, 2013; Kim and Chang, 2014;
Shuck and Reio, 2014; Robbins and Judge, 2017).
The relationship is the same with respect to POJ. All
three types of justice (distributive justice, formal
justice, and interactional justice) negatively affect TI,
implying that a more positive perception of
organizational justice leads to a lower intention to
leave (Pfeffer and Davis-Blake, 1992; Colquitt, 2001;
Nowakowski and Conlon, 2005; Heavey et al., 2013;
Bee et al., 2014; Yamazakia and Petchdee, 2015;
Grissom et al., 2016; Nawaz and Pangil, 2016).
Furthermore, if employees have a positive perception
of the support the organization offers, their intention
to leave the organization is also lower (Beehr and
Gupta, 1978; Shore and Tetrick, 1991; Tansky and
Cohen, 2001; Allen et al., 2003; Pattie et al., 2006;
Yang et al., 2015).
In addition to all the organizational variables
mentioned above, it is necessary to consider the
external context, and the perceived alternative
employment opportunity has emerged as the most
dominant variable. The greater the perceived
opportunity for employment in another organization
and is seen as a better alternative, the greater will be
TI (Griffeth et al., 2005; Ing-Sa and, Jyh-Huei, 2006;
Rahman et al., 2008; Hausknecht and Trevor, 2011;
Dardar et al., 2012; Saleem and Gul, 2013; Treuren,
2013; Umar et al., 2013; Bee et al., 2014; Muhstaq et
al., 2014; Pepra-Mensah et al., 2015; Saridakis and
Cooper 2016), and further, this will result in increased
actual turnover (Holtom et al., 2008).
3 METHODOLOGY
3.1 Sample, Procedure and Measures
The data were collected by primary field research,
and the method used is the group test method. A
random sample was used, consisting of employees
from 15 different organizations with an average of
more than 50 employees in Croatia. The selected
organizations include production, service and
production-service activities and cover different
sectors of the economy: Agriculture, Industry,
Energy, Construction, Services, Trade,
Transportation, Education, Tourism, and Hospitality.
The sample did not include individuals under the age
of 18, employees on student contracts, volunteers,
and employees who have been with the current
organization for less than 12 months, as this is
considered the minimum time that allows them to
develop a more stable attitude toward the
organization. A total of 544 questionnaires were
collected.
The questionnaire as a research tool consisted of
questions about the sociodemographic components of
the respondents and statements about the observed
variables, the scales of which were taken or adapted
from the following sources:
1) Perceived Organizational Support:
Hayton et al., 2012;
2) Perceived Organizational Justice:
Niehoff, Moorman, 1993;
3) Perceived Organizational Commitment:
Meyer, Allen, 1991;
4) Job Satisfaction: Lee et al., 2017;
5) Perceived Alternative Job Opportunity:
Treuren, 2013;
6) Turnover intention: Yamazakia,
Petchdee, 2015.
Prediction of the Employee Turnover Intention Using Decision Trees
327
Prior to the main study, a pilot study was
conducted on a smaller sample to check the
comprehensibility and clarity of the questionnaire and
to test the reliability of the measurement scales.
All statements, with the exception of the
demographic questions, were measured with a 5-point
Likert scale. Unlike scales measured with 7 or 10
points, it is more appropriate for respondents whose
educational system ranges from 1 to 5, is clearer in
response, and longer scales have not been shown to
increase reliability and validity compared to shorter
ones.
3.2 Decision Trees
Decision trees are a very effective supervised learning
method (Hssina et al., 2014) and a popular data
mining technique for solving classification and
prediction problems. They take a set of classified data
as input and outputs a tree. Decision trees classify
instances by sorting them in the tree from the root to
a leaf node that provides the classification of the
instance. The nodes in a decision tree test a particular
attribute. Leaf nodes provide a classification of all
instances that reach the leaf. If the attribute tested at
a node is a nominal attribute, the number of children
is usually equal to the number of possible values of
the attribute. If the attribute is a numeric attribute, the
test at a node usually determines whether its value is
greater than or less than a given constant, which
results in a split in two directions (Mitchell, 1997;
Witten et al., 2011, Hssina et al., 2014).
The problem of constructing a decision tree can be
formulated recursively. First, an attribute must be
selected at the root node, and a branch must be created
for each possible value. This splits the example set
into subsets, one for each value of the attribute. Now
the process is repeated recursively for each branch,
using only those instances that actually reach the
branch. If at any time all instances at a node have the
same classification, that part of the tree must stop
evolving (Witten et al., 2011). Vandamme (2007)
asserts that the way of finding the attribute that
produces the best split in the data is the one of the
main differences between the various decision tree
algorithms. Decision tree algorithms use different
scales to decide which are the splitting criteria.
In this study, six decision tree algorithms were
used and compared. All algorithms are available in
the data mining tool Weka. According to Witten et al.
(2011), Weka Workbench is a collection of state-of-
the-art machine learning algorithms that includes
methods for the main data mining problems:
Regression, Classification, Clustering, Association
Rules, and Attribute Selection.
J4.8 is the most popular decision tree algorithm
available in Weka. It is the Weka’s implementation of
the famous C4.5 algorithm (Witten et al., 2011). The
C4.5 algorithm was developed by Ross Quinlan in
1992 as an extension of his earlier ID3 algorithm. The
standard splitting criterion used by C4.5 is the gain
ratio, an information-based measure that accounts for
a varying number of test scores (Quinlan, 1996).
The REPTree (Reduced Error Pruning Tree)
algorithm builds a decision or regression tree using
information gain/variance reduction and prunes it
using reduced-error pruning (Witten et al., 2011).
In the RandomForest algorithm, multiple trees are
generated from the values of the samples in the
dataset, and the final result is based on the results of
the majority of the developed trees (Villavicencio,
2021). According to Witten et al. (2011), the
RandomTree algorithm deals with classification and
regression problems. Trees created with RandomTree
test a certain number of random features at each node,
with no pruning.
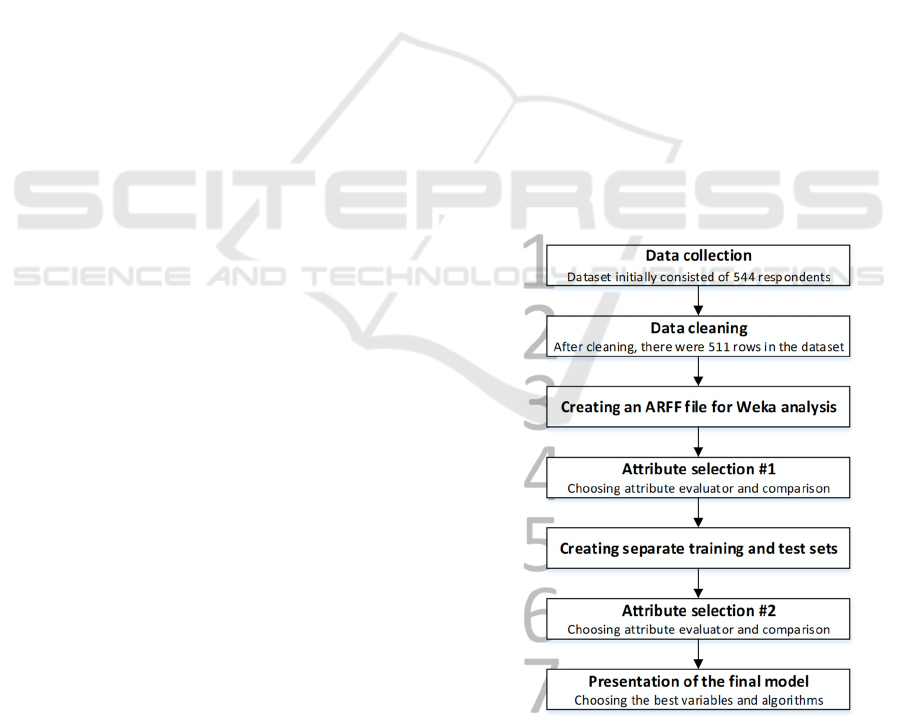
3.3 Research Design
This research was conducted in several main stages,
as shown in Figure 1.
Figure 1: Research design stages.
In the first stage the data were collected, as will be
explained in the next chapter. The initial data set
ICEIS 2024 - 26th International Conference on Enterprise Information Systems
328
consisted of 544 records and 32 variables. Since some
data were missing or incomplete, the data cleaning
phase began. The records where most of the data or
some relevant data were missing (e.g., demographic
data or turnover intention data) have been completely
deleted, while the missing values of the other
variables have replaced by the character “?”. In the
Weka data mining tool, “?” stands for missing values.
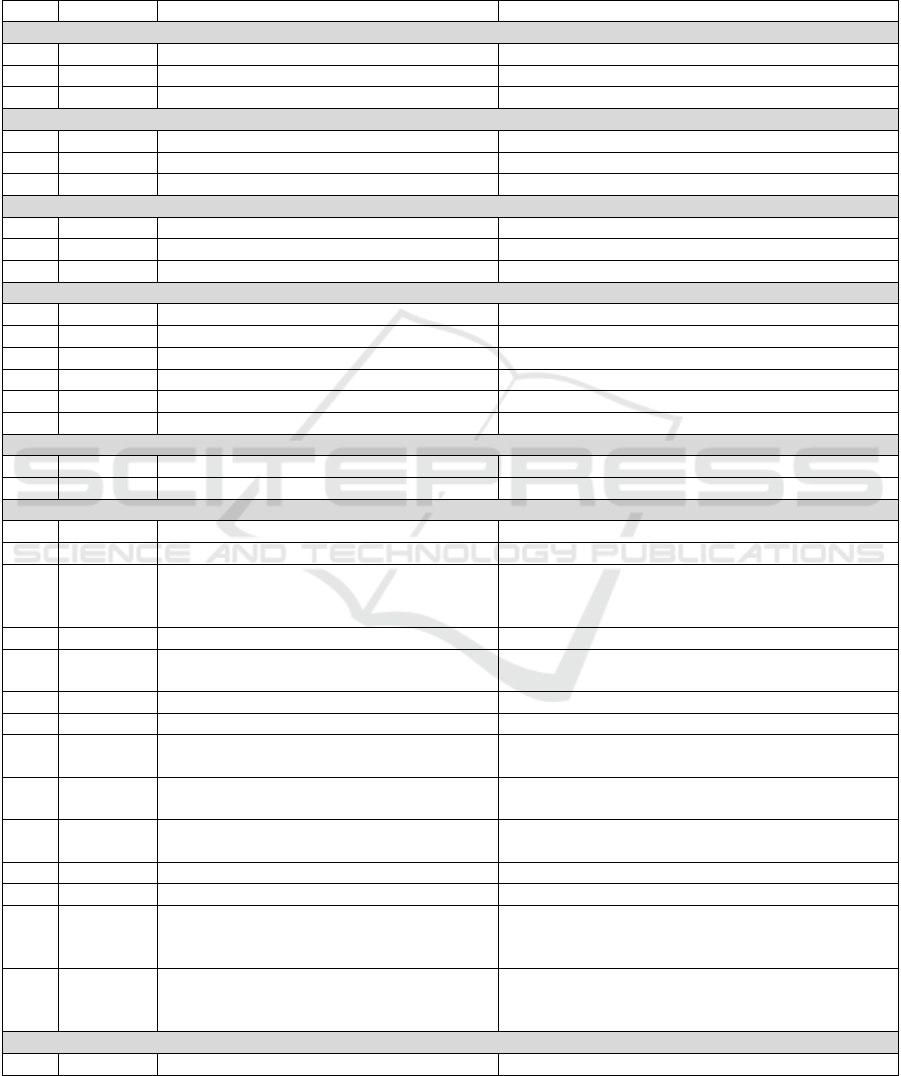
Table 1: Descriptive statistics of the variables.
No. Variable Descri
p
tion Fre
q
uenc
y
/statistics
Perceived Organizational Support
1 B-1 Perceived supervisor support Mean: 3.681; StdDev: 1.144
2 B-2 Perceived co-worker support Mean: 3.534; StdDev: 1.059
3 B-3 Perceived or
g
anizational su
pp
ort Mean: 3.531; StdDev: 1.057
Perceived Or
g
anizational Justice
4 C-1 Distributive justice Mean: 3.491; StdDev: 0.998
5 C-2 Formal justice Mean: 3.482; StdDev: 1.040
6 C-3 Interactional justice Mean: 3.790; StdDev: 1.111
Perceived Or
g
anizational Commitment
7 G-1 Affective commitment Mean: 3.636; StdDev: 1.043
8 G-2 Continuance commitment Mean: 3.169; StdDev: 0.893
9 G-3 Normative commitment Mean: 2.973; StdDev: 1.048
Job Satisfaction
10 Z-1 Salary and welfare Mean: 3.033; StdDev: 1.084
11 Z-2 Work itself Mean: 3.772; StdDev: 0.994
12 Z-3 Leader behavio
r
Mean: 3.695; StdDev: 1.109
13 Z-4 Personal
g
rowth Mean: 3.458; StdDev: 1.053
14 Z-5 Interpersonal relationships Mean: 3.496; StdDev: 0.922
15 Z-6 Job competence Mean: 3.520; StdDev: 0.950
Perceived Alternative Job O
pp
ortunit
y
16 H-1 Alternative
j
ob o
pp
ortunit
y
–
in Croatia Mean: 2.575; StdDev: 1.173
17 H-2 Alternative
j
ob o
pp
ortunit
y
–
abroa
d
Mean: 2.631; StdDev: 1.233
Demographics
18 DM01 Gende
r
Male (52%); Female (48%)
19 DM02 Year of birth Mean: 1977; StdDev: 10.696
20 DM03 Education
Elementary (4,46%); Highschool (54.77%); College
(11.56%); Faculty (24.54%); MA (4.06%); PhD
(
0.61%
)
21 DM04 Place of residence Villa
g
e
(
26.36%
)
; Suburb
(
14.29%
)
; Cit
y
(
59.35%
)
22 DM06
Work experience in the current organization
(
months
)
Mean: 135.472; StdDev: 128.141
23 DM07 Total work ex
p
erience
(
months
)
Mean: 199.65; StdDev: 132.21
24 DM08 Number of em
p
lo
y
ees in the or
g
anization <50
(
0%
)
; 50-250
(
67.74%
)
; >250
(
32.26%
)
25
DM09
a
Number of different organizations employee
worke
d
Mean: 2.770; StdDev: 2.049
26
DM09
b
Form of ownership Public (51.51%); Private (44.47%); State (4.02%)
27 DM10 Level of the workplace
Operative (85.77%); Middle management (12.63%);
To
p
mana
g
ement
(
1.60%
)
28 DM12 Number of the household members Mean: 3.402; StdDev: 1.458
29 DM13 Number of the children under the age of 18 Mean: 0.765; StdDev: 1.037
30 DM14 Personal monthly income (€)
<400 (2.88%); 401-800 (53.50%); 801-1200
(33.95%); 1201-1600 (7%); 1601-2000 (1.44%);
>2000
(
1.23%
)
31 DM15 Total monthly income (€)
<400 (0.82%); 401-800 (13.99%); 801-1200
(30.25%); 1201-1600 (24.28%); 1601-2000
(
17.28%
)
; >2000
(
13.37%
)
Class variable
32 Class Turnover intention YES (15%); NO (85%)
Prediction of the Employee Turnover Intention Using Decision Trees
329
After that, 511 records remained in the dataset. In the
third stage, the final dataset was created in the form
of an .arff file to start the data analysis in Weka. In
the next stage, attribute selection (in Weka) was
performed, searching all possible combinations of
attributes in the dataset to find a subset of attributes
best suited for prediction. For this purpose, the
attribute evaluator must be selected. It determines
which method is used to assign a value to each subset
of attributes (Bouckaert et al., 2016). Each evaluator
available in Weka yielded the best subset of
attributes. In this stage, we tested and compared the
accuracy of the model for each set of attributes using
four different algorithms.
Since the Recall was not satisfactory (only
27.3%), the next stage was to create a separate
training set consisting of the same number of
respondents (50 respondents) who have a turnover
intention and those who do not. The rest of the
respondents were included in the test group.
In the 6th stage, attribute selection was performed
again and repeated on the separate training set. In the
last stage, the final model was tested and the best
variables and algorithms were selected.
4 RESULTS
As mentioned earlier, there were several
measurement dimensions containing items. For the
purposes of this study, an entire dimension was
considered a variable (not the item), so the value of
the dimension was calculated as the average value of
all items in that dimension. All items had a value from
1 to 5. After this calculation, the final data set, as seen
in Table 1, contains 31 input variables (ordered by
measurement dimension).
The variable “Turnover Intention” was taken as an
output variable and expressed as nominal one with
two classes – YES (average value ≥ 3.5) and NO
(average value < 3.5). “Yes” means that employee has
the intention to leave the current job and “No” means
the opposite. Thus, the problem described above
becomes a classification problem.The original dataset
(after data cleaning) used for classification consisted
of 511 respondents, and the evaluation metric of the
model was Recall. This measure refers to a proportion
of actual positive cases that are correctly predicted as
positive. The Recall can be calculated as:
𝑅𝑒𝑐𝑎𝑙𝑙 =
,
where:
TP = true positives cases
FN = false negatives cases
First, the attribute selection was performed. As
explained in Methodology, to perform an attribute
selection process, the attribute evaluator must be
selected. Weka offers several types of attribute
evaluators, and each of them provides a different
subset of attributes that is best suited for prediction.
According to Hall and Holmes (2003), referent
methods of feature (attribute) selection are
Information gain and Relief, while Ganchev et al.
(2006, cited in Oreški, 2014) consider Information
gain and Gain ratio as the best attribute evaluators. In
attribute selection in this paper, 6 methods are
considered: CfsSubset, Classifier, Correlation,
GainRatio, InformationGain and Relief. The
comparison of attribute selection results is shown in
Table 2. The variables are ordered according to their
importance and the values given.
Table 2: Results of the first attribute selection.
Attribute selection evaluator
CfsSubset Classifier Correlation GainRatio InformationGain Relief
B-3 DM15 G-1 (0.397) Z-1 (0.087) G-1 (0.108) DM15 (0.137)
C-1 Z-2 Z-1 (0.324) G-1 (0.083) Z-1 (0.073) DM04 (0.108)
G-1 Z-1 Z-2 (0.301) Z-2 (0.056) Z-4 (0.060) DM03 (0.107)
G-3 Z-3 C-2 (0.265) C-1 (0.049) Z-2 (0.055) DM14 (0.107)
Z-1 G-2 Z-6 (0.255) H-2 (0.045) C-1 (0.049) DM01 (0.096)
Z-2 Z-4 C-1 (0.252) Z-5 (0.045) B-3 (0.048) DM08 (0.089)
Z-4 G-3 Z-3 (0.045) DM09b (0.086)
Z-6 G-1 Z-6 (0.045) G-1 (0.059)
H-2 Z-6 Z-2 (0.056)
B-3 Z-1 (0.052)
ICEIS 2024 - 26th International Conference on Enterprise Information Systems
330
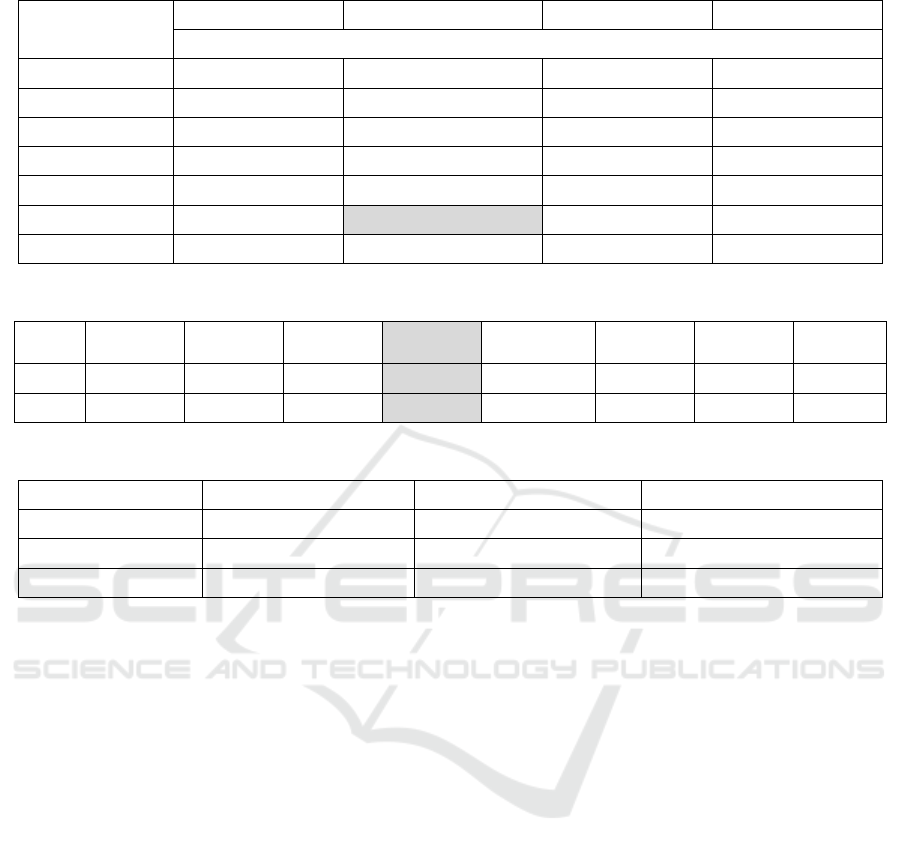
Table 3: Decision tree results on the initial dataset.
Used variables
J48 RandomForest RandomTree RepTree
Total classification rate (Recall)
All variables 82.2% (0.299) 84.5% (0.052) 79.3% (0.221) 84.7% (0.156)
CfsSubset 82.8% (0.221) 83.9% (0.146) 79.5% (0.364) 85.1% (0.091)
Classifier 81.4% (0.208) 84.3% (0.169) 79.7% (0.299) 84.5% (0.078)
Correlation 82.6% (0.169) 83.8% (0.169) 79.7% (0.338) 84.3% (0.117)
GainRatio 84.2% (0.221) 83.9% (0.182) 77.5% (0.325) 83.6% (0.052)
InformationGain 83.4% (0.156) 85.9% (0.273) 78.3% (0.260) 83.9% (0.234)
Relief 82.8% (0.156) 83.6% (0.169) 79.3% (0.325) 85.3% (0.091)
Table 4: Detailed accuracy by class (RandomForest algorithm).
Class TP Rate FP Rate Precision
Recall F-Measure MCC
ROC
Area
PRC
Area
YES
0.273 0.037 0.568
0.273 0.368 0.326 0.811 0.447
NO
0.963 0.727 0.882
0.963 0.921 0.326 0.811 0.957
Table 5: Structure and division of samples.
Sample YES NO Total
Training 50 (50.00%) 50 (50.00%) 100 (100.00%)
Testing 27 (6.57%) 384 (93.43%) 411 (100.00%)
Total 77 (15.01%) 434 (84.93%) 511 (100.00%)
The next step was to test the model. The 7 separate
tests were performed with each of the four algorithms.
One test was performed to test the accuracy and recall
metrics with all 31 input variables, and then six tests
with different variables depending on the results of
the attribute selection. A 10-fold cross-validation was
used for the performance evaluation. The results are
shown in Table 3.
Table 3 shows that the RandomForest algorithm
achieved the highest overall classification accuracy of
almost 86% using 6 input variables suggested by the
InformationGain evaluator (see Table 2). The
accuracy is very high and it seems that this tree can
successfully predict whether an employee will leave
his/her job or not. However, a closer look reveals that
the tree is successful in detecting employees that
don’t have an intention of turnover (96.3%), but this
is not the case when it comes to employees who
intend to leave, where the rate of accurate
classification is only 27.3% (see Table 4).
Since the main objective of this paper is to predict
whether an employee will leave his current
organization, the 27.3% accuracy rate is not
satisfactory. It is suspected that the unequal
representation of employees in the dataset is the
reason for such a low hit rate. Only less than 15% of
employees (77) indicated that they had a turnover
intention.
To make the model more accurate, equal
distribution was considered and the separate training
and test data sets were created. Since the total sample
consists of a larger number of respondents who do not
plan to leave the job, the training sample included 2/3
of the respondents who plan to leave the job, i.e.,
about 50 respondents, and the same number of
respondents who do not plan to leave the job. Thus,
the training sample included a total of 100
respondents, and the test sample consisted of the
remaining 411 respondents. The structure of the
training and testing samples is shown in Table 5.
The next step was to repeat the attribute selection
procedure for the new training set.
The results are shown in Table 6.
The model was retested, creating separate training
and test sets instead of 10-fold cross validation.
The results are shown in Table 7.
Although the J48 algorithm using 10 input
variables selected by the Classifier Attribute
Evaluator provided the best overall accuracy
(78.10%), the highest Recall (0.593) was obtained by
Prediction of the Employee Turnover Intention Using Decision Trees
331

Table 6: Results of the second attribute selection.
Attribute selection evaluator
CfsSubset Classifier Correlation GainRatio InformationGain Relief
B-3 DM15 G-1 (0.441) Z-4 (0.190) Z-4 (0.172) DM08 (0.065)
C-1 Z-2 Z-4 (0.399) Z-2 (0.161) G-1 (0.135) DM14 (0.055)
G-1 Z-1 Z-1 (0.395) Z-1 (0.158) Z-1 (0.131) DM09b (0.055)
G-3 Z-3 Z-2 (0.393) B-3 (0.148) Z-2 (0.113) G-1 (0.050)
Z-1 G-2 B-3 (0.346) G-1 (0.146) Z-5 (0.100) DM04 (0.049)
Z-2 Z-4 Z-5 (0.334) G-3 (0.115) C-1 (0.095) Z-2 (0.046)
Z-4 G-3 DM08 (0.312) Z-5 (0.103) G-3 (0.088) Z-4 (0.046)
Z-5 G-1 C-1 (0.304) DM08 (0.101) B-3 (0.079) Z-1 (0.035)
DM04 Z-6 C-2 (0.292) C-1 (0.101) DM15 (0.072) B-3 (0.281)
DM08 B-3 G-3 (0.278) DM04 (0.052) DM08 (0.071) G-3 (0.021)
DM09b Z-6 (0.278) DM09b (0.051) DM09b (0.065) DM07 (0.016)
DM09b (0.266) DM04 (0.062) DM03 (0.014)
DM04 (0.259) DM14 (0.058) B-2 (0.013)
Table 7: Decision tree results on the separate test set.
Used variables
J48 RandomForest RandomTree RepTree
Total classification rate (Recall)
All variables 65.5% (0.148) 77.1% (0.481) 65.7% (0.556) 74.5% (0.222)
CfsSubset 63.8% (0.259) 74.2% (0.481) 66.7% (0.444) 73.0% (0.259)
Classifier 78.1% (0.259) 74.2% (0.556) 62.8% (0.556) 56.0% (0.556)
Correlation 63.8% (0.259) 76.4% (0.481) 53.0% (0.556) 73.0% (0.259)
GainRatio 63.8% (0.259) 74.2% (0.481) 66.7% (0.444) 73.0% (0.259)
InformationGain 64.0% (0.259) 77.9% (0.519) 73.5% (0.593) 73.0% (0.259)
Relief 62.8% (0.296) 73.5% (0.407) 70.6% (0.519) 68.1% (0.370)
Table 8: Detailed accuracy by class (RandomTree algorithm).
Class TP Rate FP Rate Precision
Recall F-Measure MCC ROC Area PRC Area
YES 0.593 0.255 0.140 0.593 0.227 0.187 0.675 0.117
NO 0.745 0.407 0.963 0.745 0.840 0.187 0.681 0.959
the RandomTree algorithm using variables selected
by the Information Gain Evaluator. The classification
rate of this algorithm is slightly lower (73.48%). A
statistical significance test was performed using the
Weka Experiment Environment to compare one
learning scheme (RandomTree) with three others.
The test showed a statistically significant difference
between the RandomTree algorithm and all other
algorithms at 95% reliability. The detailed accuracy
of the RandomTree algorithm by class is shown in
Table 8.
We consider this model to be relatively well suited
to determine turnover intention, notwithstanding the
fact that the total rate of classification is lower.
As shown in Table 6, the variables that most
strongly influence output were Z-4 (Personal growth),
G-1 (Affective commitment), Z-1 (Satisfaction with
salary and welfare), Z-2 (Satisfaction with work
itself), and Z-5 (Interpersonal relationships).
Table 9 shows the confusion matrix for the test
sample. It can be seen that out of the total 27 employees
who have the intention to leave their jobs, the decision
tree was able to place 15 of them in the correct
category. As for the class of employees with no
intention to leave, the decision tree was able to
correctly assign 312 respondents, while 72 were placed
in the class of employees with turnover intention.
Table 9: Confusion matrix.
Predicted class
YES NO
Actual class
YES 15 12
NO 72 312
ICEIS 2024 - 26th International Conference on Enterprise Information Systems
332
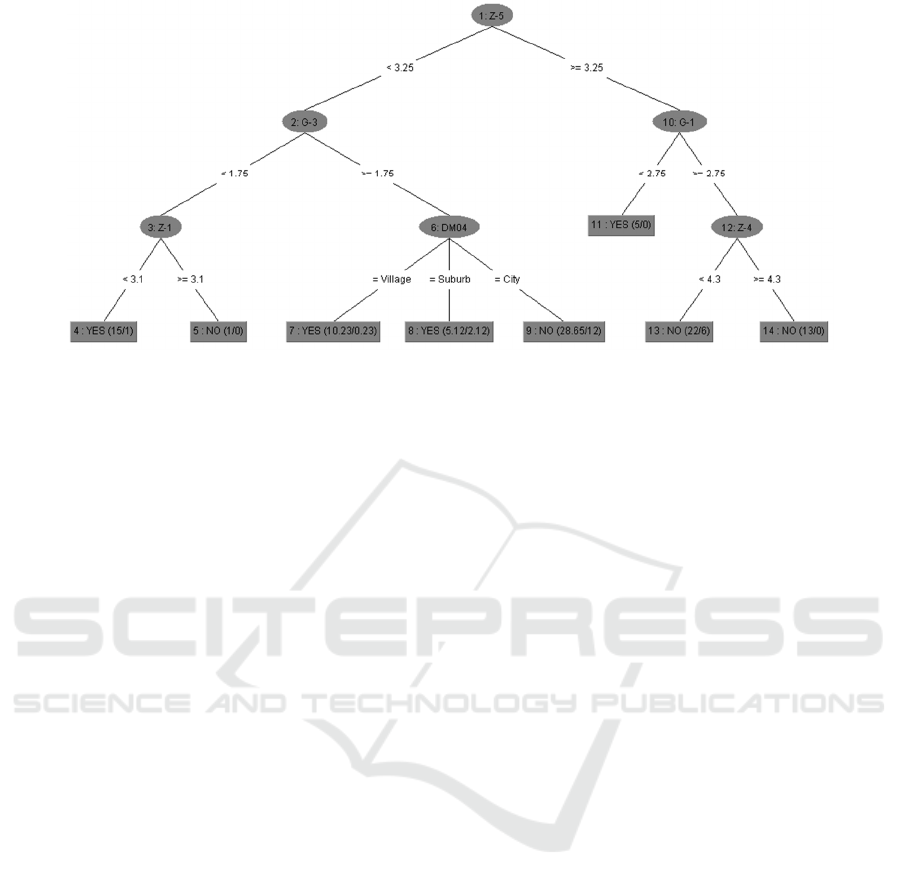
Figure 2: Confusion matrix.
The structure of composed decision tree can be
seen in Figure 2.
Since the original decision tree of 74 nodes and
leaves was too large, a maximum depth of the tree of
3 was established. This tree consists of 6 nodes and 8
leaves and branches equally to the left and right. The
first branching node is the variable Z-5 (Interpersonal
relationships). If the employee is satisfied with the
relationship with his colleagues, but his affective
commitment (G-1) is not high, he will leave the
organization. Otherwise, the tree divides further and
the next splitting node is variable Z-4 (Personal
growth), but regardless of the satisfaction with his
personal growth, he will not leave the job.
If the employee is not satisfied with his
interpersonal relationships (Z-5), his normative
commitment (G-3) is very low, as well as satisfaction
with salary and welfare (Z-1), he will have the
turnover intention. If his normative commitment (G-
3) is higher and his place of residence (DM04) is a
village or suburb, there is a chance that this employee
will leave his job.
5 DISCUSSION AND
CONCLUSIONS
A decision tree with a very high degree of accuracy
can successfully predict which employees have no
intention to leave the organization, which is always
welcome information, although a more crucial
problem for the future of the organization is the
prediction of employees who have turnover intention.
The limitation of this work is precisely the unequal
distribution of respondents with and without turnover
intention. If an equal representation of both groups
had been achieved in the overall sample, the rate of
correct classification would also be higher for those
with the intention to leave. This is also the most
important implication for future research. Another
limitation that is problematic with this question is the
indication of desired responses, since many
employees who are thinking about other employment
opportunities or leaving are reluctant to report that for
a variety of motives. In any case, equal representation
should be the primary goal of further research.
Nevertheless, this model can be considered
relatively relevant, and useful results suggest that
opportunities for personal growth, affective
organizational commitment, satisfaction with salary
and the job itself, and satisfaction with interpersonal
relationships most strongly influence employees’
intentions to leave.
What is particularly interesting about this research
is that despite satisfaction with working with
colleagues, affective organizational commitment
plays a stronger role in the decision to leave, i.e., even
if employees feel good about their work environment,
they will not stay if they are not emotionally attached
to it.
Opportunities for personal growth may be critical
for some employees but not for others, but low
satisfaction with interpersonal relationships and
compensation and benefits usually leads to a desire to
leave. When an employee has low normative
commitment and lives in a rural or suburban area, he
or she will want to leave the organization. This least
researched dimension of organizational commitment
suggests that employees who do not live in the city
and do not have a moral obligation to stay in the
organization (and do not feel they owe anything to the
organization) do not have a connection that would
prevent them from leaving. By creating Decision
Prediction of the Employee Turnover Intention Using Decision Trees
333

Trees based on the observed variables, organizations
can recognize patterns and important predictors of
turnover intentions and thus develop targeted
retention strategies.
The research design can also be set the other way
around, i.e., focusing on those employees who have
no intention of leaving to identify key variables that
influence a person's intention to stay. This approach
would be acceptable in the example of many
organizations and in an applied sense because it
focuses on the factors that strengthen the bond
between the employee and his or her organization, as
opposed to the factors that separate them. Although it
is generally hypothesized that dissatisfaction with the
above variables will have the opposite effect on
intention to stay, this is not necessarily true and is an
area that researchers should focus more on.
Decision Trees could therefore become a unique
tool for predicting organizational behavior due to
their interpretability (they can overlook complex
dependencies and nonlinear relationships present in
real data), providing clear and intuitive decision rules,
while the transparency of this tool increases the
credibility of predictive models.
REFERENCES
Alaskar, L., Crane, M. Alduailij, M. (2019). Employee
Turnover Prediction Using Machine Learning. In
Alfaries, A. et al. (Eds.). Advances in data Science,
Cyber Security and IT Applications, pp. 301-316. DOI:
10.1007/978-3-030-36365-9_25
Asiri, A., Abdullah, M. (2019). Employees Absenteeism
Factors Based on Data Analysis and Classification.
Biosience Biotechnology Research Communications,
Vol. 12, No. 1, pp. 119-127. DOI: 10.21786/bbrc/
12.1/14
Bao, L., Xing, Z., Xia, X., Lo, D., Li, Sh. (2017). Who Will
Leave the Company?: A large-scale industry study of
developer turnover by mining monthly work report.
14th International Conference on Mining Software
Repositories (MSR), Buenos Aires, Argentina, May 20-
21, pp. 170-181. DOI: 10.1109/MSR.2017.58
Bee, G. H., Mak, I., Jak, N. W., Ching, P. Z. (2014). Factors
of job turnover intention among employees of private
universities in Selangor. Final Year Project, UTAR,
available at: http://eprints.utar.edu.my/1696/1/FYP-
_JOB_TURNOVER_INTENTION_2014.pdf
Beehr, T. A., Gupta, N. (1978). A Note on the Structure of
Employee Withdrawal. Organizational Behavior and
Human Performance, Vol. 21, pp. 73-79. DOI:
10.1016/0030-5073(78)90040-5
Bouckaert, R. R., Frank, E., Hall, M., Kirkby, R.,
Reutemann, P., Seewald, A., Scuse, D. (2016) WEKA
Manual for Version 3-8-0.
Bryant, P. C., Allen, D. G. (2013). Compensation, Benefits
and Employee Turnover. Compensation & Benefits
Review, Vol. 45, No. 3, pp. 171–175. DOI:
10.1177/0886368713494342
Cha, S.-H. (2008). Explaining Teachers’ Job Satisfaction,
Intent to Leave, and Actual turnover: A structural
Equation Modelling Approach. A Dissertation
submitted to the Department of Educational Leadership
and Policy Studies in partial fulfilment of the
requirements for the degree of Doctor of Philosophy,
available at: https://diginole.lib.fsu.edu/islandora/
object/fsu:182180/datastream/PDF/view (accessed 16
January 2022)
Colquitt, J. A. (2001). On the dimensionality of
organizational justice: A construct validation of a
measure. Journal of Applied Psychology, Vol. 86, pp.
386-400. DOI: 10.1037/0021-9010.86.3.386
Dardar, A. H. A., Jusoh, A., Rasli, A. (2012). The Impact
of Job Training, job satisfaction and Alternative Job
Opportunities on Job Turnover in Libyan Oil
Companies. Procedia - Social and Behavioral Sciences,
Vol. 40, pp. 389-394. DOI: 10.1016/j.sbspro.20
12.03.205
De Jesus, A. C., Junior, M. E. G. D., Brandao, W. C. (2018).
Exploiting LinkedIn to Predict Employee Resignation
Likelihood. In Proceedings of the 33rd Annual ACM
Symposium on Applied Computing (SAC '18),
Association for Computing Machinery, New York, NY,
USA, pp. 1764–1771. DOI: 10.1145/3167132.3167320
Eslami, J., Gharakhani, D. (2012). Organizational
Commitment and Job Satisfaction. ARPN Journal of
Science and Technology, Vol. 2, No. 2, pp. 85-91.
Ganchev, T., Zervas, P., Fakotakis, N., Kokkinakis, G.
(2006). Benchmarking Feature Selection Techniques
on the Speaker Verification Task. Fifth International
Symposium on Communication Systems, Networks and
Digital Signal Processing, pp. 314-318.
Gao, X., Wen, J., Zhang, Ch. (2019). An Improved Random
Forest Algorithm for Predicting Employee Turnover.
Mathematical Problems in Engineering, 2019, pp. 1-
12. DOI: 10.1155/2019/4140707
Garner, B. R., Hunter, B. D. (2014). Predictors of Staff
Turnover and Turnover Intentions within Addiction
Treatment Settings: Change over Time Matters.
Substance Abuse: Research and Treatment, Vol. 8, pp.
63-71. DOI: 10.4137/sart.s17133
Ghazi, A. H., Elsayer, S. I., Khedr, A. E. (2021). A
Proposed Model for Predicting Employee Turnover of
Information Technology Specialists Using Data Mining
Techniques. International Journal of Electrical and
Computer Engineering Systems, Vol. 12, No. 2, pp.
113-121. DOI: 10.32985/ijeces.12.2.6
Girmanova L., Gašparova, Z. (2018). Analysis of Data on
Staff Turnover Using Association Rules and Predictive
Techniques. Quality innovation prosperity, Vol 22, No.
2, pp. 82-99. DOI: 10.12776/qip.v22i2.1122
Grissom, J. A., Viano, S. L.; Selin, J. L. (2016).
Understanding Employee Turnover in the Public
Sector: Insights from Research on Teacher Mobility.
ICEIS 2024 - 26th International Conference on Enterprise Information Systems
334

Public Administration Review, Vol. 76, No. 2, pp. 241-
251. DOI: 10.1111/puar.12435
Hall, M. A., Holmes G. (2003). Benchmarking Attribute
Selection Techniques for Discrete Class Data Mining.
IEEE Transactions on knowledge and data
engineering, Vol. 15, No. 3. DOI:
10.1109/tkde.2003.1245283
Hayton, J. C., Carnabuci, G., Eisenberger, R. (2012). With
a little help from my colleagues: A social
embeddedness approach to perceived organizational
support. Journal of Organizational Behavior, Vol. 33,
No. 2, pp. 235–249. DOI: 10.1002/job.755
Heavey, A. L., Holwerda, J. A., Hausknecht, J. P. (2013)-
Causes and consequences of collective turnover: A
meta-analytic review. Journal of Applied Psychology,
Vol. 98, No. 3, pp. 412– 453. DOI: 10.1037/a0032380
Hssina, B., Merbouha, A., Ezzikouri, H., Erritali, M.
(2014)- A comparative study of decision tree ID3 and
C4.5. International Journal of Advanced Computer
Science and Applications, Vol. 4, No. 2, pp. 13-19.
DOI: 10.14569/SpecialIssue.2014.040203
Holtom, B. C., Mitchell, T. R., Lee, T. W., Eberly, M. B.
(2008). 5 turnover and retention research: a glance at
the past, a closer review of the present, and a venture
into the future. The Academy of Management Annals,
Vol. 2, No. 1, pp. 231-274. DOI:
10.1080/19416520802211552
Kang, G., Croft, B., Bichelmeyer, B. A. (2020). Predictors
of Turnover Intention in U.S. Federal Government
Workforce: Machine Learning Evidence That
Perceived Comprehensive HR Practices Predict
Turnover Intention. Public Personnel Management,
December 2020. DOI: 10.1177/0091026020977562
Kim, T., Chang, K. (2014). Turnover Intentions and
Organizational Citizenship Behaviours in Korean
Firms: The Interactional Effects of Organizational and
Occupational Commitment. Asia Pacific Business
Review, Vol. 20, No. 1, pp. 59-77. DOI:
10.1080/13602381.2011.640538
Lee, C. Y., Liu, C. H. (2007). An examination of factors
affecting repatriates’ turnover intentions. International
Journal of manpower, Vol. 28, No. 2, pp. 122-134.
Lee, T. W., Hom, P. W., Eberly, M. B., Mitchell, T. R.
(2017). On the Next Decade of Research in Voluntary
Employee Turnover. Academy of Management
Perspectives, Vol. 31, No. 3, pp. 201–221. DOI:
10.5465/amp.2016.0123
Lee, X., Yang, B., Li, W. (2017). The influence factors of
job satisfaction and its relationship with turnover
intention: Taking early-career employees as an
example. Anales de psicologia, Vol. 33, No. 3, pp. 697-
707. DOI: 10.6018/analesps.33.3.238551
Meyer, J. P., Allen, N. J. (1991). A three-component
conceptualization of organizational commitment.
Human Resource Management Review. Vol. 1, No. 1,
pp. 61–89. DOI: 10.1016/1053-4822(91)90011-Z
Mitchell, T. M. (1997). Machine Learning. McGraw-Hill.
Mowday, R. T., Porter, L. W., Steers, R. M. (1982).
Employee-organization linkages, the psychology of
commitment, absenteeism, and turnover. Academic
Press, New York.
Mowday, R. T., Steers, R.N., Porter, L.W. (1979). The
measurement of organisational commitment. Journal of
vocational behaviour, Vol. 14, No. 2, pp. 224–247.
DOI: 10.1016/0001-8791(79)90072-1
Nawaz, M. S., Pangil, F. (2016). The Effect of Fairness of
Performance Appraisal and Career Growth on Turnover
Intention. Pakistan Journal of Commerce and Social
Sciences, Vol. 10, No. 1, pp. 27-44.
Niehoff, B. P., Moorman, R. H. (1993). Justice as Mediator
of the Relationship between Methods of Monitoring
and Organizational Citizenship Behavior. Academy of
Management Journal. Vol. 36, No. 3, pp. 527-556.
DOI: 10.2307/256591
Nowakowski, J. M., Conlon, D. E. (2005). Organizational
justice: looking back, looking forward. International
Journal of Conflict Management, Vol. 16, No. 1, pp. 4-
29. DOI: 10.1108/eb022921
Olusegun, O. S. (2013). Influence of Job Satisfaction on
Turnover Intentions of Library Personnel in Selected
Univerisities in South West Nigeria. Library
Philosophy and Practice (e-journal), 914, available at:
https://digitalcommons.unl.edu/cgi/viewcontent.cgi?re
ferer=https://www.google.com/&httpsredir=1&article
=2267&context=libphilprac (accessed 09 September
2021)
Oreški, D. (2014). Evaluation of contrast mining techniques
for feature selection in classification. Doctoral thesis,
Varaždin: Faculty of Organization and Informatics.
Pepra-Mensah, J., Adjei, N. L., Yeboah-Appiagyei, K.
(2015). The Effect of Work Attitudes on Turnover
Intentions in the Hotel Industry: The Case of Cape
Coast and Elmina (Ghana). European Journal of
Business and Management, Vol. 7, No. 14, pp. 114-121.
Pfeffer, J., Davis-Blake, D. (1992). Salary dispersion,
location in the salary distribution, and turnover among
college administrators. Industrial & Labor Relations
Review, Vol. 45, No. 4, pp. 753–763. DOI:
10.1177/001979399204500410
Powers, D. M. W. (2011). Evaluation: from precision, recall
and F-measure to ROC, informedness, markedness and
correlation. International Journal of Machine Learning
Technology, Vol. 2, No. 1, pp. 37-63.
Quinlan, R. J. (1996). Improved Use of Continuous
Attributes in C4.5. Journal of Artificial Intelligence
Research, 4, pp. 77-90. DOI: 10.1613/jair.279
Rahman, A., Raza Naqui, S. M. M., Ismail Ramay, M.
(2008). Measuring Turnover Intention: A Study of IT
Professionals in Pakistan. International Review of
Business Research Papers, Vol. 4, No. 3, pp. 45-55.
Robbins, S. P., Judge, T., A. (2010), Organiazcijsko
ponašanje. Paerson, Prentice Hall; Mate, Zagreb.
Robbins, S. P., Judge, T., A. (2017). Organizational
Behavior. Paerson, Prentice Hall; Boston.
Ruso, J., Glogovac, M., Filipović, J., Jeremić, V. (2021).
Employee Fluctuation in Quality Management
Profession: Exploiting Social Professional Network
Data. Engineering Management Journal. Vol. 34, No.
2, pp. 1-15. DOI: 10.1080/10429247.2021.1952022
Prediction of the Employee Turnover Intention Using Decision Trees
335

Shah, S. A. A., Uddin, I., Aziz, F., Ahmad, S., Al-
Khasawneh, M. A., Sharaf, M. (2020). An Enhanced
Deep Neural Network for Predicting Workplace
Absenteeism. Complexity, Vol. 2020. DOI:
10.1155/2020/5843932
Shore, L. M., Tetrick, L. E. (1991). A construct validity
study of the Survey of Perceived Organizational
Support. Journal of Applied Psychology, Vol. 76, No.
5, pp. 637-643. DOI: 10.1037/0021-9010.76.5.637
Shuck, B., Reio, T. (2014). Employee engagement and
well-being: A moderation model and implications for
practice. Journal of Leadership & Organizational
Studies, Vol. 21, No. 1, pp. 43-58. DOI:
10.1177/1548051813494240
Singer, G., Cohen I. (2020). An Objective-Based Entropy
Approach for Interpretable Decision Tree Models in
Support of Human Resource Management: The Case of
Absenteeism at Work. Entropy, Vol. 22, No. 8. DOI:
10.3390/e22080821
Skorikov, M., Hussain, M. A., Khan, M. R., Akbar, M. K.,
Momen, S., Mohammed, N., Nashin, T. (2020).
Prediction of Absenteeism at Work using Data Mining
Techniques. 5th International Conference on
Information Technology Research (ICITR), pp. 1-6,
DOI: 10.1109/ICITR51448.2020.9310913
Tansky, J., Cohen, D. (2001). The relationship between
organizational support, employee development, and
organizational commitment: An empirical study.
Human Resource Development Quarterly, Vol. 12, No.
3, pp. 285–300. DOI: 10.1002/hrdq.15
Treuren, G. (2013). The relationship between perceived job
alternatives, employee attitudes and leaving intention.
Anzam. https://www.anzam.org/wp-
content/uploads/pdf-manager/111_ANZAM-2013-
243.PDF
Vandamme, J.-P., Meskens, N., Superby, J.-F. (2007).
Predicting Academic Performance by Data Mining
Methods. Education Economics, Vol. 15, No. 4, pp.
405-419. DOI: 10.1080/09645290701409939
Villavicencio, C. N., Macrohon, J. J. E., Inbaraj, X. A.,
Jeng, J. H, Hsieh, J.-G. (2021). COVID-19 Prediction
Appying Supervised Machine Learning Algorithms
with Comparative Analysis Using WEKA. Algorithms,
Vol. 14, No. 201, pp. 1-22. DOI: 10.3390/a14070201
Wahid, Z., Zaidi Satter, A. K. M., Al Imran, A., Bhuiyan,
T. (2019). Predicting Absenteeism at Work Using Tree-
Based Learners. Proceedings of the 3rd International
Conference on Machine Learning and Soft Computing
(ICMLSC 2019), Association for Computing
Machinery, New York, USA, pp. 7–11. DOI:
10.1145/3310986.3310994
Witten, I. H., Frank, E., Hall, M. A. (2011). Data Mining:
Practical Machine Learning Tools and Techniques.
Morgan Kaufmann Publishers, Burlington.
Wright, T. A., Bonett, D. G. (2007). Job Satisfaction and
Psychological Well-Being as Nonadditive Predictors of
Workplace Turnover. Journal of Management, Vol. 33,
No. 2, pp. 141–160. DOI: 10.1177/0149206306297582
Yamazakia, Y., Petchdee, S. (2015). Turnover Intention,
Organizational Commitment, and Specific Job
Satisfaction among Production Employees in Thailand.
Journal of Business and Management, Vol. 4, No. 4, pp.
22-38. DOI: 10.12735/JBM.V4I4P22
Yuan, J. (2021). Research on Employee Turnover
Prediction Based on Machine Learning Algorithms. 4th
International Conference on Artificial Intelligence and
Big Data (ICAIBD), pp. 114-120. DOI:
10.1109/ICAIBD51990.2021.9459098
ICEIS 2024 - 26th International Conference on Enterprise Information Systems
336
