
Value for Money: An Experimental Comparison
of Cloud Pricing and Performance
Michiel Willocx, Ilse Boh
´
e and Vincent Naessens
DistriNet, Department of Computer Science, KULeuven, Belgium
Keywords:
Cloud Computing, Performance, Cost.
Abstract:
Organizations increasingly rely on cloud providers for computation intensive tasks. This study executes com-
putation expensive experiments in five cloud environments with a substantial market share. More specifically,
we selected the big three and two representative European counterparts. By means of the experiments, we aim
at comparing and assessing their value for money with respect to computational intensive tasks. The paper
focuses on three aspects with high interest of industrial stakeholders, namely (a) the impact of server location
and time of day on performance, (b) the computational efficiency in relation to costs, and (c) a comparison
between European service providers and the big three in the cloud space.
1 INTRODUCTION
Cloud computing has changed the way businesses and
individuals manage and utilize computing resources.
Due to the popularity of the cloud paradigm, many
commerical stakeholders are entering the market. For
many companies, howevever, selecting the most fea-
sible cloud provider is no easy task. With the excep-
tion of certain very niche capabilities, the major cloud
providers offer a very similar set of capabilities, hence
making this criterion obsolete as a selection parame-
ter. Hence, many companies often steer their selec-
tion solely based on the experience of their develop-
ments and consultants with a specific cloud provider
rather than basing their selection on quantitative crite-
ria such as the software performance parameters and
the expected cost.
It is no surprise that companies often refrain from
basing their cloud-platform selection on the afore-
mentioned quantitative parameters, as these prove to
be hard to compare. Available hardware instances
tend to differ between different cloud providers (and
even between different geographical locations of the
same provider). Estimating and comparing real costs
is often hard only relying on the pricing schemes pre-
sented on the cloud provider’s website due to differ-
ences in the cost-model. This problem is further exag-
gerated by the fact that the performance of the hard-
ware directly impacts the cost. Instances with higher
computing power tend to cost more, but decreasing
the computing power could also negatively impact the
cost as this increases the required computing time.
Additionally, it must also be noted that it is often un-
clear how advertised computing specifications map to
actual computing power.
In order to shed a light on this prevalent chal-
lenge, this paper delves into a comparative analysis
of cloud service providers. The comparison focuses
on the prominent trio of cloud providers: Amazon
Web Services, Google Cloud Platform, and Microsoft
Azure. Additionally, the study extends to include two
European cloud service providers, OVHcloud and Ex-
oscale. The latter were selected by a group of SMEs
in an ongoing joint research initiative and represent
a substantial EU market share. Embracing additional
EU players beyond the big three has multiple bene-
fits. First of all, this allows us to assess the competi-
tiveness of smaller players in the cloud provider land-
scape. Secondly, due to the GDPR regulation, Euro-
pean companies are compelled to store their data in
Europe, therefore often favoring or at least exploring
Europe-based cloud providers. For completeness, an
on-premise server is also added to the comparisons.
This research addresses critical concerns to thor-
oughly evaluate and compare the value for money
across these cloud providers, and studies (a) the effect
of server location and time of execution, (b) its value
for money and computational efficiency, and (c) the
performance of European cloud providers compared
to the Big Three.
Contributions. This paper presents a quantitative as-
sessment of the performance and cost of five cloud
140
Willocx, M., Bohé, I. and Naessens, V.
Value for Money: An Experimental Comparison of Cloud Pr icing and Performance.
DOI: 10.5220/0012545400003711
Paper published under CC license (CC BY-NC-ND 4.0)
In Proceedings of the 14th International Conference on Cloud Computing and Services Science (CLOSER 2024), pages 140-148
ISBN: 978-989-758-701-6; ISSN: 2184-5042
Proceedings Copyright © 2024 by SCITEPRESS – Science and Technology Publications, Lda.

providers based on multiple runs of a factorial num-
ber. We opt for one representative experiment that is
executed on multiple platforms, and at different times
and locations. The selected task is representative for
computational intensive tasks. A set of 31 instance
types is defined and selected for the three market lead-
ers and for two European alternatives. A computa-
tional intensive application that calculates the facto-
rial of 10000 was created to test these instances on
computing performance. All tests are clearly moni-
tored and incurred costs are documented. In addition
to an overview of performance, there is a clear listing
of the value for money ratio for each instance.
The following section gives an overview of previ-
ously conducted research in the field of cloud perfor-
mance evaluation and comparison. The remainder of
this paper delves into the methodology that was em-
ployed for this study, the tasks that were used to test
the instances, and a thorough analysis of the results
that were obtained, addressing the aforementioned re-
search questions. Through this research, we seek
to provide insights that support informed decision-
making regarding cloud service selection based on the
best value proposition.
2 RELATED WORK
Provider comparison studies mainly focus on the big
three cloud providers, namely Google Cloud Plat-
form, Amazon Web Services and Microsoft Azure.
Table 1 gives an overview of the related work de-
scribed in this section. It clearly indicates whether
the work is domain specific, conducts experiments,
which providers are being examined and if they eval-
uate costs. A distinction is made between incurred
costs, whether the cost evaluation is based on costs
effectively paid after running experiments, and ad-
vertised costs that are determined based on the docu-
mentation and publically available information of the
cloud providers.
Dutta et. al. (Dutta and Dutta, 2019) provide a clear
overview of the possible compute, storage, database,
networking and security services for the big three
cloud providers. They also list useful cloud and man-
agement tools and dive deeper into the market share
and pricing models. However, the comparison be-
tween the platforms is not further substantiated by ex-
tensive testing. Kamal et. al (Kamal et al., 2020) list
existing storage, computation and infrastructure ser-
vices and briefly evaluate pricing. Comparison be-
tween the providers is done generically and is not
based on concrete experiments.
Kelley et. al. (Kelley et al., 2020) give an in-depth
listing of virtual and bare metal machines, container
services and serverless computing possibilities. Ge-
ographic availability, security and compliance certifi-
cations and frameworks are some of the observed pa-
rameters. Cost comparison was no part of the work.
Ogbole et. al. (Ogbole et al., 2021) compare pricing,
scalability and storage possibilities for the three cloud
providers. The enumeration is limited to a partial list-
ing of possible tools. Similar to the previous work,
the presented comparison concerning the scalability,
storage and pricing is qualitative by nature, and is
not backed by experiments. Kaushik et. al. (Kaushik
et al., 2021) briefly evaluate the range of cloud ser-
vices for the big three cloud providers. On-demand
documentation prices are listed for various instance
types, but are not backed up by testing. Performance
tests are run for each provider. Based on the Phoronix
Test Suite3, Apache, Dbench and RAM speed bench-
marks were conducted. The paper however, does not
specify the concrete instances the tests are executed
on.
In contrast to the previously mentioned work,
Pierlonie et. al. (Pierleoni et al., 2019) and
Muhammed et. al. (Muhammed and Ucuz, 2020)
focus specifically on the use of cloud computing in
the domain of the Internet of Things (IoT). (Pierleoni
et al., 2019) compares the use of the Message Queu-
ing Telemetry Transport (MQTT) protocol in AWS’s
IoT Core, GCP’s IoT Core, which is at the time of
writing no longer supported, and Azure’s IoT Hub.
Backed by extensive testing they evaluate the cloud
broker service times. The work lists the costs versus
the number of IoT devices. This cost is calculated
based on the documentation of each provider and not
on the experiments. (Muhammed and Ucuz, 2020)
gives a high-level overview of analytic and security
possibilities and the constraints for each of the three
cloud providers. Their work also lacks experiments.
The following works focus on performance of
cloud providers. Schad et. al. (Schad et al., 2010)
perform an extensive experiment based evaluation of
the AWS computing instances. Using established mi-
crobenchmarks, CPU, I/O and Network variance are
evaluated. During an entire month data is collected.
Results show that variances up to 20% occur between
different instances. In this work there is no listing of
incurred or advertised costs.
Iosup et. al. (Iosup et al., 2011) focus on vari-
ous AWS and GCP cloud services. Performance tests
are evaluated based on data collected from the Cloud-
Status platform, which is currently no longer active.
Data from over a year is analyzed to evaluate time-
dependent and application-dependent variance. Here
too, no connection is made with the costs for the cloud
Value for Money: An Experimental Comparison of Cloud Pricing and Performance
141

Table 1: Related work (Exp = Experiments; CC = Cost-
Comparison; (i) = incurred costs; (a) = advertised costs).
Providers
Exp CC AWS Azure GCP
Kaushik(’21) ✓ (a) ✓ ✓ ✓
Ogbole(’21) ✓ ✓ ✓
Kelley(’20) ✓ ✓ ✓
Muhmd(’20) ✓ ✓ ✓
Kamal(’20) ✓ ✓ ✓
Pierleoni(’19) ✓ (a) ✓ ✓ ✓
Dutta(’19) ✓ ✓ ✓
Laaber(’19) ✓ (a) ✓ ✓ ✓
Wang(’17) ✓ (a) ✓ ✓
Leitner(’16) ✓ (i) ✓ ✓ ✓
Leitner(’15) ✓ (a) ✓
Iosup(’11) ✓ ✓ ✓
Schad(’10) ✓ ✓
services.
Leitner et.al. (Leitner and Cito, 2016) on the one
hand analyze the state of art research and on the
other hand validates the state of the art research for
AWS, GCP, Azure and IBM. Cost evaluations are per-
formed, but it is however not entirely clear if those
evaluations are based on advertised or incurred costs.
In the scope of microbenchmarking software ap-
plications and evaluating the impact of testing soft-
ware in a cloud environment, Laaber et.al. (Laaber
et al., 2019) analyse the performance variability on
the three major cloud providers. They conclude that,
depending on the sample size and provider instance,
the performance variability is acceptable and cloud
environments can safely be used to do microbench-
mark software applications.
Both Leitner et. al. (Leitner and Scheuner, 2015)
and Wang et. al (Wang et al., 2017) focus on burstable
instances. Leitner et. al focus on AWS, Wag et. al. on
both AWS and GCP. Through experiments they evalu-
ate the bucket based strategy. Leitner et. al. conclude
that, as long as the average utilization of the instance
is lower than 40%, the performance cost ratio is bene-
ficial. Both papers take a look at how costs can further
be optimized by exploiting the burstable instances.
Existing studies are either a high-level compari-
son, in which no quantitative research is conducted on
performance, and few to no tests are performed. On
the other hand, quantitative studies are often limited
to a restricted set of providers, making comparisons
difficult. Regarding costs, nearly all studies explain
pricing strategies. In case pricing values are given,
many studies focus on advertised costs and not on
the incurred costs. This makes it impossible to ac-
count for all additional hidden costs. In this paper, we
focus on quantitative research, comparing five cloud
Table 2: Overview of Evaluated Instances.
Location/Region Zone
GCP
europe-west1 (BE) europe-west1-b
us-west2 (LA) us-west2-a
asia-southeast1 (SG) asia-southeast1-b
AWS
eu-central-1 (FRA) eu-central-1a
us-west-1 (NCA) us-west-1c
ap-southeast-1 (SG) ap-southeast-1b
Azure
West Europe Zone 1
West US -
East Asia Zone 1
OVH Gravelines GRA11
Exo Frankfurt DE-FRA-1
providers (the big three and two European alterna-
tives). The performance of each of these providers is
linked to the actual incurred costs, enabling a proper
comparison between the providers based on value for
money.
3 GENERAL APPROACH
This section presents the methodology and scope of
the experiments. Thereafter, the application is pre-
sented and the research questions are defined.
Methodology. The test are conducted on five cloud
providers, including the big three, namely Amazon
Web Services (AWS), Google Cloud Platform (GCP)
and Microsoft’s Azure. In addition, two European
providers are selected, namely OVHcloud and Ex-
oscale. In addition, the tests are also executed on
an on-premise server. All experiments are performed
with the following variables in mind, namely point-
in-time, location, and instance type. The experiments
are executed continuously over a period of three days.
Hereby, both the variability in performance through-
out a day and the variance in performance between
different days are covered.
For the big three cloud providers, tests are con-
ducted in Europe, North America and Asia. For each
European cloud provider, tests are conducted on a sin-
gle location in Europe. Table 2 lists the locations and
zones (if applicable) for each cloud provider.
Instance Types and OS. To select specific in-
stances for each provider, we define three instance
types. A distinction is made between burstable and
non-burstable instances. Burstable instances allow
shared physical CPUs to be used for short periods
CLOSER 2024 - 14th International Conference on Cloud Computing and Services Science
142

Table 3: Overview of Evaluated Instances.
Type* Instance Type
Burstable
#vCPU
GB RAM
GCP
D e2medium ✓ 1-2 4
CB e2micro ✓ 0,25-
2
1
CNB e2standard 2 8
AWS
D t2.micro ✓ 1 1
CB t2.nano ✓ 1 0,5
CNB m5.large 2 8
Azure
D D2sv3 2 8
CB B1ls ✓ 1 0,5
CNB DS1v2 1 3,5
OVH
D - - - -
CB d2-2 ✓ 1 2
CNB b2-7 2 7
Exo
D Std Medium 2 4
CB - - - -
CNB Std Micro 1 0.51
Local - - - 2 8
* D=Default, C(N)B= Cheapest (Non-)Burstable
of time when needed. Availability and pricing of
burstable capabilities depend on the provider, but are
often based on a credit/token based system (Leitner
and Scheuner, 2015). The first type - default instances
(D) - are the instances initially proposed by the
providers when creating an instance. The second type
- cheapest burstable (CB) - are the cheapest instances
with bursting capabilities. The last type - cheap-
est non-burstable (CNB) - are the cheapest instances
without bursting capabilities. For all providers, an
instance is created for each type if applicable. Ta-
ble 3 lists these provider specific instances together
with the amount of vCPUs and provided RAM in Gi-
gaByte. OVHcloud does not suggest an instance type
upon creation. Note that Exoscale does not support
burstable instances as depicted in Table 3. The on-
premise virtual machine offers 2 vCPU’s and 8 GB
of RAM. The naming convention for the instances is
the following: <provider>-<location>-<instance-
type>, for example the gcp-singapore-e2standard2
instance is a Google Cloud e2standard2 instance lo-
cated in Singapore. All instances run the minimal
version of Ubuntu 20.04.6 LTS to reduce the over-
head created by the operating system. All tests are
executed on an x86 64 architecture. Table 4 gives an
overview of the used CPU models for each instance.
Application and Research Scope. To test the in-
stances, a CPU bound application that calculates
the factorial of 50 000 runs repeatedly. The appli-
cation does not receive nor produces I/O (i.e. it
does not use the network) and is not memory inten-
sive. The program itself is a CPP application and
can be found on https://anonymous.4open.science/r/
cloud-factorial-5FCA/. The epoch is logged at the
start and at the end of every calculation cycle. The
following research questions will be answered:
• RQ1: What is the effect of the server location and
time of day on performance?
• RQ2: What is the value for money and computa-
tional efficiency of the selected cloud providers?
• RQ3: Do the Big Three outperform smaller-scale
(EU) cloud providers?
4 RESULTS
This section lists and analyses the results of the ex-
periments. Note that for AWS, the t2.micro instance
is eligible for the free tier, consisting of 750 hours of
free computing power. Cost prices for the t2.micro in-
stances are thus based on the AWS Pricing calculator,
but correctness is substantiated based on the non-free
tier eligible t2.micro and m5.large instances.
4.1 Performance
Figure 1 shows the time series of run times for calcu-
lating the factorial of 50 000 repeatedly. This graph
focuses on all provider instances in Europe, but could
be extended to North American and Asian provider
instances. What stands out is the increase in the run
time for the AWS t2.nano instance and the Azure B1ls
instance after approximately one hour and a half, and
after approximately three hours for the AWS t2micro
instance. At the moment the run time skyrockets,
bursting credits are depleted. These are no longer re-
filled as the CPU is constantly used and the run time
therefore does not decrease anymore. For the GCP
bursting instances, the run time increases almost im-
mediately after running the application 1 to 7 times,
depending on the instance and the location. This is
however not present for the burstable OVHcloud d2-2
instance.
In the following figures and results, we make ab-
straction from the increase present in burstable in-
stances. This significant difference in run time could,
depending on the duration of the measurement, have
an impact on the results.
Value for Money: An Experimental Comparison of Cloud Pricing and Performance
143
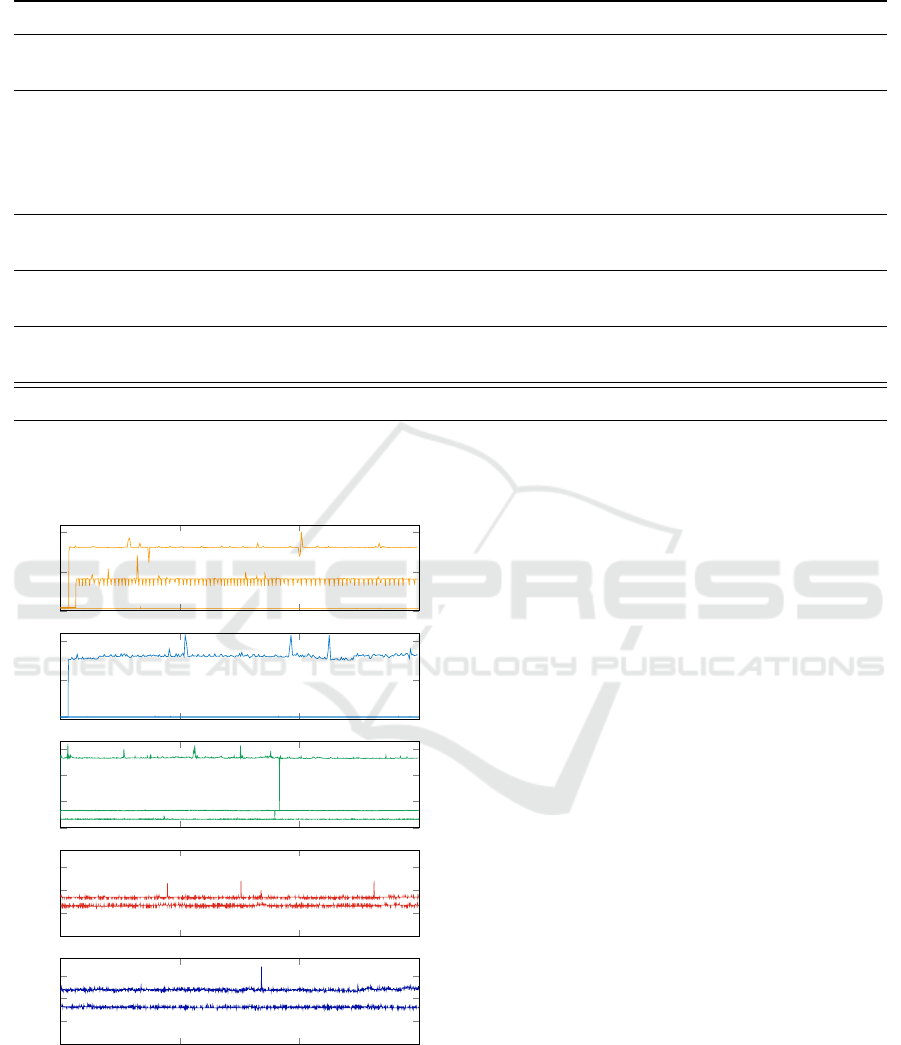
Table 4: Overview of CPU Models.
Provider Instance Location CPU Model Name
GCP
* Belgium, Los Angeles Intel(R) Xeon(R) CPU @ 2.20GHz
* Singapore AMD EPYC 7B12 (Rome)
AWS
t2.nano Frankfurt, Singapore Intel(R) Xeon(R) CPU E5-2686 v4 @ 2.30GHz
t2.nano California Intel(R) Xeon(R) CPU E5-2676 v3 @ 2.40GHz
t2.micro * Intel(R) Xeon(R) CPU E5-2676 v3 @ 2.40GHz
m5.large Frankfurt, Singapore Intel(R) Xeon(R) Platinum 8259CL CPU @ 2.50GHz
m5.large California Intel(R) Xeon(R) Platinum 8175M CPU @ 2.50GHz
Azure
* West US Intel(R) Xeon(R) Platinum 8171M CPU @ 2.60GHz
* West EU, East Asia Intel(R) Xeon(R) Platinum 8272CL CPU @ 2.60GHz
OVH
d2-2 - Intel Core Processor (Haswell, no TSX)
b2-7 Intel Core Processor (Broadwell, IBRS)
Exoscale
Std Medium - Intel Xeon Processor (Skylake)
Std Micro Intel Xeon Processor (Skylake)
On-premise - - Intel(R) Core(TM) i5-6600 CPU @ 3.30GHz
* = all possible instances/locations for the specific provider
- = not applicable
0
500
1,000
t2nano
t2micro
m5large
AWS
0
500
1,000
B1ls
DS1v2 & D2sv3
Azure
0
100
200
300
e2micro
e2medium
e2standard2
Run time (sec)
GCP
0
20
40
60
standard micro
standard medium
Exoscale
0 1 2 3
0
20
40
60
d2-2
b2-7
Time of execution (days)
OVH
Figure 1: Run times for single calculations for all instances
over three consecutive days.
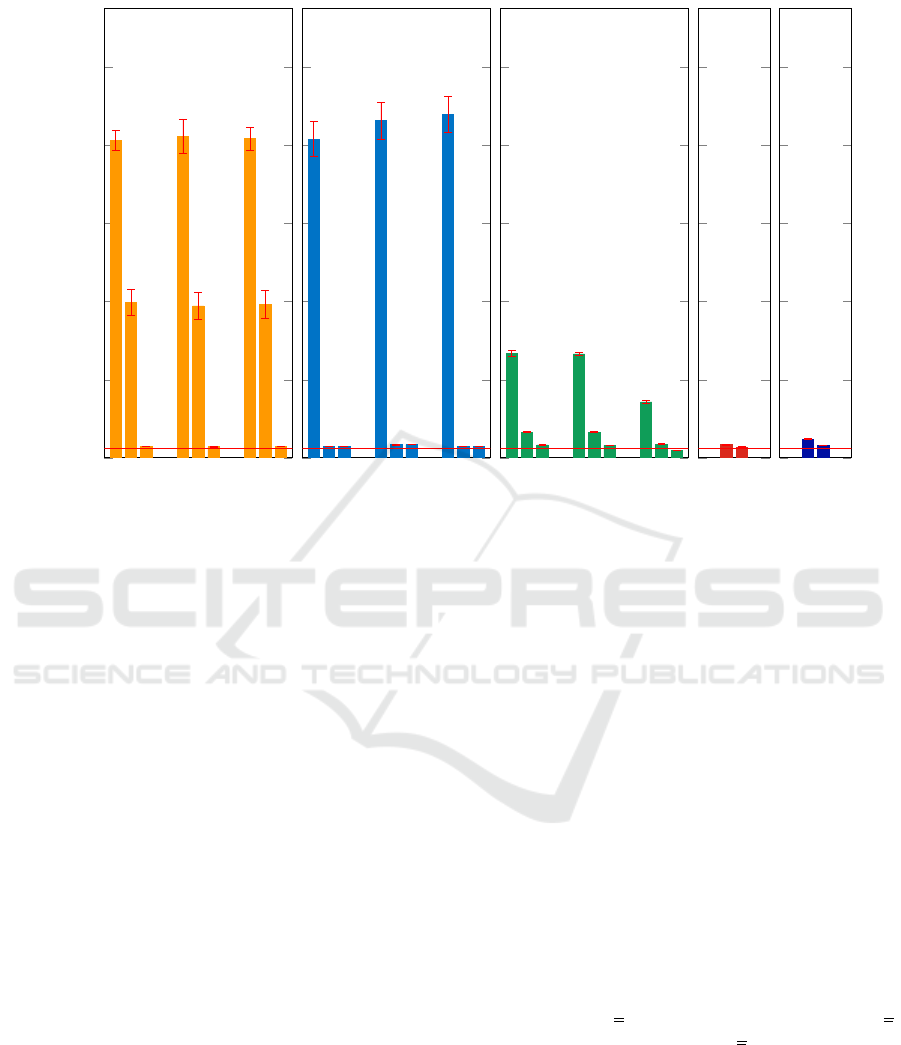
Figure 2 shows the average run time to calculate
the factorial of 50 000 once, together with the stan-
dard deviation. This is shown for the various locations
and instance types of the five predefined providers.
The average run time for the on-premise server is 23
seconds and is indicated on the graphs. Of all in-
stances, only the GCP e2standard2 instance in Sin-
gapore’s average (18 seconds) is faster than the on-
premise server. For AWS, there is no significant dif-
ference between the three locations (Frankfurt [EU],
California [US] and Singapore [Asia]). In the exper-
iments, the maximum difference between machines
of the same type is approximately 2.26%. The dif-
ference between Azure instances DS1v2 and D2sv3
between West EU and East Asia on the one hand and
West US on the other have a difference of 14.71%.
This difference can clearly be explained by the dif-
ferent CPU-Models used as seen in Table 4. For the
burstable B1ls instances relying on the same hardware
we observe a difference of 7.27%. For GCP, the av-
erage run times for instances in Belgium [EU] and
Los Angeles [US] are very similar to each other, with
a maximum difference of 3%. The instances in Sin-
gapore [Asia], however, are significantly faster, up to
47%. This difference is due to the AMD EPYC 7B12
CPU’s on which the servers in Singapore run.
For OVHcloud and Exoscale, conclusion about lo-
cation impact can not be made, as the experiments for
these providers only ran on a single location.
CLOSER 2024 - 14th International Conference on Cloud Computing and Services Science
144
Frankfurt
California
Singapore
0
200
400
600
800
1,000
t2.nano (813)
t2.nano (824)
t2.nano (817)
t2.micro (398)
t2.micro (389)
t2.micro (392)
m5.large (28)
m5.large (28)
m5.large (28)
Run time (sec)
AWS
West EU
West US
East Asia
B1ls (816)
B1ls (863)
B1ls (880)
DS1v2 (29)
DS1v2 (34)
DS1v2 (29)
D2sv3 (29)
D2sv3 (34)
D2sv3 (29)
Azure
Belgium
Los Angeles
Singapore
e2-micro (267)
e2-micro (266)
e2-micro (143)
e2-medium (66)
e2-medium (66)
e2-medium (35)
e2-standard-2 (33)
e2-standard-2 (32)
e2-standard-2 (18)
Provider Region
GCP
Frankfurt
standard-micro (34)
standard-medium (27)
Exoscale
Gravelines
d2-2 (48)
b2-7 (32)
OVH
on-premise (23)
Figure 2: Average run time to calculate the factorial of 50 000 on various instances for various providers.
4.2 Pricing
Table 5 returns the actual cost paid to run the in-
stances during three consecutive days and the cost per
10 000 calculations. All costs are in euros and ex-
cluding VAT. In the remainder of this paper, we refer
to the actual costs – thus the costs we paid after run-
ning the instances – as incurred cost. Costs that can
be found in the documentation and on the websites of
the cloud providers at the time of writing – September
15th, 2023 – are referred to as advertised costs. The
left half of the table displays the incurred cost over 3
consecutive days. The advertised costs are displayed
between brackets. Often advertised costs for com-
puting instances do not contain all the costs that are
made when running a computing instance. Therefore,
a distinction is made between the advertised cost for
the computing instance only on the one hand, and the
cost for the computing instance and additional hidden
costs on the other hand.
Identifying the incurred costs that are linked to a
particular instance relies on the provider’s approach.
Some providers group costs for each instance, while
others bundle them based on the consumed resources
(like computing, storage) and the region. It is impor-
tant to figure out the expenses that are tied to each
instance. To simplify this, most providers offer a la-
beling or tagging system to mark instances. Using
these labels or tags makes it easier to figure out the
costs that are associated with each instance later on.
Within AWS, tags added to an instance must be
identified as cost allocation tags within the billing
console before they can be used to allocate costs.
The cost of AWS computing instances is divided in
BoxUsage and VolumeUsage. The former refers to
the on-demand cost per instance. The latter refers to
the cost for provisioned storage of all instances (i.e.
combined). This VolumeUsage depends on the re-
gion and is charged per GBmonth. At the time of
writing and based on the advertised costs, for Frank-
furt, North California, and Singapore, these prices
are respectively C 0.1102/GBmonth ($ 0.119), C
0.1111/GBmonth ($ 0.12), and C 0.1111/GBmonth
($ 0.12). By default, when creating an instance, 8
GB of provisioned storage is allocated. This Vol-
umeUsage is a cost that is charged regardless of the
state of the instance (running/stopped). When view-
ing advertised prices through the AWS pricing calcu-
lator, we see that the BoxUsage costs are the only ones
included. The VolumeUsage costs need to be added
Value for Money: An Experimental Comparison of Cloud Pricing and Performance
145

separately. When comparing the total advertised cost
to the incurred cost, we see that it aligns very closely
and never underestimates but may overestimate by a
maximum of C 0.01.
As expected, the total cost can be ranked accord-
ing to the specifications of the instance. The in-
stance with the weakest resource specifications (in
terms of RAM and vCPUs) is the cheapest, and the
one with the strongest specifications is the most ex-
pensive. When looking at the performance indicator,
we see that within AWS, the m5.large instance has the
best value for money ratio.
Within Azure, it is easy to allocate the effective
costs to each instance through tagging. Additional
costs, such as managed disk space and IP addresses,
are linked to the tag per instance. However, within
Azure’s Pricing Calculator, these need to be added
separately to estimate the costs. By default, when
creating an instance, a Premium SSD Managed Disk
P4 of 32 GiB is allocated. At the time of writing
and based on the advertised costs, the prices for Pre-
mium Managed Disks are C 0.1765/day in Europe,
C 0.1604/day in America, and C 0.1765/day in Asia.
Also, a Standard static IP address is automatically cre-
ated and associated, costing C 0.1128/day indepen-
dent of the region. Here too, we can notice that when
all costs are taken into account, the advertised cost is
a good estimation of the incurred cost.
What stands out clearly within Azure is that the
price for the burstable B1ls instance is very high per
10 000 calculations. Instances with specifications be-
low a certain threshold largely drop the amount of cal-
culations per time interval up to an extent that weak
instances in terms of processing power even result in
higher prices with respect to a predefined number of
tasks of equal load. It is also remarkable that the
DS1v2 instance, that has 1 vCPU and 3.5 GB RAM,
has a better value for money ratio than the D2sv3 in-
stances with 2 vCPUs and 8 GB RAM. It is therefore
not always worth renting an instance with better spec-
ifications, because the performance does not increase
proportionally to the price.
The GCP labeling system, similar to AWS, has a
breakdown where the persistent disk is charged sepa-
rately. This is an ongoing cost that is charged even if
the instance is not running. The price (based on ad-
vertised costs) per GBmonth in Belgium, Los Ange-
les, and Singapore is C 0.09266, C 0.111192, and C
0.101926 respectively. When using the Google Cloud
Pricing Calculator, in addition to indicating the per-
sistent disk, it must be clearly indicated that an IP ad-
dress needs to be associated. This cost is included in
the incurred cost when evaluating costs based on la-
bels. By default, this IP address is detached when the
instance is not running. Regardless of the region, this
costs C 0.0890 per day. As indicated before, the in-
stances in Singapore that run on an AMD EPYC 7B12
CPU have a better performance than the other GCP in-
stances in other regions. The incurred cost, however,
is similar. As result the value for money ratio is better
than in the other regions.
The Exoscale invoice provides a clear distinction
between the various products. Here too, a distinc-
tion is made between computing instances and vol-
ume. When comparing the Exoscale non-burstable
Standard Medium with the GCP burstable e2medium,
both having 2 vCPUs and 4 GB RAM, we observe that
although the total cost of the GCP instance is lower
than the Exoscale instance, the cost per 10 000 cal-
culations is significantly lower for Exoscale. This is
also the case when comparing the Exoscale Standard
Micro with the AWS t2.nano.
Although OVHcloud has a limited Billing Control
Dashboard for the current billing period, the invoice
itself provides more information about usage and cost.
OVHcloud does not differentiate between computing
and storage volume, as the provided storage depends
on the chosen instance type. OVHcloud is based on
OpenStack, and the OpenStack Horizon Dashboard
can be easily accessed through the OVHcloud plat-
form to obtain additional information about the sys-
tem and instances.
What stands out within OVHcloud is that, unlike
all other providers, the burstable instance is cheaper
per 10 000 calculations than the non-burstable in-
stance. However, within OVHcloud, the range of
burstable instances is limited to instances with a max-
imum of 8GB RAM.
5 DISCUSSION
In this section, we will answer the three aforemen-
tioned research questions. The experimental results
that were elucidated in the previous section help to
understand how different selection strategies and
deployment decisions influence cloud computing
performance and costs.
Effect of Server Location and Time of Exe-
cution (RQ1). The experiments expose no clear
correlation between the location of a server and its
performance for the majority of instances. When
looking from the perspective of one instance type
from a provider at different locations, we only see a
noticeable deviation in the GCP instance in Singa-
pore. This can be explained due to the underlying
hardware, more specifically the CPU model powering
CLOSER 2024 - 14th International Conference on Cloud Computing and Services Science
146

Table 5: Overview of costs for multiple instances.
Instance Incurred cost (advertised costs*) for 3 days (C) C per 10K Calculations
Europe US Asia Europe US Asia
AWS
t2.micro 0.99 (0.89 / 0.99) 1.01 (0.92 / 1.01) 1.07 (0.97 / 1.07) 15.14 15.21 16.16
t2.nano 0.53 (0.45 / 0.54) 0.55 (0.46 / 0.55) 0.57 (0.49 / 0.58) 16.73 17.39 18.07
m5.large 7.75 (7.67 / 7.76) 7.55 (7.47 / 7.56) 8.09 (8.00 / 8.09) 8.36 8.04 8.72
Azure
D2sv3 8.77 (7.98 / 8.85) 8.52 (7.78 / 8.60) 9.56 (8.78 / 9.65) 9.77 11.17 10.65
B1Is 1.24 (0.40 / 1.26) 1.21 (0.41 / 1.23) 1.33 (0.48 / 1.35) 39.06 40.28 45.17
DS1v2 5.33 (4.51 / 5.38) 5.33 (4.65 / 5.47) 7.91 (7.11 / 7.98) 5.94 7.20 8.83
GCP
e2medium 2.75 (2.73 / 2.82) 2.99 (2.95 / 3.06) 3.05 (3.02 / 3.12) 6.97 7.61 4.13
e2micro 0.93 (0.88 / 0.97) 1.00 (0.94 / 1.05) 1.01 (0.96 / 1.06) 9.59 10.26 5.55
e2standard 5.18 (5.18 / 5.27) 5.64 (5.64 / 5.75) 5.77 (5.78 / 5.88) 6.50 7.06 3.91
Exo
StdMedium 3.86 (3.36 / 3.86) - - 3.98 - -
StdMicro 1.03 (0.52 / 1.03) - - 1.34 - -
OVH
d2-2 0.71 (0.71)** - - 1.31 - -
b2-7 4.90 (4.90)** - - 6.11 - -
Note: AWS t2.micro prices are based on an estimation
* (without additional costs / with additional costs), additional costs = IP addresses, disk space. . .
** OVHcloud does not differentiate between computing and storage costs, thus no breakdown is given.
the instance which differs at that location. Therefore,
when selecting an instance, it is more important to
use the desired hardware specifications as a selection
parameter that the geographical location. However,
since not every hardware setup is available at every
location, the location indirectly impacts the overall
performance. Secondly, there is no clear correlation
between the moment of execution (i.e. time of the
day) and the obtained performance. However, with
burstable instances, there is often an initial period
consisting of fast calculations. Thereafter, the run
time increases as the instance runs out of burstable
credits. Due to the nature of the application –
constantly crunching computations –, these credits
are never replenished during the experiments. Hence,
the benefits of burstable instances in this type of
(constant) computation scenarios are negligible. This
effect even increases when the run time increases.
Other use cases – where the load varies over time –
could benefit heavily from burstable instances when
the credits are replenished during off-peak times.
Value for Money and Computational Efficiency
(RQ2). Out of the major cloud players, Google Cloud
Platform instances are generally the most favorable
for computation intensive tasks from a cost perspec-
tive. For example, when comparing certain types
of instances with 2 vCPUs and 8 GB RAM (AWS
m5.large, Azure D2sv3, and GCP e2standard2), GCP
consistently offers better pricing compared to AWS
and Azure. When we look at burstable instances, the
latter are also less cost-efficient. Second, selecting
the most suitable processor architecture highly
depends on the task characteristics. Estimating those
characteristics is by far not straightforward. The
experiments show that selecting weak instances for
a particular computational intensive task can largely
drop the amount of calculations per time interval.
The drop can even reach a level that selecting the
weak instances result in higher prices with respect
to a predefined number of tasks. More concretely,
our experiments show that the weak B1Is Azure
instance is by far less cost-effective (39.06 Euro
per 10 000 calculations) compared to the default
D2sv3 instance (9.77 Euro per 10 000 calculations).
Finally, we observed that the selected European cloud
providers are significantly more cost-effective than
their counterparts outside Europe. Moreover, they
ensure lower run times despite similar resources.
However, more experiments – embracing other EU
and non-EU cloud providers – are needed whether to
generalize this statement.
Comparison of European Cloud Providers with
Big Three (RQ3). The smaller cloud providers are
strong contenders in terms of both performance and
pricing compared to the dominant Big Three cloud
providers. Nevertheless, the Big Three are currently
still dominating the market with a combined 65% of
the market shareWe argue that the main drivers for
this are the longstanding reputation and the extensive
amount of specialized, tailored cloud services. It is
worth noting that the smaller providers are steadily
expanding their range of products.
Value for Money: An Experimental Comparison of Cloud Pricing and Performance
147

6 CONCLUSION
This paper provides an insight into the computational
capabilities of different instances offered by various
cloud providers. A quantitative study compared the
computational capabilities of a total amount of 31
cloud instances distributed over five representative
cloud providers, namely AWS, Azure, GCP, Exoscale
and OVHcloud by means of a benchmark algorithm
with high computation demands. Experiments on
many instances with various characteristics allow to
compare the value for money ratio, and the position
of smaller-scale players in the market with respect to
the Big Three. The underlying hardware configura-
tion is shown to be a major characteristic for perfor-
mance, and is much more important to consider as a
selection criterion than the server’s location. How-
ever, estimating the most favorable architecture be-
forehand based on the source code of a program is by
far no sinecure. On the contrary, it highly impacts the
value for money ratio. We also see – which is some-
what counter intuitive or unexpected – that the se-
lected smaller-scale cloud providers are not only com-
petitive with respect to the Big Three, but even outper-
form them for the computational expensive tasks that
were executed during the experiments. Therefore, al-
though the amount of features they offer is often less
compared to the Big Three, they should at least be in-
cluded in the selection process. Among the big three
players, GCP emerges with the best value for money
ratio for computationally intensive experiments that
were executed.
The experimental set-up is currently limited to a
prototypical computational intensive yet representa-
tive benchmark task that was executed on many in-
stance types from different providers. Other charac-
teristics like storage and bandwith were out of scope
in this work. However, they can also impact the selec-
tion process, both in terms of the most feasible cloud
provider and instance type for a particular task or set
of tasks. Moreover, we opposed only two European
cloud providers with substantial market share to the
three biggest players in the cloud service domain.
REFERENCES
Dutta, P. and Dutta, P. (2019). Comparative study of cloud
services offered by amazon, microsoft & google. In-
ternational Journal of Trend in Scientific Research
and Development, 3(3):981–985.
Iosup, A., Yigitbasi, N., and Epema, D. (2011). On the
performance variability of production cloud services.
In 2011 11th IEEE/ACM International Symposium on
Cluster, Cloud and Grid Computing, pages 104–113.
IEEE.
Kamal, M. A., Raza, H. W., Alam, M. M., and Mohd, M.
(2020). Highlight the features of aws, gcp and mi-
crosoft azure that have an impact when choosing a
cloud service provider. Int. J. Recent Technol. Eng,
8(5):4124–4232.
Kaushik, P., Rao, A. M., Singh, D. P., Vashisht, S., and
Gupta, S. (2021). Cloud computing and comparison
based on service and performance between amazon
aws, microsoft azure, and google cloud. In 2021 Inter-
national Conference on Technological Advancements
and Innovations (ICTAI), pages 268–273, Tashkent,
Uzbekistan. IEEE, IEEE.
Kelley, R., Antu, A. D., Kumar, A., and Xie, B. (2020).
Choosing the right compute resources in the cloud:
An analysis of the compute services offered by ama-
zon, microsoft and google. In 2020 International
Conference on Cyber-Enabled Distributed Computing
and Knowledge Discovery (CyberC), pages 214–223,
Chongqing, China. IEEE, IEEE.
Laaber, C., Scheuner, J., and Leitner, P. (2019). Software
microbenchmarking in the cloud. how bad is it really?
Empirical Software Engineering, 24(4):2469–2508.
Leitner, P. and Cito, J. (2016). Patterns in the chaos—a
study of performance variation and predictability in
public iaas clouds. ACM Transactions on Internet
Technology (TOIT), 16(3):1–23.
Leitner, P. and Scheuner, J. (2015). Bursting with
possibilities–an empirical study of credit-based burst-
ing cloud instance types. In 2015 IEEE/ACM 8th In-
ternational Conference on Utility and Cloud Comput-
ing (UCC), pages 227–236, Limassol, Cyprus. IEEE,
IEEE.
Muhammed, A. S. and Ucuz, D. (2020). Comparison of
the iot platform vendors, microsoft azure, amazon
web services, and google cloud, from users’ perspec-
tives. In 2020 8th International Symposium on Digital
Forensics and Security (ISDFS), pages 1–4.
Ogbole, M., Ogbole, E., and Olagesin, A. (2021). Cloud
systems and applications: A review. International
Journal of Scientific Research in Computer Science,
Engineering and Information Technology, 7(1):142–
149.
Pierleoni, P., Concetti, R., Belli, A., and Palma, L. (2019).
Amazon, google and microsoft solutions for iot: Ar-
chitectures and a performance comparison. IEEE ac-
cess, 8:5455–5470.
Schad, J., Dittrich, J., and Quian
´
e-Ruiz, J.-A. (2010). Run-
time measurements in the cloud: observing, analyz-
ing, and reducing variance. Proceedings of the VLDB
Endowment, 3(1-2):460–471.
Wang, C., Urgaonkar, B., Nasiriani, N., and Kesidis, G.
(2017). Using burstable instances in the public cloud:
Why, when and how? Proceedings of the ACM
on Measurement and Analysis of Computing Systems,
1(1):1–28.
CLOSER 2024 - 14th International Conference on Cloud Computing and Services Science
148
