
Prediction of Turbidity and TDS in Dam Reservoir from
Multispectral UAV-Drone and Sentinel-2 Image Sensors Using
Machine Learning Models
Yashon O. Ouma
1a
, Phillimon Odirile
1
, Boipuso Nkwae
1
, Ditiro Moalafhi
2
, George Anderson
3
,
Bhagabat P. Parida
4
and Jiaguo Qi
5
1
Department of Civil Engineering, University of Botswana, Gaborone, Botswana
2
DWAR, Botswana University of Agriculture and Natural Resources, Gaborone, Botswana
3
Department of Computer Science, University of Botswana, Gaborone, Botswana
4
Department of Civil and Environmental Engineering, BIUST, Palapye, Botswana
5
Center for Global Change and Earth Observations, Michigan State University, U.S.A.
Keywords: Multispectral UAV-Drone, Sentinel-2 MSI Satellite, Water Quality, Gaborone Dam (Botswana), Turbidity,
Total Suspended Solids (TDS), Empirical Linear Regression, XGBoost (eXtreme Gradient Boosting),
Random Forest Regression.
Abstract: This study presents results on the utility of DJI P4 Multispectral (DJI-PH4) UAV-Drone and Sentinel-2 MSI
(S2-MSI) satellite datasets for the retrieval of Turbidity and Total Dissolved Solids (TDS) using empirical
linear regression (ELR), XGBoost (eXtreme Gradient Boosting) and Random Forest Regression (RFR)
machine learning (ML) models. For the case study of Gaborone dam in Botswana, 21 water sampling points
were correlated with the corresponding spectral reflectances from DJI-PH4 and S2-MSI imagery. For the
estimation of Turbidity, XGBoost gave the best prediction results with average training accuracy of R
2
= NSE
= 0.999, MAE=0.001 NTU, RMSE = 0.001 NTU and PBIAS = 0.1% for both the DJI-PH4 and S2-MSI
sensors. XGBoost performed better than ELR and RFR at the model training phases, however its prediction
of Turbidity in testing was lower than ELR but nearly same as RFR. In predicting TDS from both sensors,
XGBoost had the highest performance with equivalent accuracy measures as for the prediction of Turbidity.
Both the training and testing results for the estimation of TDS is accurate from the sensors, with ELR
marginally outperforming the XGBoost and RFR in the testing phase with R
2
= 0.998, MAE=0.338 mg/L,
RMSE = 0.435 mg/L and NSE = 0.858. For the prediction of Turbidity, all the ML models gave good training
results from the drone and Sentinel-2 data except for RFR in the case of Sentinel-2. The introduction of
ensemble ELR-XGBoost model significantly improved the prediction of the water quality parameters from
the drone and Sentinel-2 datasets. With the potential of providing high-frequency and large spatial coverage
observational data in the near-real-time mode, the results of this study demonstrate the applicability of UAV-
drone for the retrieval of Turbidity and TDS physical water quality parameter in dam reservoirs.
1 INTRODUCTION
For dam water reservoirs, the spatiotemporal
monitoring of water quality is important for the
determination of the impacts of pollution due to
anthropogenic activities as well as the environmental
health of the dam catchments. While the present
global focus is mostly on water quantity and its
distribution, the relatively weak water source
management strategies eventually contribute to poor
a
https://orcid.org/0000-0003-1163-0385
water quality which ends up undermining the
availability and supply of water resulting into health
and environmental losses.
In most developing countries, dam water reservoir
management institutions rely on traditional water
quality monitoring approaches through sporadic
sampling and laboratory testing. These in-situ
approaches are however costly, labour-intensive,
time-consuming, hazardous, and are not able to
adequately assess the entire reservoir or dam water
Ouma, Y., Odirile, P., Nkwae, B., Moalafhi, D., Anderson, G., Parida, B. and Qi, J.
Prediction of Turbidity and TDS in Dam Reservoir from Multispectral UAV-Drone and Sentinel-2 Image Sensors Using Machine Learning Models.
DOI: 10.5220/0012545600003696
Paper published under CC license (CC BY-NC-ND 4.0)
In Proceedings of the 10th International Conference on Geographical Information Systems Theor y, Applications and Management (GISTAM 2024), pages 97-104
ISBN: 978-989-758-694-1; ISSN: 2184-500X
Proceedings Copyright © 2024 by SCITEPRESS – Science and Technology Publications, Lda.
97
body (Ouma et al., 2018). To overcome these
limitations, near real-time, cost-effective, and non-
invasive semi-automated techniques with adequate
spatiotemporal coverages are preferred. To this
effect, the use of high spatial and spectral resolution
remote sensing data has been recommended (Shi et
al., 2022).
In addition to satellite data, the growing
innovations in near-earth surface remote sensing
techniques such the use of Unmanned aerial vehicles
(UAVs) are beginning to compensate for the
limitations in acquiring high spatiotemporal
resolution data and might soon be successful in
acquiring multiscale data for water quality
monitoring. Because of their potential for higher
spectral, spatial and temporal data acquisition,
affordability, simplicity to operate, and minimal
susceptibility to cloud interferences, UAVs have the
ability to acquire the desired high-resolution image
data for near-real-time monitoring of water pollution
in terms of water quality parameters (WQPs).
Previous studies have tested the use of UAVs to
monitor the concentration and distribution of TSS,
Chl-a, TP, Total Nitrogen (TN), permanganate index
(CODMn), and metal ions in water bodies (Chen et
al., 2021).
This paper presents pilot study results on the use
of UAV-derived imagery from Phantom DJI P4
Multispectral Drone (DJI-PH4) in comparison with
Sentinel-2 MSI (S2-MSI) satellite data for the
retrieval of Turbidity and Total Dissolved Solids
(TDS) in Gaborone dam (Botswana). While
Turbidity is a measure of the water transparency and
is an indicator of the distribution of sediments or
total suspended solids (TSS), TDS represents the
sum of all dissolved ions and organic matter present
in a water sample, and thus an important indicator of
overall water-quality.
To improve on the drawbacks and limitations of
the empirical, semi-analytical and matrix inversion
models and for the effective estimation of WQPs
from remote sensors, generalized models that are
suitable for automatic update of WQPs estimations
for a given water body are more desired (Chen et al.,
2021). To correlate the ground measured WQPs and
water reflectance from remote sensors, this study
applied Empirical Linear Regression (ELR),
XGBoost and RF Regression (RFR) machine
learning algorithms for the modelling of the linear
and nonlinear relationships between imagery
spectral information and ground measured WQPs.
The objectives of this study were to: (1) compare the
feasibility of UAV-drone and Sentinel-S2
multispectral imagery for the retrieval Turbidity and
TDS water quality parameter in dam reservoirs, and
(2) explore the potential and performance of ML
algorithms for water quality parameter predictions in
dam reservoirs.
2 MATERIALS AND METHODS
2.1 Study Area
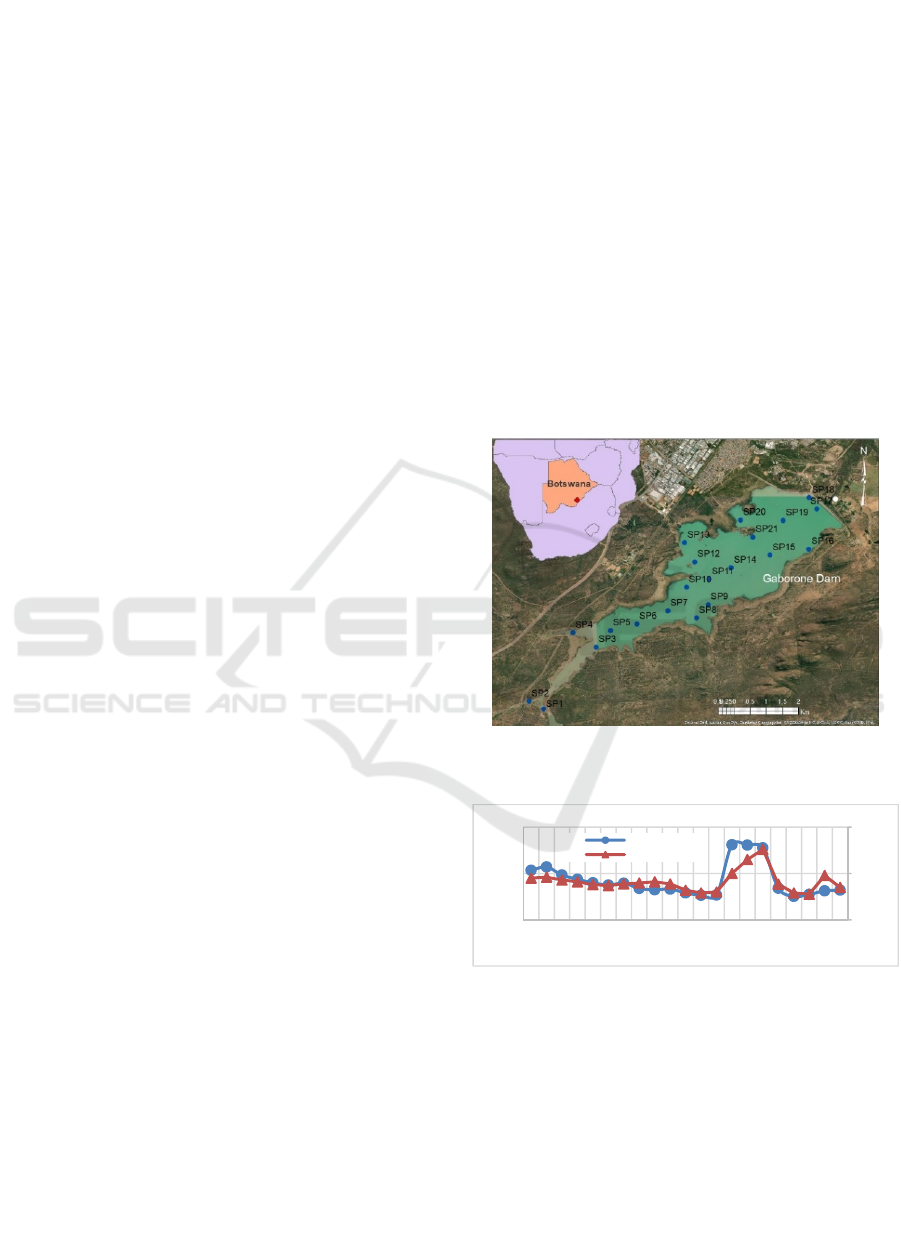
The case study is Gaborone dam, located in southern
eastern part of Botswana (Figure 1). The dam which
started operating in 1964 is managed by Water
Utilities Corporation (WUC) and has a storage
capacity of 141.4 million cubic meters (MCM)
(Ouma et al., 2022). The measured ranges for the
parameters were: Turbidity (20.3-64.8 NTU) and
TDS (112.8-117.6 mg/L).
Figure 1: Location of Gaborone dam in Botswana and
distribution of sampling points (SP1-SP21).
Figure 2: Spatial profiles of measured Turbidity and TDS
concentrations in Gaborone dam (Botswana).
2.2 Data
2.2.1 Water Quality Parameter Sampling
Sampling was carried out from twenty-one (21)
spatially distributed sampling stations located over
the entire reservoir (Figure 1). The concentrations of
the WQPs were measured using a water depth
sampler on 28 November 2022. The spatial profiles
110
115
120
0
40
80
SP1
SP2
SP3
SP4
SP5
SP6
SP7
SP8
SP9
SP10
SP11
SP12
SP13
SP14
SP15
SP16
SP17
SP18
SP19
SP20
SP21
TDS (mg/L)
Turbidity (NTU)
Sampling points
Measured Turbidity and TDS variation in Gaborone dam
Turbidity (NTU)
TDS (mg/L)
GISTAM 2024 - 10th International Conference on Geographical Information Systems Theory, Applications and Management
98

of the measured WQPs are presented in Figure 2 for
Turbidity and TDS.
2.2.2 Multispectral UAV-Drone Data
Drone image data was captured with the DJI
Phantom 4 Pro using the five cameras for RGB, NIR
and Red-Edge. Table 1 summarizes the spectral and
spatial characteristics of the DJI-PH4 camera
systems. The drone data was acquired in DNG
format, with image width and height dimensions of
5472×3648, field of view (FOV) of horizontal
(73.7°) and vertical (53°) and the image bit depth of
16-bits. The DJI-PH4 images were collected at
flying height of 50 m with spatial resolution of about
3.6 cm per pixel. Geometric correction was carried
out using the affine transformation of the image
coordinates to GPS measured sampling point
coordinates.
The reflectance values of the five multispectral
bands were recorded for each water sampling data
point using the mean pixel value with a window size
of 20×20 pixels as recommended in (Yang et al.,
2022), to reduce errors in locating the sampling
points and their reflectances. During the data
collection, the sun glint effect was minimized but
not eliminated completely due to lack of either a
downwelling light sensor (DLS) or spectrally
calibrated Lambertian reference panels within the
FOV of the camera for acquiring information on the
irradiance. Thus, to minimize the sun glint effects, a
dual radiometric correction approach comprising of
first histogram matching of the drone reflectance to
the radiometrically corrected Sentinel-2 MSI, and
then Linear Scanning Bias Correction (LSBC)
adjustment to the Landsat-9 was applied. Eq. 1
shows the calculation of final DJI-PH4 spectral
reflectance using LSBC. Detailed approach for
LSBC is outlined in (Ouma et al., 2024).
{}
{}
1
9
21
DN
m
DNL
DD
m
DN
DN DN
μ
μ
=×
(1)
where
1
D
DN
is the histogram adjusted drone
reflectance (DN),
{}
9
m
D
NL
μ
is the mean of Landsat-9
reflectance,
{}
1
m
D
N
μ
is the mean of histogram
adjusted drone reflectance, and
2
D
DN
is the
corrected drone reflectance.
Figure 3 presents the spectral reflectance patterns
from the 21 sampling points from DJI-PH4 (Figure
3(a)) and for S2-MSI (Figure 3(b)).
2.2.3 Sentinel-2 MSI Data
Sentinel-S2 MSI (S2-MSI) data was acquired from
the Copernicus Open Access Hub European Space
Agencies (https://scihub.copernicus.eu/). The S2-
MSI is a high-resolution multispectral imaging
mission which includes two twin satellites (Sentinel-
2A and Sentinel-2B) in the same sun-synchronous
orbit at a mean altitude of 786 km but offset 180
degrees to give a revisit frequency of 5 days at the
equator. The attributes of the S2-MSI satellite
imagery are presented in Table 1. An average spectral
reflectance of 2×2 pixel neighbourhood configuration
was used to accurately correlate the reflectance with
the WQPs.
From the five multispectral bands in both sensors,
84 bands combinations were derived and compared
for the retrieval of Turbidity and TDS.
2.3 Methods
2.3.1 Empirical Linear Regression
The multivariate regression model for estimating the
water quality parameters is developed by determining
the quantitative relationships between the measured
(a) (b)
Figure 3: Spectral reflectance from sampling points from (a) DJI-PH4 UAV-drone, and (b) Sentinel-2 (S2-MSI).
0
0.1
0.2
0.3
SP1
SP2
SP3
SP4
SP5
SP6
SP7
SP8
SP9
SP10
SP11
SP12
SP13
SP14
SP15
SP16
SP17
SP18
SP19
SP20
SP21
Reflectance
Sampling Points
Reflectance from UAV-Drone sampling points
S-Blue S-Green
S-Red S-NIR
S-RedEdge
0
0.1
0.2
0.3
SP1
SP2
SP3
SP4
SP5
SP6
SP7
SP8
SP9
SP10
SP11
SP12
SP13
SP14
SP15
SP16
SP17
SP18
SP19
SP20
SP21
Reflectance
Sampling Points
Reflectance from Sentinel-2 MSI sampling points
D-Blue D-Green
D-Red D-NIR
D-RedEdge
Prediction of Turbidity and TDS in Dam Reservoir from Multispectral UAV-Drone and Sentinel-2 Image Sensors Using Machine Learning
Models
99

Table 1: Spectral and spatial band characteristics for the DJI P4 Multispectral and Sentinel-S2 MSI image data.
Date of
Acquisition
Band
Number
Spectral
Band
Band Central
Wavelength
i
ρ
(nm)
Band
Width (nm)
Spatial
Resolution (m)
DJI-PH4
Drone
Sentinel-2
MSI
DJI-PH4
Drone
Sentinel-2
MSI
DJI-PH4
Drone
Sentinel-2
MSI
28-Nov-
2022
B1 (
1
D
B
ρ
)
Blue (B) 450 490 32 65 0.036 10
B2 (
2
D
B
ρ
)
Green (G) 560 560 32 35 0.036 10
B3 (
3
D
B
ρ
)
Red (R) 650 665 32 30 0.036 10
B4 (
4
D
B
ρ
)
NIR 840 842 52 115 0.036 10
B5 (
5
D
B
ρ
)
Red-Edge
(RE)
730 740 32 20 0.035 20
in-situ water quality parameter and the reflectance
from the satellite spectral data. Linear:
*()
i
ab
ρ
λ
+
;
polynomial:
12
*() *() *()
nn n
ii i
ab c d
ρλ ρλ ρλ
−−
+++
(n ≤ 3); logarithmic:
10
*log ( )
i
ab
ρ
λ
+
; power:
*()
b
i
a
ρ
λ
, and exponential:
*( )
*e
i
b
a
ρ
λ
regression
models were used. In the ELR, 15 sampling points
data were used for the model development and the
remaining 6 data points used in the testing the model.
To determine the best-fit model,
2
R
and the
statistical metrices in section 2.3.4 below were used.
2.3.2 XGBoost Algorithm
Extreme Gradient Boosting (XGBoost) is based on the
decision-tree optimization concept and built on the
gradient descent approach. Utilizing the gradient
descent, XGBoost optimizes the loss function while
preventing overfitting by employing regularization
parameters (Le et al., 2021). The fundamental
approach in XGBoost algorithm is on the basis of
minimizing the objective function which comprises of
the loss function and regularization terms. Boosting
occurs in instances when the model’s prediction is not
accurate or complex. To solve such instances, the
algorithm skews the observational distributions to
include difficult measures within the probable sample.
Thua, the weak student focuses more on predicting the
complex instances accurately. A more powerful
XGBoost predictor is then derived combining all the
prediction rules into a single model (Le et al., 2021).
2.3.3 Random Forest Regression
Like XGBoost, RFR is an ensemble learning
regression based on a decision tree algorithm. It is an
extended decision tree algorithm that combines the
decision trees; however, each tree is trained
independently. The RFR principle entails randomly
generating different unpruned CART decision trees,
in which the decrease in Gini impurity is regarded as
the splitting criterion (Breiman, 2001). As a bootstrap
resampling and bagging approach, the bootstrap
samples from the training dataset are fitted with an
unpruned decision tree for each bootstrap sample. At
the decision tree nodes, variable selection is made on
small random subsets of the predictor variables and
the best split from the predictors used to split the
node. The trees in the forest are averaged or voted to
generate output probabilities and a final model that
generates a robust regression model.
2.3.4 Prediction Performance Evaluation
The statistical measures in Eqs. 2-6 were used to
determine the accuracy of the regressions between the
predicted and the measured WQPs. In Eqs. 2-6,
coefficient of determination (R
2
), mean absolute error
(MAE), root mean square error (RMSE), Nash–
Sutcliffe model efficiency (NSE) coefficient and
percent bias (PBIAS) are used.
i
x
and
i
y
are
respectively the laboratory measured (observed) and
the model predicted WQPs concentrations at each
sample point i for n samples.
()
() ()
2
2
1
22
11
()
R
n
ii
i
nn
ii
ii
yyxx
yxyx
=
==
−⋅−
=
−−
⋅
(2)
1
1
MAE
n
ii
i
x
y
n
=
=−
(3)
2
1
1
RMSE= ( )
n
ii
i
x
y
n
=
−
(4)
()()
22
11
NSE 1 /
nn
ii i
ii
x
yxx
==
=− − −
(5)
()
11
PBIAS= / 100%
nn
ii i
it
yx x
==
−×
(6)
GISTAM 2024 - 10th International Conference on Geographical Information Systems Theory, Applications and Management
100

3 RESULTS AND DISCUSSIONS
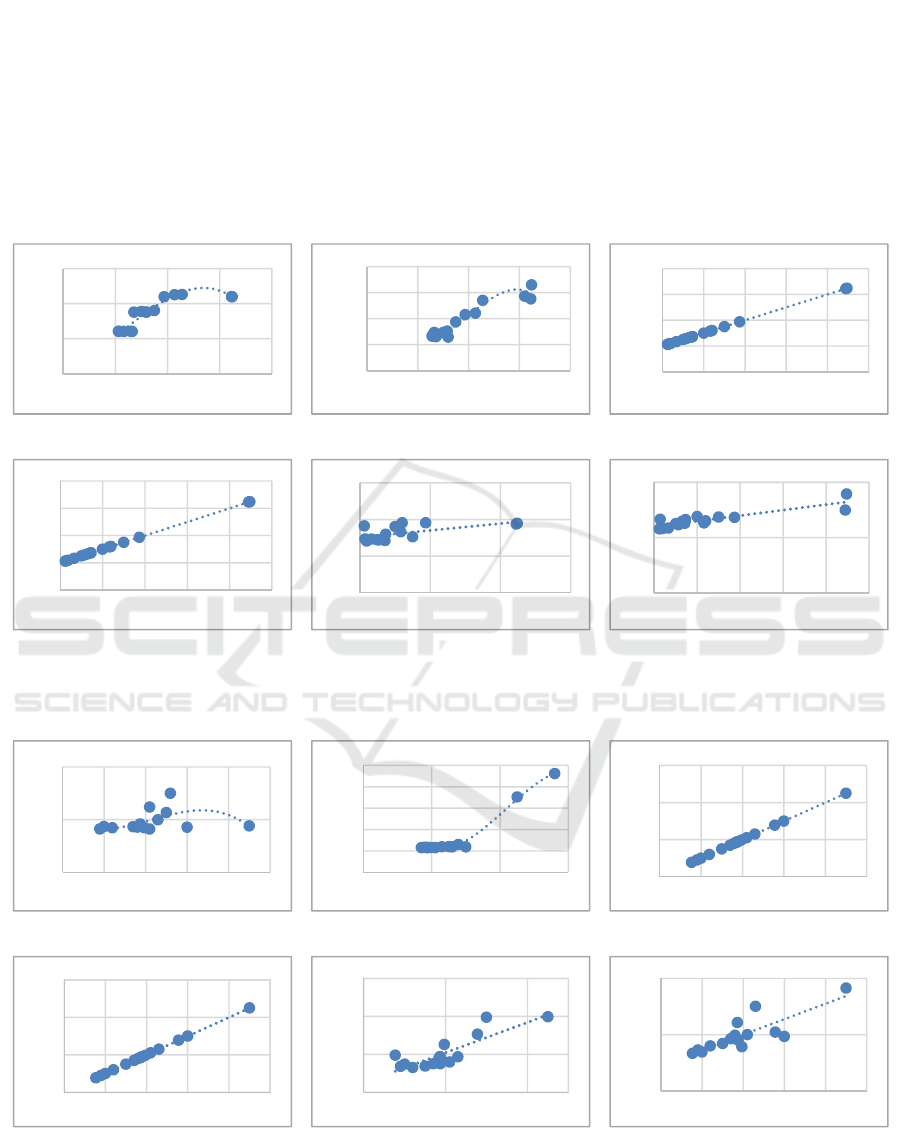
3.1 Estimation of Turbidity from
DJI-PH4 and Sentinel-2 MSI
Sensors
The results for the prediction of Turbidity using DJI-
PH4 and S2-MSI are respectively presented in
Figures 4(a)-(b) for the best regression model using
ELR, Figures 4(c)-4(d) for XGBoost and Figures
4(e)-4(f) for RF. With third-order polynomial
regression, the ELR modelling showed that Turbidity
was predicted from the two sensors with high R
2
accuracy of 0.908 (DJI-PH4) and 0.942 (S2-MSI).
The blue (B1) and the Red-Edge (B5) were observed
to be the most significant in the prediction of
Turbidity from DJI-PH4. From S2-MSI, blue (B1)
and NIR (B4) bands were the most informative band
combinations in the prediction of Turbidity using
ELR.
The results for the XGBoost in Figure 4(c)-4(d)
indicate that a combination of the first three bands for
the drone and band difference between red (B3) and
Red-Edge (B5) from Sentinel-2 had the most
significant contributions to the prediction of
Turbidity, with perfect model training prediction
accuracy of for both sensors. The performance of RF
was however slightly lower than ELR and XGBoost,
with regression R
2
of 0.775 and 0.392 respectively
from drone and satellite data.
From the training results in the prediction of the
concentration of Turbidity in Gaborone dam, the
results show that both DJI-PH4 drone and Sentinel-2
gave good results when using the XGBoost model,
with the least MAE and RMSE of less than 0.001
NTU, NSE = 100% and negligible PBIAS. While
good results were obtained for the testing phase in
terms of low PBIAS, the low number and the
variability in the concentration of Turbidity for the six
testing points resulted in low R
2
for XGBoost and RF
and with corresponding higher MAE and RMSE as
compared to the ELR results. These results indicate
that there is a high variability in the concentration of
Turbidity within the dam and therefore more
sampling points are necessary to improve on the
prediction accuracy of the machine learning
algorithms especially at the testing phase.
For the estimation of Turbidity, the five bands are
observed to yield the good results from both sensors.
This indicates that the reflectance of turbid
particulates could be much higher in the lower
spectral wavelengths. In similar studies, Prior et al.
(2021) demonstrated the retrieval of Turbidity in
streams with R
2
= 0.78 using drone image data.
Similar results were also obtained by (Lotfi et al.,
2019), with the highest correlation obtained between
the reflectance values of red and blue bands and
measured Turbidity. Nearly similar results are
observed in the current study in which the visible
bands models for both sensors are found to be useful,
in addition to the Red-Edge band.
3.2 Retrieval of TDS from DJI-PH4
and Sentinel-2 MSI Sensors
TDS prediction results from DJI-PH4 and S2-MSI are
respectively presented in Figures 5(a)-(b) for the best
regression models using ELR, Figures 5(c)-5(d) using
XGBoost and Figures 5(e)-5(f) using RF. From the
ELR results, TDS was predicted from DJI-PH4 and
S2-MSI data with respective R
2
of 0.277 and 0.991
(Figure 5). Using the DJI-PH4 sensor, the green (B2)
and NIR (B4) combination was the most significant,
while blue and Red-Edge bands were the most
suitable for the prediction of TDS using XGBoost and
RF. For S2-MSI, the different models determined
different band combinations as the most informative,
with the NIR being significant for both ELR and
XGBoost models.
For both sensors, the best results for the prediction
of TDS is obtained using XGBoost. With the spectral
reflectance from band 1 (B1) and band 5 (Red-Edge)
for DJI-PH4 sensor, the XGBoost model showed
perfect training and accurate model testing outcomes
with average accuracy metrices of R
2
= NSE = 0.835;
MAE = 0.714 mg/L; RMSE = 0.804 mg/L, and
negligible PBIAS. The training and testing for TDS
prediction with RF using the same band combination
of blue (B1) and Red-Edge (B5), gave acceptable
average prediction results however with lower
accuracy than XGBoost with R
2
= NSE = 0.566;
MAE = 0.718 mg/L; RMSE = 0.977 mg/L, and
PBIAS of less than 1%. ELR performed better than
RF but marginally lower than XGBoost.
The S2-MSI results are observed to be nearly
similar to the DJI-PH4 results, except for ELR relying
on the combination of NIR and Red-Edge bands for
the best regression results, while XGBoost performed
well with the combination of blue and NIR bands, and
RF combined all the bands except NIR. The results
indicate that both sensors are suitable for detecting
the variability of TDS in the reservoir with best
accuracy from XGBoost.
Despite the low R
2
for both WQPs, the observed
output test values were within suitable standard
deviations from the observed data especially for the
TDS results. From previous studies, Peterson et al
Prediction of Turbidity and TDS in Dam Reservoir from Multispectral UAV-Drone and Sentinel-2 Image Sensors Using Machine Learning
Models
101
(2019) modelled TDS using the five ML models
including multi-linear regression (MLR), partial
least-squares regression (PLSR), Gaussian process
regression (GPR), support vector regression (SVR),
and extreme learning machine regression (ELR), and
found that the SVR was suitable for training while
MLR was best for testing. Further, in the prediction
of TDS, Asadollahfardi et al (2012) developed ANN
model for TDS prediction in the Talkheh Rud River
(Iran), with high accuracy of R = 0.964.
3.3 Further Analysis
It is observed that for XGBoost and RF, the few
numbers of testing datasets resulted in the overfitting
effect during the testing phase. The overfitting
implies that the model learned more about the
individual data characteristics, hence good training
results, but did not significantly learn about the
substantive discipline of the dataset due to the few
samples.
(a) (b) (c)
(d) (e) (f)
Figure 4: Correlation between in-situ measured and predicted Turbidity concentrations from DJI-PH4 and Sentinel-2 MSI
sensors using: (a)-(b) Empirical Linear Regression (ELR), (c)-(d) XGBoost (XGB) and (e)-(f) Random Forest (RF).
(a) (b) (c)
(d) (e) (f)
Figure 5: Correlation between in-situ observed and predicted TDS concentrations from DJI-PH4 and Sentinel-2 MSI sensors
using: (a)-(b) Empirical Linear Regression (ELR), (c)-(d) XGBoost (XGB) and (e)-(f) Random Forest (RF).
y = -0.0004x3 + 0.0308x2 + 0.4149x +
4.3507
R² = 0.908
0
20
40
60
0 20406080
ELR Pred Turbidty (NTU)
Observed Turbidity (NTU)
Turbidity: Drone using ELR
y = -0.0016x3 + 0.1997x2 - 6.6647x +
93.429
R² = 0.942
0
20
40
60
80
0 20406080
ELR Pred Turbidty (NTU)
Observed Turbidity (NTU)
Turbidity: S2-MSI using ELR
y = 1.000x + 0.001
R² = 1.000
0
20
40
60
80
20 30 40 50 60 70
XGB Pred Turbidity (NTU)
Observed Turbidity (NTU)
Turbidity: S2-MSI using XGBoost
y = 1.000x + 0.001
R² = 1.000
0
20
40
60
80
20 30 40 50 60 70
XGB Pred Turbidity (NTU)
Observed Turbidity (NTU)
Turbidity: Drone using XGBoost
y = 0.1871x + 26.59
R² = 0.3922
0
20
40
60
20 40 60 80
RF Pred Turbidity (NTU)
Observed Turbidity (NTU)
Turbidity: S2-MSI using RF
y = 0.249x + 25.036
R² = 0.775
0
25
50
20 30 40 50 60 70
RF Pred Turbidity (NTU)
Observed Turbidity (NTU)
Turbidity: Drone using RF
y = -0.0508x3 + 17.404x2 - 1986.5x +
75689
R² = 0.276
113
114
115
112 113 114 115 116 117
ELR Pred TDS (mg/L)
Observed TDS (mg/L)
TDS: Drone using ELR
y = -0.1237x3 + 43.104x2 - 5006.1x +
193860
R² = 0.991
113
114
115
116
117
118
112 114 116 118
ELR Pred TDS (mg/L)
Observed TDS (mg/L)
TDS: S2-MSI using ELR
y = 1.000x + 0.052
R² = 1.000
112
114
116
118
112 113 114 115 116 117
XGB Pred TDS (mg/L)
Observed TDS (mg/L)
TDS: Drone using XGBoost
y = 0.999x + 0.069
R² = 1.000
112
114
116
118
112 113 114 115 116 117
XGB Pred TDS (mg/L)
Observed TDS (mg/L)
TDS: S2-MSI using XGBoost
y = 0.399x + 68.588
R² = 0.704
113
114
115
116
112 114 116
RF Pred TDS (mg/L)
Observed TDS (mg/L)
TDS: Drone using RF
y = 0.275x + 82.708
R² = 0.685
113
114
115
112 113 114 115 116 117
RF Pred TDS (mg/L)
Observed TDS (mg/L)
TDS: S2-MSI using RF
GISTAM 2024 - 10th International Conference on Geographical Information Systems Theory, Applications and Management
102

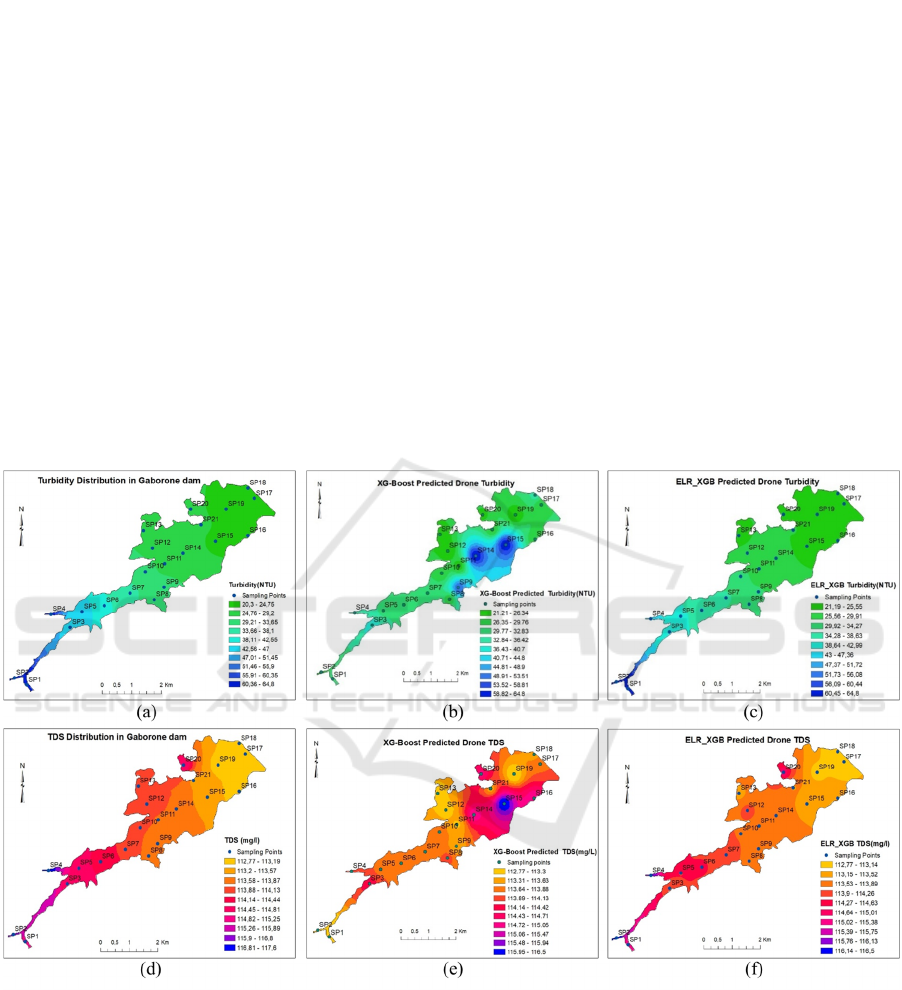
The spatially interpolated results using Inverse
Distance Weighting (IDW) for the observed
Turbidity and TDS are respectively presented in
Appendix (a) and Appendix (d). The predicted water
quality parameters from drone data using XGBoost as
the best regression model is visually presented in
Appendix (b) and Appendix (e).
From the visualization of the IDW interpolation
results in the Appendix, it is inferred that the use of a
single ML model may not always give accurate
prediction results. This, is attributed in part to the
complexity of bio-optical responses of the water
quality parameters and to the few number sampling
stations, requires the development of ensemble ML
approaches that combines the advantages of the of the
optimal machine learning algorithms for a given
WQP (Satish et al., 2024).
For the minimization of overfitting, not only
should the sampling data be increased, but ensemble
ML can be modelled such that the inputs of the second
stage contain both the spectral indices and the
prediction results from the first-stage ML method.
The results in Appendix (c) and Appendix (f) shows
the improvements in the prediction of Turbidity and
TDS with the ensemble ELR-XGBoost in using the
DJI-PH4 drone data.
4 CONCLUSIONS
In this study, spectral indices with different band
combinations were constructed from the spectral
reflectances of DJI-PH4 Multispectral UAV-Drone
and Sentinel-2 satellite data for the retrieval of
concentrations of Turbidity and TDS water
parameters in a dam reservoir. For the case study of
Gaborone dam (Botswana), the sensor spectral
reflectance and the in-situ measured WQPs were
modelled using univariate Empirical Linear
Regression (ELR), XGBoost and RFR machine
learning models. For both WQPs, XGBoost
performed better in the model training phase,
however third-order polynomial ELR gave good
results for training and testing of the drone and
satellite reflectance data. Turbidity prediction results
from the drone and satellite data showed that the ELR
multivariate regression model outperformed the
XGBoost in data testing and was also better than RF
in both training and testing phases. For the prediction
of TDS, XGBoost gave the best results for both the
drone and satellite data. The XGBoost and ELR
ensemble algorithm demonstrated the ability to
improve water quality parameter inversion as the
ensemble WQP prediction results were higher than
from single ML models. While the absolute accuracy
for the retrieval of WQPs still requires improvements
such as the inclusion of seasonal variability
measurements and increasing the number of sampling
stations, the current results on the WQPs prediction
using machine learning algorithms demonstrates the
potential of using the drone and satellite sensors for
spatial retrieval of Turbidity and TDS in dam
reservoirs. The proposed histogram equalization and
linear bias adjustment of the drone spectral
reflectances based respectively on Sentinel-2 MSI
and Landsat-9 OLI2 satellite data is found to provide
suitable results. Based on the comparatively similar
WQPs estimation results from the drone and satellite
sensors, the sensors can be integrated to exploit the
high temporal resolution of drone sensors, and the
dynamic spectral band wavelengths in the Sentinel-
MSI for improved water quality monitoring in dam
reservoirs.
ACKNOWLEDGEMENTS
The authors acknowledge the Water Utilities
Corporation (WUC) of Botswana for providing the
in-situ measured water quality data used in this study.
This research project was funded by both the USAID
Partnerships for Enhanced Engagement in Research
(PEER) under the PEER program cooperative
agreement number: AID-OAA-A-11-00012.
REFERENCES
Asadollahfardi, G., Taklify, A., Ghanbari, A. (2012).
Application of artificial neural network to predict TDS
in Talkheh Rud River. Journal of Irrigation and
Drainage Engineering, 138(4), 363-370.
Breiman, L (2001) Random forests. Machine Learning, 45,
5–32.
Chen, B., Mu, X., Chen, P., Wang, B., Choi, J., Park, H.,
Xu, S., Wu, Y., Yang, H. (2021). Machine learning-
based inversion of water quality parameters in typical
reach of the urban river by UAV multispectral data.
Ecological Indicators, 133, 108434.
Le, N.Q.K., Do, D.T., Le, Q.A. (2021). A sequence-based
prediction of Kruppel-like factors proteins using
XGBoost and optimized features. Gene, 787, 145643.
Lotfi, G., Ahmadi, N.M., Abolhasani, M. (2019). The
feasibility of using Landsat OLI images for water
turbidity estimation in Gandoman wetland. Iran.
Journal of Radar and Optical Remote Sensing, 2(2),
49–62.
Ouma, Y.O., Keitsile, A., Lottering, L., Nkwae, B. and
Odirile, P., 2024. Spatiotemporal empirical analysis of
particulate matter PM2. 5 pollution and air quality
Prediction of Turbidity and TDS in Dam Reservoir from Multispectral UAV-Drone and Sentinel-2 Image Sensors Using Machine Learning
Models
103
index (AQI) trends in Africa using MERRA-2
reanalysis datasets (1980–2021). Science of The Total
Environment, 912, p.169027.
Ouma, Y.O., Moalafhi, D.B., Anderson, G., Nkwae, B.,
Odirile, P., Parida, B.P., Qi, J. (2022). Dam water level
prediction using vector autoregression, random forest
regression and MLP-ANN models based on land-use
and climate factors. Sustainability, 14(22), 14934.
Ouma, Y.O., Waga, J., Okech, M., Lavisa, O., Mbuthia, D.
(2018). Estimation of reservoir bio-optical water
quality parameters using smartphone sensor apps and
Landsat ETM+: review and comparative experimental
results. Journal of Sensors, Article ID 3490757.
Peterson, K.T., Sagan, V., Sidike, P., Hasenmueller, E.A.,
Sloan, J.J., Knouft, J.H. (2019). Machine learning-
based ensemble prediction of water-quality variables
using feature-level and decision-level fusion with
proximal remote sensing. Photogrammetric
Engineering & Remote Sensing, 85(4), 269-280.
Prior, E.M., O’Donnell, F.C., Brodbeck, C., Runion, G.B.,
Shepherd, S.L. (2021). Investigating small unoccupied
aerial systems (sUAS) multispectral imagery for total
suspended solids and turbidity monitoring in small
streams. International Journal of Remote Sensing,
42(1), 39-64.
Satish, N., Anmala, J., Rajitha, K. and Varma, M.R. (2024).
A stacking ANN ensemble model of ML models for
stream water quality prediction of Godavari River
Basin, India. Ecological Informatics, p.102500.
Shi, J., Shen, Q., Yao, Y., Li, J., Chen, F., Wang, R., Xu,
W., Gao, Z., Wang, L., Zhou, Y. (2022). Estimation of
chlorophyll-a concentrations in small water bodies:
comparison of fused Gaofen-6 and Sentinel-2 sensors.
Remote Sensing, 14(1), 229.
Yang, H., Du, Y., Zhao, H., Chen, F. (2022). Water quality
Chl-a inversion based on spatio-temporal fusion and
convolutional neural network. Remote Sensing, 14(5),
1267.
APPENDIX
Appendix: Inverse Distance Weighting (IDW) interpolated: (a) measured Turbidity, (b) XGBoost predicted Turbidity from
DJI-PH4 Drone data; (c) ensemble ELR-XGBoost predicted Turbidity from DJI-PH4 Drone data; (d) measured TDS, (e)
XGBoost predicted TDS from DJI-PH4 Drone, and (f) ensemble ELR-XGBoost predicted TDS from DJI-PH4 Drone data.
GISTAM 2024 - 10th International Conference on Geographical Information Systems Theory, Applications and Management
104
