
Human-Centered e-Health Development: An Accessible Visual Modeling
Tool
Jingyuan Shen
1
, Hourieh Khalajzadeh
2 a
and Anuradha Madugalla
1 b
1
HumaniSE Lab, Monash University, Clayton, Victoria, Australia
2
School of Information Technology, Deakin University, Melbourne, Australia
Keywords:
Domain Specific Modeling Language (DSML), e-Health, Software Modeling, Visual Notation.
Abstract:
e-Health enables easy access to medical services without some of the limitations of traditional medical ser-
vices such as restricted access to specialists and the need to travel long distances. With the recent advances in
IT, more and more people are adopting e-health solutions. However, most of the domain experts and end users
who may be involved in developing these e-health applications may not have an IT background. This makes
it hard for them to contribute to its development. This paper presents a human-centered e-Health modeling
language, to help end-users easily specify their requirements and communicate with domain experts and clin-
icians to design and develop personalized e-health applications. The tool aims to provide a common language
between developers and domain experts, assisting the interdisciplinary teams to focus on the project itself
rather than on communication. We built a visual web application using the SiriusWeb platform to implement
our approach and evaluated its accessibility and usability with 11 end users. Participants reported that the tool
was straightforward to use without any IT knowledge, and notations were distinguishable and expressive.
1 INTRODUCTION
E-Health is “The use of information and communi-
cations technology in support of health and health-
related fields” (WHO, 2019). It enables people to ac-
cess a wide range of medical services from anywhere.
Compared to traditional health services, e-Health al-
lows to deliver medical services for less cost, espe-
cially when medical resources are limited.
As more people start accessing health-related in-
formation through the internet, the majority are seek-
ing for more personalized, more accessible, and more
interactive medical services to improve their and their
family’s health. This leads to the challenge of meet-
ing the needs of different patient groups. In order
to effectively address this people with diverse back-
grounds need to join in e-Health software develop-
ment projects. Such projects involve bringing to-
gether stakeholders with a variety of skill sets, di-
verse expertise, and backgrounds to communicate and
interact as multidisciplinary teams. In such teams,
many will not be experts in software programming
(Khalajzadeh et al., 2020b). Therefore, some soft-
ware engineering projects implement Model-driven
a
https://orcid.org/0000-0001-9958-0102
b
https://orcid.org/0000-0002-3813-8254
Approach (MDA) in order to address issues brought
by the interaction between multi-disciplinary stake-
holders (Fischer et al., 2014). MDA abstracts key
software components into models, fuses them with
identifiers and notations to create a fictitious system
architecture, and tests the system’s performance be-
fore the development and deployment. The main ben-
efit of using MDA in software engineering is that even
though some of the project stakeholders have no IT
background and relevant skills, they can still engage
in the project and provide their insights and opinions
based on their domain expertise (Zhuang et al., 2022).
Software engineering has several modeling lan-
guages, such as UML, SysML (Hause et al., 2006),
WebML (Ceri et al., 2000), etc. to help software engi-
neers develop software more efficiently. However, by
exploring and comparing existing research, we found
several gaps in the existing modeling languages, such
as accessibility issues, and a lack of systematic and
human-centered evaluation.
The main objective of our paper is to present a
new Domain Specific Modeling Language (DSML)
for designing and modeling e-Health applications.
We present this along with a visual-based human-
centered modeling tool that uses our DSML to engage
all stakeholders in e-Health development projects.
Shen, J., Khalajzadeh, H. and Madugalla, A.
Human-Centered e-Health Development: An Accessible Visual Modeling Tool.
DOI: 10.5220/0012546100003687
Paper published under CC license (CC BY-NC-ND 4.0)
In Proceedings of the 19th International Conference on Evaluation of Novel Approaches to Software Engineering (ENASE 2024), pages 283-290
ISBN: 978-989-758-696-5; ISSN: 2184-4895
Proceedings Copyright © 2024 by SCITEPRESS – Science and Technology Publications, Lda.
283

Our new modeling tool defines key components of
e-Health and provides visual notations based on the
Web Content Accessibility Guidelines (WCAG) (An-
drew et al., 2018). It assigns corresponding symbols
to all concepts and allows users to select their pre-
ferred visual design. WCAG provides a wide range
of recommendations for improving the accessibility
of visual elements (Andrew et al., 2018), and these
helped us to design our visual notations. With this
process we have contributed to making e-Health de-
velopment processes more accessible and efficient to
multiple stakeholders. We evaluated our visual no-
tations by applying the rules of Physics of Notations
(PoN) (Moody, 2009) to the notations and by conduct-
ing a user study with a group of 11 end-users includ-
ing software engineers and business analysts.
2 MOTIVATION
MDA is used in software engineering to provide
guidelines and specifications for projects and their fi-
nal deliverable, making it one of the most efficient
ways of developing software (Brambilla et al., 2017).
In the beginning of a typical software engineering
project, the software engineers and system architects
communicate or interview domain experts and users
to gather requirements and their expectations. Based
on these, software engineers abstract requirements
into different models and combine them into a simple
system structure. This will then be presented to stake-
holders to illustrate how it meets their needs. How-
ever, due to the diverse backgrounds, there is, in fact,
no unified language or notations between these stake-
holders and developers (Khalajzadeh et al., 2020a).
It is more likely that some of the stakeholders can-
not understand what each model means, leading not
to reach a consensus on the software design. Mean-
while, development teams have to spend more time
explaining their progress and thoughts.
2.1 Example e-Health App Development
Consider a situation where a community is planning
to provide their residents with a novel e-Health mo-
bile application, which enables them to access med-
ical services more efficiently without the limitation
of time and location. The main objectives of this e-
Health application are to provide information regard-
ing common diseases, and to provide comprehensive
medical services such as medical consultation, pa-
tient registration, care plan generation, GP appoint-
ment booking, etc. Due to limited technical support,
the community decide to employ a technical team of
software engineers and system architects to develop
this application.
In this scenario the first challenge would arise
when the community finds that the team lacked ex-
pertise in medical and health areas. This may lead
to inviting some medial experts to help the team
deal with medical-related issues. However, these two
teams would struggle, in communication as they lack
a unified language to share their ideas. For example
when the developers need to demonstrate their up-
dates, they won’t be able to do it with a code or a
program. They can switch to using a visual languages
like diagrams, but it is likely that the medical sup-
port team would still struggle in understanding these.
This would be mostly because the notations used in
these diagrams vary significantly from the specific no-
tations used by the support team in their domain. This
makes the procedure of exchanging information take
a lot of time. It also reduces the contribution and in-
volvement of domain experts, as it is hard for devel-
opers to extract key information from them. There-
fore, as the complexity of the project grows, it would
become harder for stakeholders to track progress and
the collaborations would become difficult to manage.
2.2 Key Challenges
As mentioned above, we explore two key challenges
of existing e-Health projects and these are:
• As the participation of experts from other fields
increases, more effective methods are needed to
involve experts, as some have no IT background.
• Existing visual languages cannot demonstrate e-
Health architecture well, since they have no uni-
fied visual notations for e-Health concepts.
To solve these challenges, developers need a novel
unified language to illustrate their programs and to
better communicate with diverse stakeholders.
3 OUR APPROACH
The current e-Health area lacks a unifying language,
which makes communication between the develop-
ment team and domain experts difficult and ambigu-
ous. Thus we adopted MDA to assist with the de-
velopment process as well as engage domain experts
better in the projects. In our approach, we introduce
a novel visual modeling language to model e-Health
applications. In this study, we first conducted a sur-
vey to gather end-user requirements of e-Health and
to extract key concepts and components to include in
the meta-model. The preferences regarding the visual
ENASE 2024 - 19th International Conference on Evaluation of Novel Approaches to Software Engineering
284

notations of modeling tools from stakeholders in soft-
ware engineering projects were also collected. Based
on the findings, we selected various visual notations
for each of these concepts to design our Domain-
specific Modeling Language (DSML). Finally, with
SiriusWeb (an open-source low-code platform to de-
fine custom DMSLs), we built a web-based modeling
environment to implement our modeling tool.
3.1 Requirement Collection
Currently there are visual modeling languages for
software development such as System Modeling Lan-
guage (SysML) and Unified Modeling Language
(UML). However, these require users to possess a cer-
tain level of IT and coding knowledge to be able to
use them. To design the most appropriate DSML for
e-Health, we needed a clear understanding of the core
components and concepts of e-Health and modeling
tools. Thus, we conducted a survey with different
human-centric aspects to gather user requirements of
e-Health applications as well as preferences for visu-
alizing modeling languages.
Survey Design. We designed an online survey with
around 30 questions and separated the survey into
three main sections, personal information, e-Health
requirements, and modeling tool preferences. To ben-
efit from further exploring whether the preference and
requirement would be impacted by human character-
istics like gender, age, and role, we collected back-
ground information about all participants in the first
section. The third section, modeling tool preferences,
focuses on the end users’ preference for the visual no-
tations of modeling tools, in order to build a more
accessible modeling tool for our end-users. Detailed
survey content can be accessed on (Shen, 2023).
Data Collection. We prepared questionnaires in En-
glish and used Google Forms to share them. We re-
ceived approval for this survey from the University
ethics committee. The survey was advertised via in-
vitation advertisement sent to researchers’ networks,
the University’s alumni network, social media posts,
and personal contact.
Data Analysis. We applied various descriptive
statistics to investigate the association between key
social-demographic factors, such as age, gender, ma-
jor, role, and others, and design elements. Partici-
pants’ choices of design elements for building their
own e-Health application were analyzed by the Chi-
square test, as such variables are all categorical and
can be converted to frequencies. For those partic-
ipants who had experience in visual-based system
modeling (12 of 20, 60%), preference for visual no-
tations and functions of modeling tools were also in-
Figure 1: Color preferences of different age groups.
vestigated using the Pearson Correlation test.
3.2 Requirements Analysis
Demographic Results. A total of 20 valid responses
were received to the online survey. Regarding demo-
graphic data, 13 men (65%) and 7 women (35%) par-
ticipated in our study. Participants ranged between
18 to 55 years old. Half of the participants (10 of 20,
50%) were between the ages of 18-25. Ninety percent
of the participants were living in Australia, but they
spoke a variety of languages, with only 35 percent
mainly speaking English at home. Furthermore, the
participants were predominantly students (80%) and
all majored in IT-related fields, namely Computer Sci-
ence, Information Technology, Artificial Intelligence,
Data Science, Software Engineering, and Cyber Se-
curity. Based on what they claimed, all participants
can be divided into 10 different role groups, such as
Software Developer, Computer Network Architect, IT
Project Manager, etc. Plus, 13 (65%) participants
responded that they had experience in using visual-
based modeling languages, and they were all willing
to share their preferences and experience with model-
ing tools with us.
e-Health Requirement. We first asked participants
for the major reason for accessing the e-Health plat-
forms. A majority responded that they used it to find
a General Practitioner (GP), while some who men-
tioned they used e-Health to track their health status.
We then provided participants with the user interface
of several e-Health platforms that are commonly used,
such as HotDoc and HealthEngine and asked them to
select their preferred one. The main reason for their
choices was the higher accessibility of the layout and
design elements on the user interface of these plat-
forms. Therefore, a more accessible and usable user
interface should be one of the key components of the
e-Health platform.
We assumed that people with different human as-
pects may have various preferences on the design. We
Human-Centered e-Health Development: An Accessible Visual Modeling Tool
285
found a significant relationship between age and de-
sign preferences. A chi-square test on age and color
revealed that increasing age was significantly corre-
lated with color preference for cool and warm color
themes (p = 0.05), indicating that cool color prefer-
ence showed a downward trend with age. However,
no significant differences were found in preference
for icon design or text size with age. Older age groups
had a lower preference for cool tones, while those
aged 18 to 25 were more likely to prefer it (see Fig 1).
Our analysis of other human-centered factors showed
that there was no significant relationship between de-
sign elements and these human factors.
Preferences of Modeling Tool. MDA emphasizes
the use of models during the development phase to
provide a comprehensive vision for the development
of software and system. We first explored the partic-
ipants’ choice of notation styles. Respondents who
agreed to continue investigating the tool visual nota-
tion section were equally divided between icon-based
(38%) and shape-based (31%) symbol styles. A chi-
square analysis proved that age, gender and area were
indeed less relevant with notation style (p = 1). In
summary, diverse people have different preferences
on using visual notations for their e-Health applica-
tion diagrams, which indicates that providing multi-
ple visual notation styles are necessary to meet vari-
ous user requirements.
In this part of the survey, the importance of func-
tions and features in modeling tools were also rated
by participants. A Pearson correlation implemented
to find the relationship between participants education
and their chosen tool function showed that there was
no statistically significant relationship between these.
But over 75% participants thought that a recognizable
icon style is very necessary, as it is the most straight-
forward way to differentiate notations.
3.3 e-Health Meta-Model
There is currently no common language in e-Health,
making it difficult for developers and stakeholders to
clearly communicate designs and share perspectives.
Therefore, we present a DSML to support e-Health
projects. DSML is defined by meta-model, which rep-
resents important components in particular domains
and enables users to visualize and simulate system ar-
chitecture. Based on the findings of the survey, the
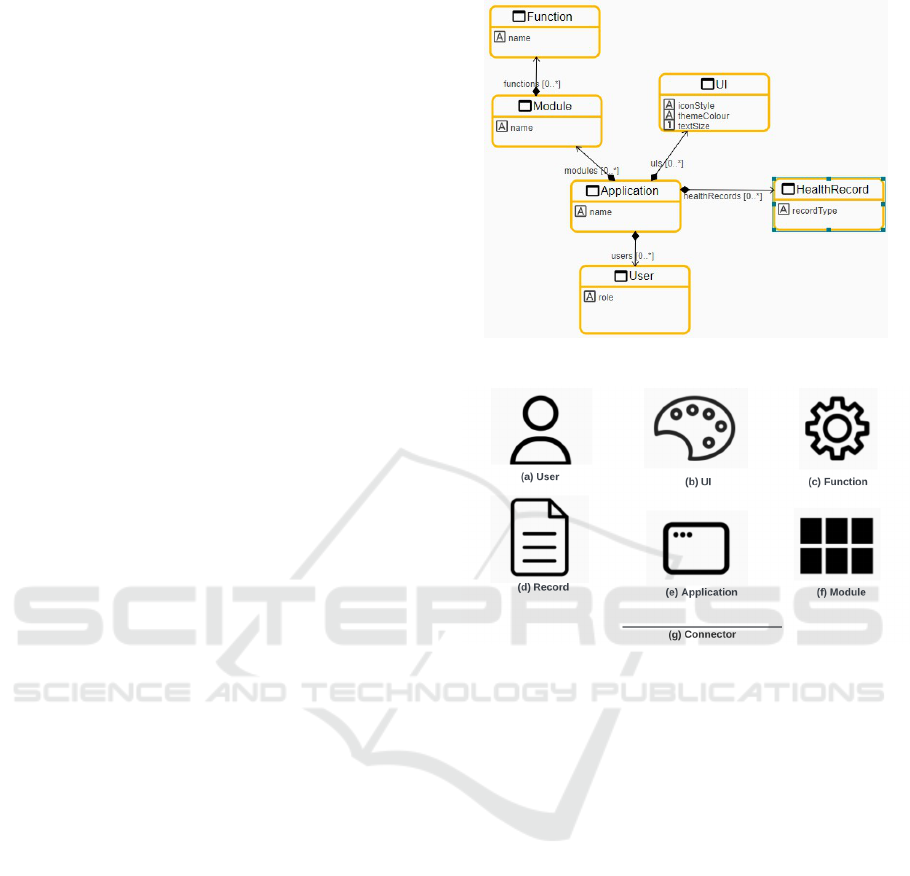
key entities of the e-Health meta-model are:
Application - represents the e-Health application it-
self. The application contains various entities to im-
plement the medical service and user interface. User
- represents all kinds of e-Health application users.
According to (Hesse and Shneiderman, 2007), there
Figure 2: e-Health meta-model.
Figure 3: Icon-based visual notations.
are 6 kinds of end users for e-Health, from healthcare
providers to individual patients. Health Record - rep-
resents types of health records, which bring together
various health information and physical examination
results from users, healthcare givers and medical or-
ganizations. UI - represents the user interface style
of the e-Health application, including theme color,
icon style, and so on, which enables end users to cus-
tomize the UI as they wish. Module - We defined an
entity called a Module to encapsulate multiple func-
tions. Each Module has its unique name and feature,
but there can be multiple duplicated functions inside
it. Function - is the specific function embedded in
a certain module. A function can be repeated and
can also be different in different modules. Connector
- represents the relationships between entities within
the applications.
Multiple properties inside of each entity make
them more feasible and expressive. For example, UI
entity has design element properties that determine
how the user interface and other functions are pre-
sented to end users and how users can access medical
services more efficiently.
ENASE 2024 - 19th International Conference on Evaluation of Novel Approaches to Software Engineering
286
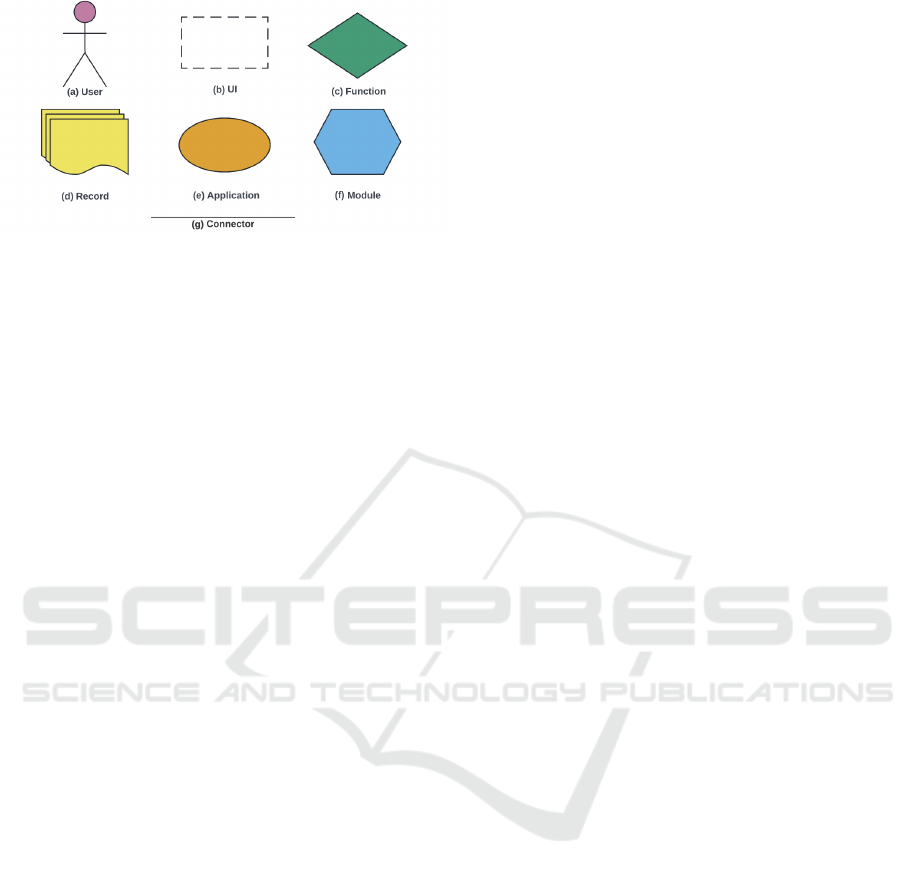
Figure 4: Shape-based visual notations.
3.4 e-Health Visual Notations
The new e-Health modeling language illustrates an e-
Health platform architecture at a broad and intuitive
level. There are no specific IT knowledge require-
ments to better support communication and collab-
oration between interdisciplinary team members to
identify key aspects and components of an e-Health
application such as its functional requirements, and
design elements. The findings from the requirement
survey indicated that most participants had a similar
tendency for two (shapes and icons) of three symbolic
styles that we provided in the survey, so we could not
directly conclude the most popular one. Therefore,
we presented two kinds of visual notations, domi-
nated by special icons and colored shapes, allowing
users to customise their preferred diagram style and
reducing the hurdle of involvement.
Icon-Based Notations. According to WCAG (An-
drew et al., 2018), to make visual elements perceiv-
able, our visual notation set comprises six distin-
guished special icons representing the core compo-
nents of e-Health platforms. The user icon (Fig 3 a)
indicates various user groups of e-Health, e.g. indi-
vidual patient, healthcare giver. The art icon (Fig 3
b) is intended to emphasize the design elements of
the user interface on the e-Health. Modules (Fig 3 f)
are presented by an icon constructed of several black
rectangles, meaning that it is composed of multiple
functions together, while its child functions are shown
by a gear icon (Fig 3 c) to emphasize their function-
ality. Web icon (Fig 3 e) is used to specify Appli-
cation models and health records are represented by
file icons (Fig 3 d). Finally, all individual component
models used in the same e-Health project need to be
connected to others by connectors (Fig 3 g). All icons
come with labels to improve their readability.
Shape-Based Notations. We assigned six distin-
guished shapes that are easy to differentiate, e.g. el-
lipse, rhombus, to present the shape-based visual no-
tations of our e-Health modeling tool (Fig 4). In order
to improve accessibility and provide a better visual
modelling experience, apart from the shape, we also
chose colors as the second feature to make it appro-
priate for all readers and users, including those who
are colorblind. Wong’s research project (Wong, 2011)
provides a palette of eight colors with good overall
variability for a visual design suitable for colorblind
people. Some of the colors in this palette are used in
our project to optimize our visual modeling symbols.
3.5 Graphical Editor
An experimental modeling tool was developed using
Eclipse SiriusWeb (https://www.eclipse.org/sirius/) to
support our DSML and corresponding visual nota-
tion sets. SiriusWeb is a framework to define cus-
tom web applications supporting modeling languages.
We chose SiriusWeb as custom models can be easily
shared with others by URL, so interdisciplinary team
members can collaboratively work on the modeling
projects simultaneously.
3.6 Specification Generator
As our tool considers humans as the central part of
the modeling, it allows users to specify their features.
For instance, as shown in Fig 5, users can define the
UI style of the e-Health application with red color and
flat icon style by using SiriusWeb graphic interface.
They can also specify their functions, e.g., booking
appointments. Then, our specification generator is
able to export the models to files in text-based for-
mats like XML (Fig 6), which can be shared for re-
mote collaboration. Because XML is extensible and
flexible, developers can use the XML file to define the
UI layout of e-Health apps based on the users’ needs.
Plus, Sirius enables generating code using Acceleo, a
template-based coding language that authorizes users
to create custom code generators. Since Sirius is built
on top of EMF, Acceleo can be utilized to generate
back-end code for any e-Health model in the EMF
format. Since we have not checked the collaboration
effectiveness between SiriusWeb and Sirius, custom
code generator will be our future plan.
4 EVALUATION
To determine the usability of our solution, we first
tested our modeling tool with PoN (Moody, 2009)
and WCAG 2.1 (Andrew et al., 2018). Since PoN
defines the detailed design principles of visual sym-
bols, we can check our tool step-by-step and revise
it efficiently even in the absence of our experimental
subjects. Secondly, we organized a group user study
Human-Centered e-Health Development: An Accessible Visual Modeling Tool
287
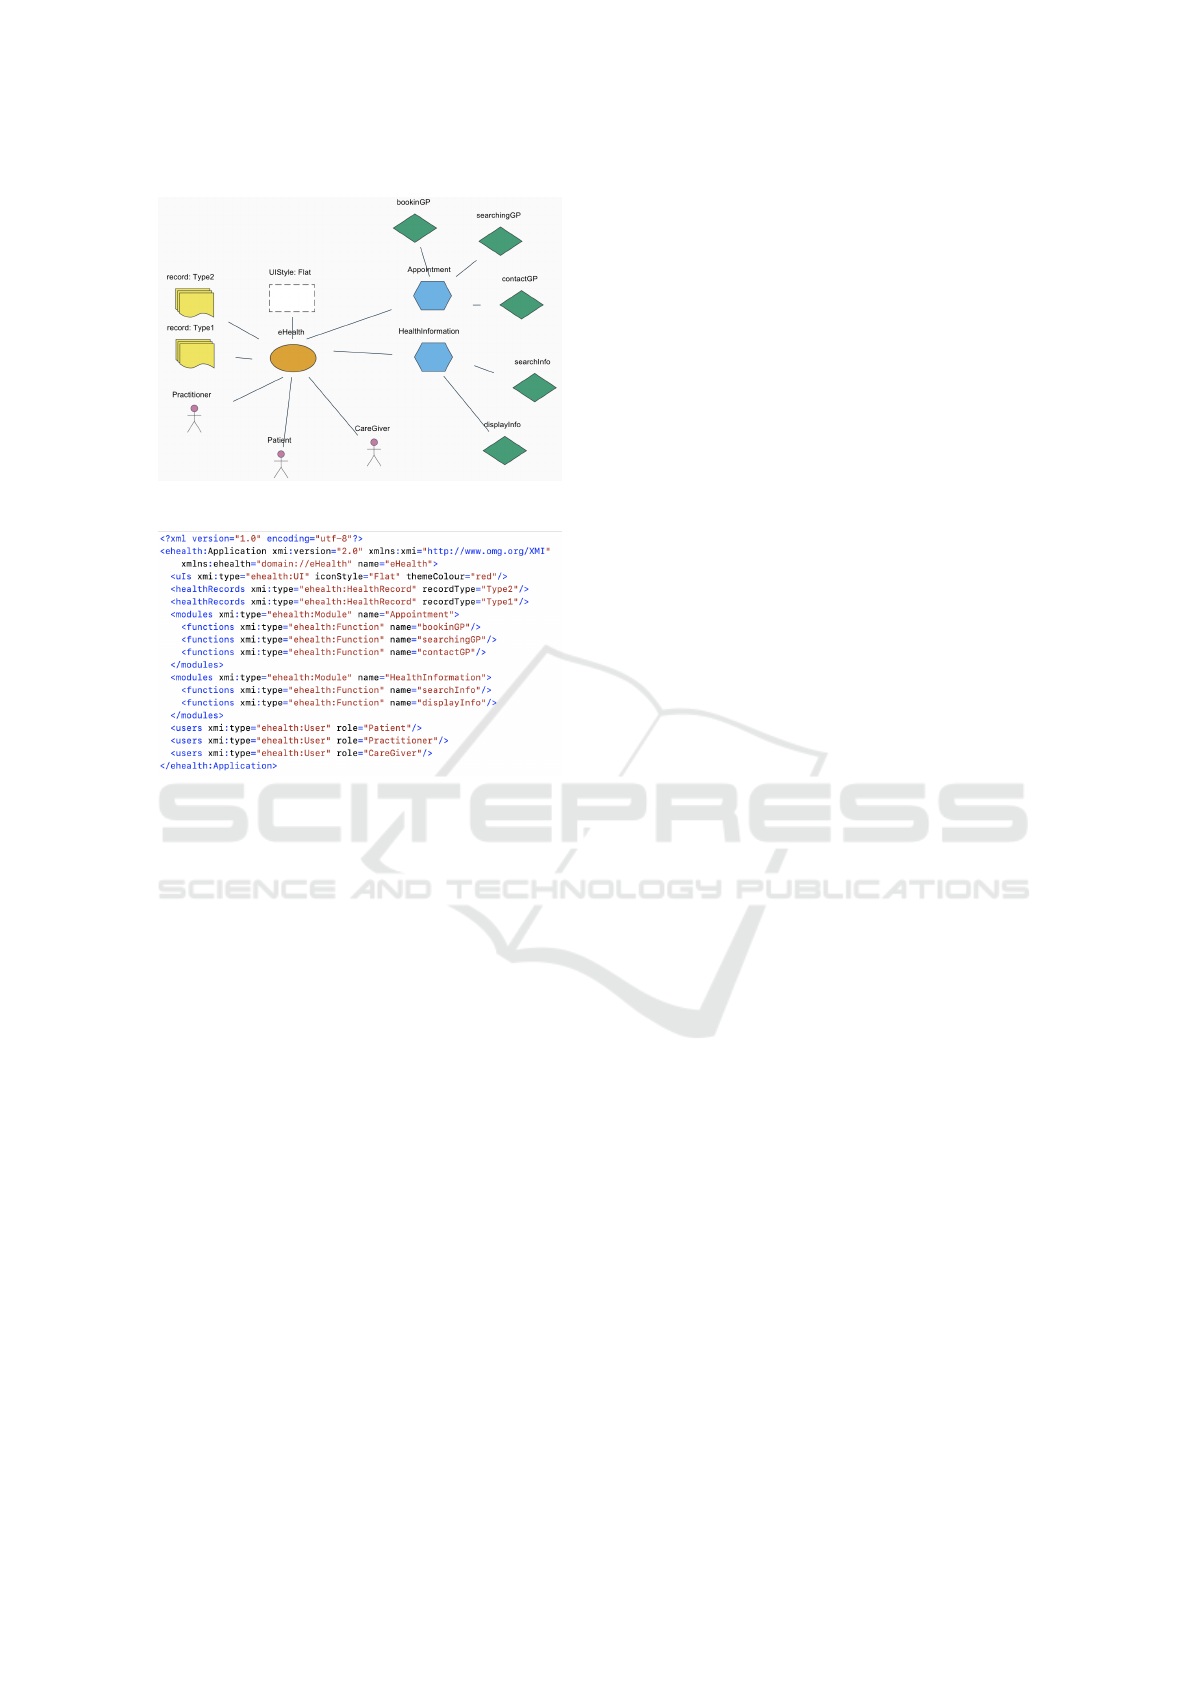
Figure 5: Sample of e-Health models.
Figure 6: Sample code of e-Health model specifications.
to test the effectiveness of the modeling tool in the
real-world e-Health development environment.
4.1 Physics of Notations
PoN (Moody, 2009) is used as a guide to test the ef-
fectiveness of our visual notations. PoN-based visual
language assessment and improvement has been used
in many studies, for example, (Famelis and Chechik,
2019; Khalajzadeh et al., 2020b). Due to space limita-
tions, only the test results are presented in this section.
Semiotic Clarity: In our modeling tool, all entities
have 1:1 correspondence to their visual notations.
Perceptual Discriminability: Both our shape-based
notations or icon-based notations are differentiated by
various symbols, color and labels. Semantic Trans-
parency: In the newly built modeling tool, especially
in the icon-based view, special icons are used to rep-
resent models to minimize confusion. Complexity
Management: We minimize the visual elements as
much as possible to deal with the visual complex-
ity, for example, in each visual representation, there
is only one notation for each kind of model. Cogni-
tive Integration: Our project contains only one kind
of chart, thus this principle does not work in this case.
Visual Expressiveness: Shape-based view utilizes po-
sition, shape, texture, and color to distinguish sym-
bols and convey meaning, while icon-based only uses
shape and position. Dual Coding: All our visual sym-
bols have corresponding textual annotations to rein-
force and clarify meaning. Graphic Economy: As
the meta-model of e-Health contains only six entities,
its corresponding views do not include more symbol
types (6 model notations and 1 connector notation).
Cognitive Fit: Based on the results of the needs sur-
vey, our tool provides users with two sets of visual
symbols to meet their needs. However, as our tool
currently only supports to design and understand e-
Health system architecture, no more visual dialects
are available for other tasks.
4.2 User Study
We recruited 11 participants (seven Master/PhD stu-
dents, one academic staff, and three participants from
industry) within Faculty of IT at the University as
well as social media like LinkedIn and WeChat. All
participants had a certain level of IT background as
well as software engineering experience. 3 partici-
pants recognized themselves as software engineers, 1
as system architect, 3 as domain expert/business ana-
lyst/business manager, and 3 as data scientists. We
had 7 men and 4 women in the study. The study
was conducted through a one-hour online session via
Zoom. Participants were asked to complete a relevant
questionnaire, to collect their feedback.
A case study regarding e-Health application de-
velopment was first provided with participants, and
we then asked them to choose any existing modeling
language like UML, BPMN, ER diagram, and mind
map, or their own ad hoc notations to model and de-
scribe their design on the canvas as the initial dia-
gram. We then introduced the concepts and notation
of the new modeling tool and asked them to model
the same e-health on a given SiriusWeb application
using our tool. Participants were required to choose
one of the visual notation sets and respond why they
prefer the chosen one. We randomly distributed the
newly drawn and initial diagrams among the partic-
ipants, while making sure that no one received their
own ones. In the next step, we asked participants to
compare the received diagrams and decide which one
they consider more proper to illustrate to other stake-
holders. Finally, they were asked to rate how easy the
new modeling tool was to understand, the IT knowl-
edge required to use it, and so on. Participants chose
a variety of visual modeling languages for their initial
diagrams, such as ER diagram and UML. The number
of people who chose flowchart notations was the most
(n=4), while only one chose to use ad hoc notations.
In terms of participants preference of the two
ENASE 2024 - 19th International Conference on Evaluation of Novel Approaches to Software Engineering
288

Figure 7: Distribution of participants rating in terms of the
learning difficulty of the new modeling tool.
given visual notation sets (icon-based visual notations
and shape-based visual notations), seven responded
that they prefer special icons because they are simi-
lar to icons that they already knew, thus they can un-
derstand and recognize them more easily. Those who
preferred shape-based visual notations indicated that
compared with icons, shapes and colors help them to
differentiate various entities with less effort.
As shown in Fig 7, 10/11 participants mentioned
that the new modeling tool was easy to learn. The
participant related the reason for the neutral response
to the performance of SiriusWeb. Since all partici-
pants were invited to the online session at the same
time, the excessive traffic volume led to a lag in the
response from the server, which decreased the learn-
ing experience of the participant during the user study.
The participant also indicated that it was a little diffi-
cult to learn how to use SiriusWeb as a novice, while
the modeling language and overall methodology were
good and easy to catch. All participants agreed that
using the new modeling tool did not require a high
level of IT knowledge and coding skills.
Overall, user feedback indicates that the new mod-
eling tool is very easy to learn and understand. Most
participants felt they can use the tool to easily com-
municate their ideas, techniques, and progress to
other stakeholders in a common language. However,
three participants still mentioned issues regarding the
poor responsiveness of the server and lack of cus-
tomization options. As the experimental proof-of-
concept tool was built on SiriusWeb, it helped us im-
plement the tool and provide it to the users, but it does
lack sufficient functionality and good performance.
5 THREATS TO VALIDITY
Internal Threats. The first threat to the validity
of our study is that there are currently no other suit-
able base modeling languages for modeling e-Health
software. We could not compare our approach with
any existing tools, therefore, we asked participants
to choose a modeling language of their own. How-
ever, most of the languages that they chose (such as
flowcharts) were too general to be compared with our
modeling language effectively. Although it is not
an effective comparative experiment, the results still
helped us better understand users’ choice and percep-
tion of graphics and symbols.
External Threats. One of the external threats to
validity is the small number of participants. Another
issue is the lack of diversity of the people involved in
our program. All of our participants so far have come
from the IT field. In the future we plan to conduct
user studies with health researchers to evaluate our
work more.
6 RELATED WORK
In this section, we summarize research regarding the
use of MDA for e-Health. The researchers applied
a novel approach called ActionGUI (de Dios et al.,
2014) for model-driven development of safety ap-
plications such as e-health. As e-health records are
highly sensitive, access to them must be controlled.
Extensions to SecureUML are used to specify secu-
rity policies for data models in this approach. Se-
cureUML extends role-based access control (RBAC)
with authorization constraints, which supports the
modeling of roles and other constraints. This pa-
per also proposes a complete meta-model for an e-
Health application containing 18 entities, such as pro-
fessionals, medical centers, doctors, etc. The Ac-
tionGUI code generator can then automatically gen-
erate a ready-to-deploy secure e-Health application.
In (Kotronis et al., 2018), researchers applied
SysML to explore the application of a model-driven
approach to the Internet of Things (IoT) e-Health sys-
tems and highlighted key requirements. Through e-
Health case studies, namely Remote Elderly Monitor-
ing Systems (REMS) and Smart Ambulance System
(SAS), the identification of criticality in healthcare
IoT systems is explored as a first step to effectively
manage them in system implementation and deploy-
ment. They then used SysML to model a range of
REMS structures. As a result, they found that reason-
able system-wide abstractions are helpful to systems
engineers as they can clarify the design and manage-
Human-Centered e-Health Development: An Accessible Visual Modeling Tool
289

ment of complex mixed-critical e-Health systems.
In summary, the existing works demonstrated the
feasibility and efficiency of MDA in real work scenar-
ios. MDA is able to lower the threshold for develop-
ers to understand project requirements by abstracting
various components of the system. However, none of
these works can model specific user’s preferences for
e-Health applications such as the website appearance
and the functionalities they prefer. Also, they have
not developed a solution for medical experts and de-
velopers to work collaboratively. Although existing
approaches have improved the efficiency of software
development, they do not cater for the participation
of experts in app development, making them unable
to give professional insights, which results in the final
deliverable not being able to satisfy the users.
7 CONCLUSION
We have presented a novel visual-based e-Health
modeling language. The goal of our DSML is to en-
able people from diverse fields to engage in e-Health
design projects better. It describes core concepts and
components of e-Health. Based on the findings from
the user requirements survey, we provided our users
with two accessible and distinguishable sets of visual
notations, depending on the Web Content Accessibil-
ity Guidelines 2.1 (Andrew et al., 2018), for designing
the visual diagram describing the custom e-Health ap-
plication. We evaluated the accessibility and usability
of our tool through a Physics of Notations assessment
and a group end user study. Evaluation results illus-
trate that all participants responded well in terms of
the usability of both language and overall approach.
ACKNOWLEDGMENT
Madugalla is supported by ARC Laureate Fellowship
FL190100035.
REFERENCES
Andrew, K., Joshue, C., Alastair, C., Michael, C., Cald-
well, B., Cooper, M., Reid, L. G., Vanderheiden, G.,
Chisholm, W., Slatin, J., and White, J. (2018). Web
content accessibility guidelines (wcag) 2.1. WWW
Consortium (W3C).
Brambilla, M., Cabot, J., and Wimmer, M. (2017). Model-
driven software engineering in practice. Synthesis lec-
tures on software engineering, 3(1):1–207.
Ceri, S., Fraternali, P., and Bongio, A. (2000). Web mod-
eling language (webml): a modeling language for de-
signing web sites. Computer Networks, 33(1-6):137–
157.
de Dios, M. A. G., Dania, C., Basin, D., and Clavel, M.
(2014). Model-driven development of a secure ehealth
application. Engineering Secure Future Internet Ser-
vices and Systems: Current Research, pages 97–118.
Famelis, M. and Chechik, M. (2019). Managing design-
time uncertainty. Software & Systems Modeling,
18:1249–1284.
Fischer, K., Krumeich, J., Panfilenko, D., Born, M., and
Desfray, P. (2014). Based modeling: A stakeholder-
centered approach for model-driven engineering. In
Advances and applications in model-driven engineer-
ing, pages 317–341. IGI Global.
Hause, M. et al. (2006). The sysml modelling language. In
Fifteenth European Systems Engineering Conference,
volume 9, pages 1–12.
Hesse, B. W. and Shneiderman, B. (2007). ehealth research
from the user’s perspective. American journal of pre-
ventive medicine, 32(5):S97–S103.
Khalajzadeh, H., Simmons, A. J., Abdelrazek, M., Grundy,
J., Hosking, J., and He, Q. (2020a). An end-to-
end model-based approach to support big data ana-
lytics development. Journal of Computer Languages,
58:100964.
Khalajzadeh, H., Verma, T., Simmons, A. J., Grundy, J.,
Abdelrazek, M., and Hosking, J. (2020b). User-
centred tooling for modelling of big data applica-
tions. In 23rd ACM/IEEE International Conference on
Model Driven Engineering Languages and Systems:
Companion Proceedings, pages 1–5.
Kotronis, C., Nikolaidou, M., Dimitrakopoulos, G., Anag-
nostopoulos, D., Amira, A., and Bensaali, F. (2018).
A model-based approach for managing criticality re-
quirements in e-health iot systems. In 2018 13th
annual conference on system of systems engineering
(SoSE), pages 60–67. IEEE.
Moody, D. (2009). The “physics” of notations: toward a sci-
entific basis for constructing visual notations in soft-
ware engineering. IEEE Transactions on software en-
gineering, 35(6):756–779.
Shen, J. (2023). Human-centred web-based modelling tool
data.
WHO (2019). WHO guideline: recommendations on digital
interventions for health system strengthening: execu-
tive summary. Technical report, World Health Orga-
nization.
Wong, B. (2011). Color blindness. nature methods,
8(6):441.
Zhuang, W., Gan, X., Wen, Y., and Zhang, S. (2022).
Easyfl: A low-code federated learning platform
for dummies. IEEE Internet of Things Journal,
9(15):13740–13754.
ENASE 2024 - 19th International Conference on Evaluation of Novel Approaches to Software Engineering
290
