
Derivation of Critical Infrastructure Accessibility Index Using
GIS-MCDA and Network Analysis: Case Study of Sarajevo
Ivan Marić
1
, Aida Avdić
2
and Boris Avdić
2
1
University of Zadar, Department of Geography, Center for Geospatial Technologies, Zadar, Croatia
2
University of Sarajevo, Faculty of Science, Department of Geography, Sarajevo, Bosnia and Herzegovina
Keywords: Critical Infrastructure, GIS, City OD Sarajevo, Accessibility Analysis.
Abstract: This study explores the accessibility of critical infrastructures (CRITIS) in urban planning, focusing on the City
of Sarajevo. CRITIS, essential for societal functioning, encompasses diverse services vital to social,
economic, political, health, educational, and administrative systems. The authors leverage geographic
information system (GIS) tools to construct an accessibility model for Sarajevo, analysing the spatial
availability of critical functions. Six groups of CRITIS indicators, composed of 29 CRITIS elements, were
used in the derivation of critical infrastructure accessibility index. The methodological framework was based
on implementation of network GIS analysis, interpolation method (IDW) and GIS multi-criteria analysis,
which could be applicable to similar research studies. Local communities concentrated in the strict urban core
(Ferhadija, Baščaršija) have the best accessibility of CRITIS, while peripheral local communities with a large
area, such as Mošćanica and Reljevo, have the lowest. Results suggest a zonal categorization of the urban area,
providing valuable insights for spatial planning and future urban development management. The study reveals
that the highest value of CRITIS accessibility doesn't necessarily align with the most densely populated areas
at local community level.
1 INTRODUCTION AND
BACKGROUND
Though lacking a singular and universally accepted
definition, critical infrastructures (CRITIS) (Luiijf et
al., 2009) can be elucidated through a fundamental
set of services that constitute the lifeblood of
seamless economic and societal functioning.
According to Murray (2012) it encompasses a diverse
array of means facilitating the operation of social,
economic, political, health, educational, and cultural
systems. Numerous studies and scholarly works delve
into the capacity of a state or society to enhance the
functionality of essential infrastructural systems,
often with the primary objective of formulating
measures to protect and fortify specific infrastructural
components crucial to national security (Croope and
McNeil, 2011). The formulation of strategies for this
purpose proved highly beneficial during crises such as
the COVID-19 pandemic
and
various
environmental
or
natural disasters, including floods
and earthquakes. Consequently, the past decade has
witnessed a proliferation of research on the
vulnerability and resilience of critical infrastructure,
exemplified by works from Huff et al. (2019),
Milanović et al. (2017), Svegrup et al. (2019) and Niu
et al. (2022). Although Bosnia and Herzegovina
lacks an advanced critical infrastructure protection
system, there has been a growing recognition in both
public and academic spheres of the necessity to
establish such a platform (Smajić and Bajramović,
2024). Given that urban areas remain focal points for
human settlement, critical infrastructure assumes
paramount importance within cities due to its
multifaceted nature and the substantial user base
reliant on its services. Urban planning, in this context,
places particular emphasis on investigations into the
accessibility of specific functions (Neuman, 2012,
Šiljeg et al., 2018), with accessibility being a
determinant of equal access and opportunity, where
transport infrastructure assumes a pivotal role. The
vulnerability of these systems emerges as a
significant planning challenge, as highlighted by
Tsenkova (2012), particularly in the cities of
Southeastern Europe, where susceptibility is
compounded by limited access to education and
healthcare. Such a situation result from the rapid
Mari
´
c, I., Avdi
´
c, A. and Avdi
´
c, B.
Derivation of Critical Infrastructure Accessibility Index Using GIS-MCDA and Network Analysis: Case Study of Sarajevo.
DOI: 10.5220/0012548100003696
Paper published under CC license (CC BY-NC-ND 4.0)
In Proceedings of the 10th International Conference on Geographical Information Systems Theory, Applications and Management (GISTAM 2024), pages 15-25
ISBN: 978-989-758-694-1; ISSN: 2184-500X
Proceedings Copyright © 2024 by SCITEPRESS – Science and Technology Publications, Lda.
15

urban development of the formal city and strong
centralization, relegating smaller settlements to the
periphery. Sarajevo, the capital of Bosnia and
Herzegovina and the most administrative, political,
cultural and financial centre of the country, is no
exception. The city has undergone substantial spatial
transformations in urban content and significant
alterations in urban morphology, owing to its turbulent
historical and social development, as well as the
impacts of economic and induced demographic
transitions (Pobrić, 2002; Gül and Dee, 2015; Čakarić
and Idrizbegović Zgonić, 2020). The dynamic nature
of these alterations underscores the necessity to
investigate the availability of infrastructural facilities
considered vital for urban functioning. Given the
absence of a universally applicable set of criteria for
ascertaining infrastructure criticality, such criteria are
tailored to the socio-economic characteristics of the
observed area. Cikotić et al. (2018) assert that energy
plants, information technology, finance, healthcare,
food services, water, transport, and government are
among the most prevalent critical infrastructure
components, subject to national, regional, and local
spatial scales vulnerability assessments. Contemplat-
ing the essential services requisite for seamless daily
operations and drawing insights from recent pandemic
conditions, the authors of this study have incorporated
elements from the transport, administrative, health,
educational, and communal sectors in their analysis of
the spatial availability of critical infrastructure.
Leveraging Geographic Information System
(GIS) tools for the spatial delineation of essential,
critical functions, the principal objective of this study
is to construct an accessibility model of critical
infrastructure (CRITIS) for the City of Sarajevo. The
aim is to comprehend the extent to which residents
and all service users can effortlessly access goods,
services, and activities. Ford et al. (2015) posited that
accessibility to services constitutes a crucial
component in developing a sustainable transport
system, functioning as a highly important
intermediary between services and the population.
Consequently, spatial accessibility encompasses both
service availability and travel impedance, with travel
distance and suitable transportation emerging as
common indicators of accessibility (Yin, 2010; Šiljeg
et al., 2018; So, 2016).
GIS provides an expansive array of tools for
analysing availability, vulnerability, resilience, and
control, particularly in CRITIS (Wolthusen, 2005;
Milanović et al., 2018). This underscores the
applicability of geographic solutions in addressing
contemporary urban challenges. The novelty of this
study lies in its innovative utilization of the GIS
multi-criteria model to construct a comprehensive
accessibility model of critical infrastructure in a case
study of a transitional city with atypical urban
development, thereby offering valuable insights for
informed decision-making in urban planning.
2 STUDY AREA
The territorial scope of this research is limited by the
administrative boundaries of Sarajevo (141 km²),
which has a population of 275,524 people, according
to the last 2013 census (BHAS, 2016). It comprises
four urban municipalities (from east to west): Stari
Grad, Centar, Novo Sarajevo and Novi Grad. The
historical centre of Sarajevo is located in the eastern
part of the urban area, in the municipality of Stari
Grad (Old City), while newer neighbourhoods line up
to the west. The terrain morphology primarily
determines the urban development and sprawl of
Sarajevo, so the majority of the city population is
concentrated in the Miljacka River valley and on the
nearby hills. On the other hand, the surrounding
mountains, such as Trebević and Ozren, are virtually
uninhabited.
Sarajevo is a typical example of a transitional city.
It experienced most of its spatial and population
growth in the socialist period, during the second half
of the 20th century. The event of the 1984 Winter
Olympics was a particularly significant stimulation
for urban growth and infrastructure modernisation.
However, the process of further development of
critical infrastructure was interrupted by the 1992-95
war and post-war economic underdevelopment.
Hereby, this study is the first attempt at
methodologically based research on disparities of
urban development of critical infrastructure in the
capital city of Bosnia and Herzegovina.
Figure 1: Geographical location of City of Sarajevo and its
administrative division.
GISTAM 2024 - 10th International Conference on Geographical Information Systems Theory, Applications and Management
16
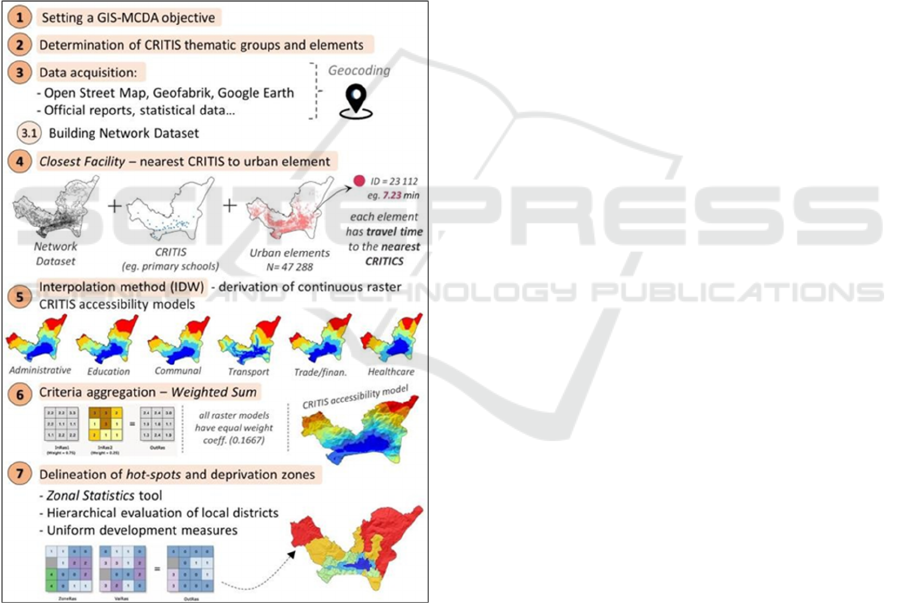
3 MATERIALS AND METHODS
The methodology is based on an integrated
application of network GIS analysis (closest facility),
interpolation method of time cost attribute and GIS
multi-criteria analyses (GIS-MCDA).
The methodological framework can be divided
into seven steps (Fig. 2): (1) determine the main GIS-
MCDA objective (2) selection of appropriate groups
and elements of CRITIS; (3) acquisition of GIS and
non GIS data; (4) application of closest facility tool
within Network analyst; (5) interpolation of travel
time cost attribute using inverse distance weighted
(IDW) method; (6) aggregation of the accessibility
raster models using weighted sum tool; and (7)
delineation of hot-spots and deprivation zones of
CRITIS using Zonal statistics tool.
Figure 2: Methodology workflow.
3.1 Selection of CRITIS
CRITIS encompasses components of the urban system
that constitute essential foundations for the operational
integrity and safety of urban environments, particularly
during periods of imminent peril (Yang et al. 2023).
These infrastructural systems assume a pivotal role in
facilitating the fulfilment of imperative social,
economic, organisational, and other functions crucial
for the routine activities of the urban populace
(Petrović et al, 2018). The absence of a uniform
system for selecting indicators for critical
infrastructure allows the authors arbitrariness to the
extent that follows the logic and nature of urban
functions and the socio-economic status of the city.
In selecting infrastructure systems as critical, the
authors primarily decided on educational and health
infrastructure due to their fundamental roles in
ensuring societies' well-being, resilience, and
functionality. Educational institutions are primary
contributors to human development in a sphere of
workforce preparation, innovation and social
development (Grigore, 2021), while health
infrastructure, including hospitals, clinics and public
health systems, provides medical services and plays a
critical role in safeguarding public health (Sänger, et
al-, 2021, Scholz et al-, 2022). In many works, the
transport network is undeniably treated as a vital part
of critical infrastructure (Theoharidou, 2012;
Borghetti and Marchionni, 2023), enabling basic
services for the movement of people, goods and
information, and in the context of the availability of
all other functions, it plays an intermediary role.
Administrative functions involve critical decision-
making processes at various levels of government.
These decisions impact the overall well-being of a
nation, its citizens, and its infrastructure, which is
reason why many authors (Żaboklicka, 2020) find it
critical. Due to their essential role in providing
services such as water supply, gas and
telecommunication, utilities are considered as
CRITIS (URL 1, URL 2).
Although it certainly belongs to the critical
domain, the connection of households to electricity,
water, sewerage and similar networks was not taken
into consideration within this research, since it is
considered that almost all the city's population has
access to this type of infrastructure. Instead, the work
is focused on the discovery of spatial disparities in the
accessibility of those functions, which are
characterised by a certain degree of physical distance,
but are also necessary for the daily life of people, as
well as the sustainability of the social system. In the
context of the accessibility of communal services,
treated facilities where fees for the aforementioned
services are regulated, and which are considered
inevitable for their users. Finally, banks, malls,
supermarkets and hypermarkets as key chains for the
supply of commercial and banking services are
classified in the group of trade/financial indicators of
CRITIS. Table 1. shows all CRITIS groups and
elements for which accessibility analysis is done.
Derivation of Critical Infrastructure Accessibility Index Using GIS-MCDA and Network Analysis: Case Study of Sarajevo
17

Table 1: CRITIS thematic groups and elements.
Group CRITIS Source
Educational
Primary school
URL3, Google Earth
(GE)
Secondary school URL3, GE
Kindergartens Geofabrik, GE
Administrative
Offices for social help and
employmen
t
URL 4, GE
Ministries URL 5
Police stations GE
Courts GE
Local communities GE
Administrative authority GE
Healthcare
Hospital 1rank URL3, GE
Hospital 2rank URL3, GE
Hospital 3rank
+ health homes
URL 3, GE
Pharmacy Geofabrik, GE
District outpatient clinics URL 3, GE
Trade /
Finance
Large stores Geofabrik
Marketplace GE
Banks Geofabrik
Traffic
Bus terminal Ministry of Transport
Minibus stations Ministry of Transport
Tram stations Ministry of Transport
Trolleybus stations Ministry of Transport
Railway stations Ministry of Transport
Main roads Geofabrik
Post office Google Earth
Communal
Communal cash register URL4, GE
Firefighters URL4, GE
Electro distribution URL4, GE
Heating plants URL4, GE
Community and building
managers
URL4, GE
3.2 Data Acquisition
GIS and "non" spatial data were acquired to create the
CRITIS accessibility index for the city of Sarajevo.
GIS data was mostly acquired from OSM sources,
Geofabrik, and official state sources (layer of local
communities, and four urban municipalities). "Non-
GIS data (addresses of schools, hospitals, banks, etc.)
were geocoded using My Maps and Google Earth and
then with KML to layer tool converted into GIS data.
After harmonisation, all data were organised into a
unique GIS database in the projection coordinate
system WGS 1984 UTM Zone 33N. To improve the
interpolation model with the extrapolation method
(Marić and Šiljeg, 2017), the data were also acquired
for neighbouring zones outside the city boundaries.
Namely, a buffer zone of 400 m was created around
that polygon, which consists of four urban
municipalities (Stari Grad, Centar, Novo Sarajevo,
and Novi Grad). Within that expanded polygon, a
raster accessibility model of the CRITIS was created.
After aggregating all models, clipping of the extended
model was performed according to the borders of the
administrative territory of the city of Sarajevo.
Network analyses were made based on the
network dataset, which was created from the road
layer downloaded from Geofabrik. Before the
derivation of the network dataset, a topological check
was made using the Planarize lines tool. Then, for
each element, the attribute of the road that needs to be
covered (length) and the speed of movement, which
in this case is 5 km/h, or the average walking speed
of a person, is calculated. From the calculated length
and movement speed, the attribute of time (min) that
needs to be spent to overcome a certain element of the
path is calculated.
3.3 Closest Facility Analysis
Based on the derived network dataset, geocoded
locations of CRITIS, and the layer of residential
buildings that represent the location of the population
in the city of Sarajevo, the Closest facility analysis
was performed using the Network Analyst extension
within ArcMap 10.8.1. The closest facility solver
measures the cost of travelling between incidents and
facilities and determines which are closest to each
other. When finding the closest facilities, you can
specify how many to find and whether the direction
of travel is towards or away from them. It displays the
best routes between incidents and facilities, reports
their travel costs, and returns driving directions.
Residential buildings representing the locations
of residents were acquired from Geofarbrik (layer: gis
osm buildings a free 1) and then converted into
points. In the analysis, "facilities'' represented a
specific element of the CRITIS infrastructure (e.g.,
primary schools), while "incidents'' was a layer of
residential buildings (n=47,288). The cost attribute
was time of travel in min. For each residential
building, a time of travel attribute was calculated, i.e.
how many minutes should be spent walking to reach
the specific CRITIS element.
GISTAM 2024 - 10th International Conference on Geographical Information Systems Theory, Applications and Management
18

3.4 Interpolation Method
To perform raster continuous models of CRITIS
accessibility, it was necessary to implement a specific
interpolation method (IM). The input data were
elements of residential buildings (n= 47 288). For
each of them the cost attribute of travel time was
calculated. The IDW (Inverse Distance Weighted)
interpolation method was used, which explicitly
assumes that things that are close to one another are
more alike than those that are farther away. The
measured values closest to the prediction location
have more influence on the predicted value than those
farther away. It gives greater weights to points closest
to the prediction location, and the weights decrease as
a function of distance. When implementing
interpolation methods, the same user- defined
parameters (search distance, power setting, etc.) were
set for each element of a specific CRITIS group. For
all raster models, a spatial resolution value of 10 m
was set. After generating the continuous raster
models of CRITIS accessibility, it is possible to create
isochrones, i.e. lines connecting points (places) that
can be reached from a specific place in the same
average time.
3.5 Interpolation Method
In total, 26 accessibility CRITIS models were
derived. They were clustered into six groups. In the
first step, models were aggregated within each
thematic group (education, health, administration,
etc.) using the Weighted sum tool. Each model had an
equal weight coefficient. This resulted in six thematic
accessibility CRITIS models. This was followed by a
new aggregation where each thematic CRITIS model
had a weight coefficient of 0.16667. The final
CRITIS accessibility model was converted into a
range of values from 0 to 1, where a lower value
represents better accessibility, i.e. shorter travel time
to CRITIS. This was done using the tool Fuzzy
membership and linear function.
3.6 Delineation of Accessibility Zones
Delineation of CRITIS accessibility zones was done
following two approaches: (1) boundaries of local
districts and; (2) elements of residential buildings. In
the first approach, the final CRITIS model overlapped
with the polygonal layer of the local district (n=76)
within Sarajevo. For each district using the Zonal
statistics tool, the mean values of the pixels located
within the boundaries of that district were calculated.
This made a certain generalisation of the availability
CRITIS model according to the boundaries of the
local districts. The availability zones thus follow the
boundaries of local districts. They were classified into
five classes (extremely accessible, accessible, neither
accessible nor inaccessible, inaccessible, moderately
inaccessible) using the Jenks (natural breaks)
classification method (Fig. 2). In the second
approach, the final CRITIS model overlapped with
the residential buildings layer (points). Then, using
the Extract value to point tool, the CRITIS
accessibility attribute was derived for each object
(point). Then the objects were classified into five
classes using the Jenks classification method, similar
to the first approach. Descriptive statistics then were
derived for both approaches.
4 RESULTS AND DISCUSSION
4.1 CRITIS Models
Examining the spatial dynamics of Sarajevo reveals
disparities between the urban core and the semi-urban
periphery, particularly evident when scrutinizing the
accessibility of critical infrastructure. This analysis
delves into key sectors such as educational facilities,
public transport, commercial services, administrative
hubs, healthcare, and communal infrastructure. The
examination unveils distinct patterns that underscore
the challenges faced by residents of the outskirt parts
of the city compared to those in city center. The study
results are predominantly conveyed through
cartographic representations, encompassing 29 basic
thematic maps. Additionally, these are synthesized
into six aggregated maps based on distinct indicator
groups. Spatial inequalities between the urban core
and the semi-urban periphery of Sarajevo are very
evident when it comes to the analysis of the
availability of educational infrastructure (Figure 3).
The distribution of secondary schools particularly
contributes to this, since their deficit has been
established even in densely populated areas of the
municipality of Novi Grad, while there are none of
them in the outer parts of the city. The availability of
primary schools is somewhat more even, which is
especially visible in the northwestern city periphery.
Neighborhoods in this part of Sarajevo are once again
neglected regarding availability of kindergartens. A
very similar spatial pattern is observed when
analyzing the public transport infrastructure (Figure
3). In this regard, the flat part of the city is particularly
privileged, where all the tram, trolleybus and railway
stations are located, while the hilly neighbourhoods
primarily rely on bus and minibus lines.
Derivation of Critical Infrastructure Accessibility Index Using GIS-MCDA and Network Analysis: Case Study of Sarajevo
19
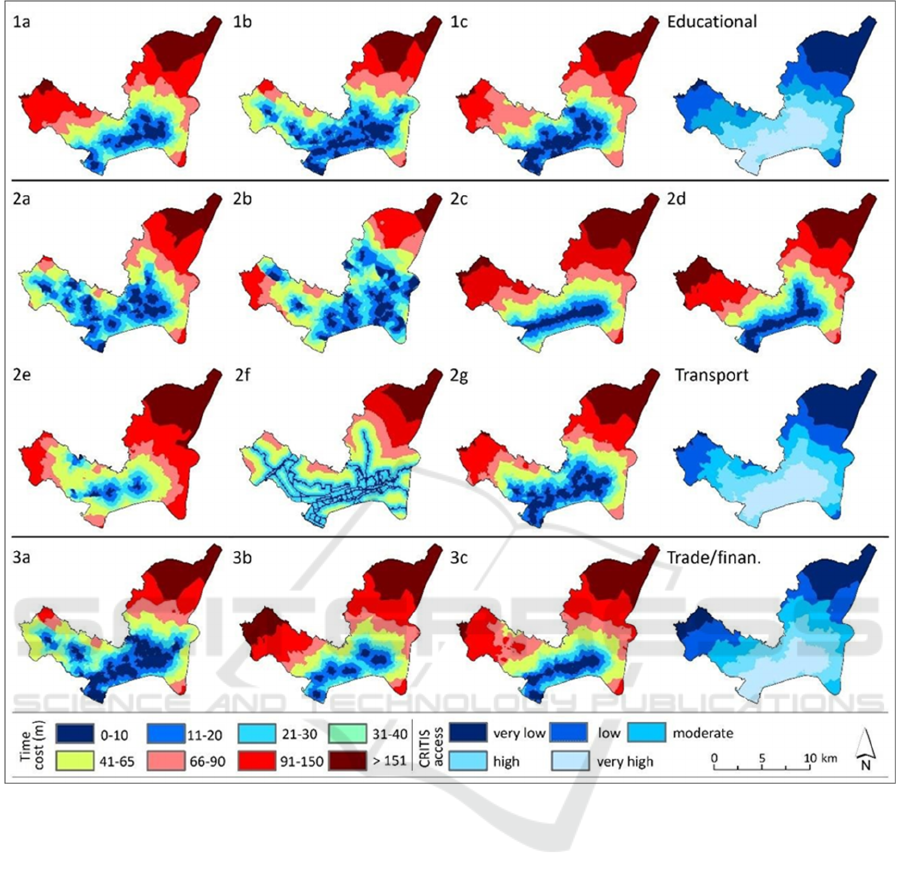
Figure 3: Accessibility model of 1a) secondary schools; 1b) primary schools; c) kindergartens and final educational acessibiliy
model; accessibility model of 2a) bus terminal; 2b) minibus station; 2c) tram stations; 2d) trolleybus stations; 2e) railway
stations; 2f) main roads; 2g) post office and final transport accessibility model; accessibility model of 3a) large stores; 3b)
marketplaces; 3c) banks and final trade/financial acessibility model.
The stretch of most of the main roads is also
determined by the morphological characteristics of
the terrain, and is highly correlated with the density
of other urban contents. Post offices are relatively
evenly distributed in highly urbanized parts of all four
city municipalities, but there are practically none on
the city's outskirts.
Access to basic commercial and financial services
also differs significantly in the peripheral compared
to the central parts of the city (Figure 3-3). While
supermarkets are somewhat more widely dispersed
across the city, banks are primarily concentrated
along the main axis of Sarajevo's urban development,
in the east-west direction.
Market locations are relatively few, which is why
the model of their availability shows spatial
fragmentation.
The administrative infrastructure (Figure 4) is
primarily located in the central part of the city, and
secondarily in highly urbanized parts of other city
municipalities (Stari Grad, Novo Sarajevo and Novi
Grad). The semi-urban periphery is particularly
marginalized in this regard. A significant exception is
the administrative functions at the level of local
communities, which were primarily formed so that
the inhabitants of individual urban neighbourhoods
could more easily articulate their infrastructure needs.
GISTAM 2024 - 10th International Conference on Geographical Information Systems Theory, Applications and Management
20
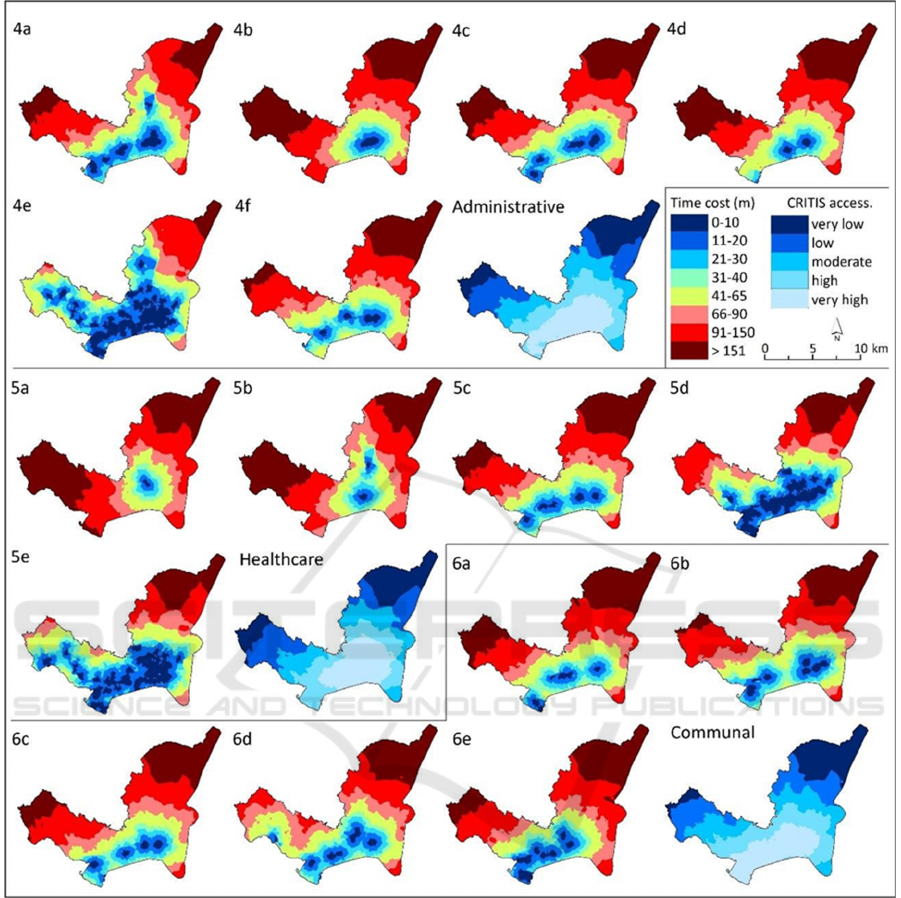
Figure 4: Accessibility model of 4a) social help and employment; 4b) ministries; 4c) police stations; 4d) courts; 4e) local
communities; 4f) administrative authority; and final administrative accessibility model and 5a) hospital 1_rank; 5b) hospital
2_rank; 5c) hospital 3_rank; 5d) pharamcy; 5e) district outpatient clinics; and final healthcare accessibility model and 6a)
communal cash register; 6b) firefighters; 6c) electro distribution; 6d) heating plans; 6e) community and building managers
and final communal accessibility model.
Healthcare, as an extremely important element of
critical infrastructure, is organized on four levels –
clinical center, other hospitals, health centers and
local clinics (Figure 4). Since the facilities of the two
highest levels of this organizational structure are
located exclusively on the territory of the
municipality of Centar, even the urbanized parts of
Novi Grad in the west are characterized by an
unsatisfactory degree of availability of these services
due to physical distance. The city's population is
served by five health centers, and the large spatial
imbalance is partially mitigated by the distribution of
a larger number of local clinics. The analysis also
took into account the availability of pharmacies,
which emphasized the very unfavourable position of
the northwestern outskirts of Sarajevo. Modeling of
communal infrastructure availability confirmed
similar spatial patterns as in the case of other elements
Derivation of Critical Infrastructure Accessibility Index Using GIS-MCDA and Network Analysis: Case Study of Sarajevo
21

of critical infrastructure (Figure 4). The only thing
more pronounced is the slightly better infrastructure
coverage of Dobrinja, as the city's largest district,
which is located on the far southwestern outskirts of
the city of Sarajevo.
4.2 Final CRITIS Accessibility Model
Figure 5 shows the final model of the CRITIS
accessibility and the derived zones of accessibility
following the two mentioned approaches. Descriptive
statistics are provided in Table 2 and 3, where it is
stated how many residents and residential buildings
can be found in the derived zones, depending on the
used approach.
The five local districts with the best accessibility
of CRITIS infrastructure are (1) Ferhadija; (2)
Baščaršija; (3) Center Trg Oslobođenja; (4)
Mjedenica and (5) Džidžikovac Koševo I. These five
local districts have a total of 9369 inhabitants with a
total area of 1,037 km², which gives 9,035 population
per km². These are the local communities of the
central business district where the main city functions
are concentrated. It is also the main traffic and
historical center of Sarajevo.
The five local districts with the lowest
accessibility of CRITIS infrastructure are (1) Naselje
Heroja Sokolje; (2) Pionirska Dolina Nahorevo; (3)
Reljevo; (4) Dobroševići and (5) Moščanica. These
five local districts have a total of 20428 inhabitants
with a total area of 80.02 km², which gives 255
population per km². These are peripheral hillside local
communities, with a relatively low population density
and a significant distance from the urban center. Low
CRITIS accessibility (CA) represents a significant
and long-recognized problem by the local population
with a negative effect on their quality of life (URL 6,
7, 8).
Table 2: Results of CRITIS accessibility (CA) for first
approach (local districs).
CA
Population Area (km²) Local district
Total % Total % Count %
1 84359 30.6 7.85 5.7 26 34.2
2 123032 44.7 16.70 12.0 35 46.1
3 21382 7.8 8.40 6.1 5 6.6
4 33974 12.3 35.17 25.4 6 7.9
5 12778 4.6 70.53 50.9 4 5.3
Total 275525
138.66
76
1 - very high, 2 - high; 3 - medium; 4 - low; 5 - very low
Table 3: Results of CRITIS accessibility for the second
approach (residential buildings).
CA
Residential buildings
Total %
1 15008 31.76
2 17429 36.88
3 7094 15.01
4 4052 8.57
5 3675 7.78
On the basis of the derived multicriteria index, it
was established that about 30% of the urban
population of Sarajevo falls into the most favourable
category of infrastructural availability. These are
residents of the city core in the municipalities of
Centar and Stari Grad, then the highly urbanized
neighbourhoods of Novo Sarajevo, and a smaller part
of Novi Grad. On the other hand, some 17% of the
population of Sarajevo has low or very low
availability of critical infrastructure. The largest
number of inhabitants from these categories inhabit
the northwestern periphery of the city territory (part
of the municipality of Novi Grad), that is, primarily
the local communities of Dobroševići, Naselje Heroja
Sokolje and Reljevo. The situation is similar in the
hilly northeastern parts of Sarajevo (e.g. the village of
Nahorevo), but the population concentration in these
areas is still significantly lower.
The findings for the City of Sarajevo unveil
interesting patterns, revealing that the highest
concentration of service supply does not necessarily
coincide with the most densely populated areas. It is
known that the largest population concentration
pertains to the southwest part of the urban area (the
southern part of the municipalities of Novo Sarajevo
and Novi Grad). However, the accessibility of critical
infrastructure in this part of the city only partially
fulfils the needs of its residents. This issue needs to
be further explored through future research, which
would treat population density as a key variable.
Simultaneously, there is a need to differentiate
weights for different types of infrastructure. In this
study, equal weights were utilized for methodological
transparency, eliminating subjective assessments of
the significance of individual infrastructure elements.
However, it is evident that there is a need for an
objective and methodologically grounded
differentiation in this field. Additionally, parallel
research of this type is necessary in other cities to
optimize the spatial CRITIS model through different
case studies, aiming for its universal validity.
GISTAM 2024 - 10th International Conference on Geographical Information Systems Theory, Applications and Management
22
Figure 5: (A) CRITIS accessibility index for local district; (B) CRITIS accessibility for residential buildings.
5 CONCLUSION
The CRITIS accessibility model applied in this case
study resulted in the creation of a composite index,
whereby equal weights were assigned to
administrative, communal, healthcare, transport,
trade/financial and educational infrastructure. In this
way, a specially designed methodological approach
for examining infrastructural disparities within the
urban zone of Sarajevo was tested, which can be used
in other examples of cities of similar size, status,
historical background and/or urban patterns. The
obtained results are promising, since they clearly
indicate the zonal categorization of the studied urban
area, which can be widely used in spatial planning,
that is, in the future management of urban
development. Recommendations for further
improvement of this model primarily include research
on the correlation of CRITIS availability with
population concentration, introduction of
Derivation of Critical Infrastructure Accessibility Index Using GIS-MCDA and Network Analysis: Case Study of Sarajevo
23

differentiated weights, more detailed analysis of
individual elements of critical infrastructure,
potential inclusion of additional and review of
existing criteria, comparative field research, as well
as comparative analyzes with other cities. While
Bosnia and Herzegovina is still in the initial phases of
developing its critical infrastructure protection
system, this model serves as a solid foundation for
further expansion and implementation across other
cities in the country.
ACKNOWLEDGEMENTS
This research was supported by the Center for
Geospatial Technologies (University of Zadar,
Croatia).
REFERENCES
Borghetti, F., Marchionni, G. (2023). Cross-border critical
transportation infrastructure: a multi-level index for
resilience assessment, Transportation Research
Procedia,69, 77-84, https://doi.org/10.1016/j.trpro.
2023.02.147.
Čakarić, J. & Idrizbegovic Zgonic, A. (2020). Nameless
Settlements of Sarajevo. IOP Conference Series
Materials Science and Engineering. 960.
https://doi.org/10.1088/1757-899X/960/3/032020.
Cikotić, S., Smajić, M., Delić, H., Subašić, N, 2018:
Nacionalna sigurnost i privatna zaštita, Fakultet
političkih nauka, Univerzitet u Sarajevu, Sarajevo,
Bosna i Hercegovina.
Croope, S. Mcneil, S. (2011). Improving Resilience of
Critical Infrastructure Systems Postdisaster.
Transportation Research Record: Journal of the
Transportation Research Board. 2234. 3-13.
10.3141/2234-01. https://doi.org/ 10.3141/2234-01.
Ford, AC., Barr, SL., Dawson, RJ. James, P. (2015).
Transport accessibility analysis using GIS: Assessing
sustainable transport in london. ISPRS International
Journal of Geo-Information. 4(1):124-149. https://doi.
org/10.3390/ijgi4010124.
Grigore, L. M. (2021): Education as a critical
infrastructure. Strategies XXI – Command and Stuff
College. 17. 404-407; https://doi.org/10.53477/2668-
2028-21-53.
Gül, M., Dee, J. (2014). Sarajevo – A city profile, Cities, 43
(152-166). https://doi.org/10.1016/j.cities.2014.11.018.
Huff, J., Medal, H., Griendling, K. (2019). A model‐
based systems engineering approach to critical
infrastructure vulnerability assessment and decision
analysis. Systems Engineering, 22(2), 114-133.
https://doi.org/10.1002/sys.21460
Luiijf, E., Nieuwenhuijs, A., Klaver, M., van Eeten, M., &
Cruz, E. (2009). Critical information infrastructure
security, 8th International Workshop, CRITIS 2013,
Amsterdam, The Netherlands, September 16-18, 2013.
Marić, I., Šiljeg, A. (2017). Application of Huff model in
analysing market competition–example of shopping
centres in the settlement of Zadar. Geoadria, 22(1), 41-
64
Milanović, J. Zhu, Wentao. (2017). Modeling of
Interconnected Critical Infrastructure Systems Using
Complex Network Theory. IEEE Transactions on
Smart Grid. PP. 1-1. https://doi.org/10.1109/TSG.
2017.2665646.
Ministry of Transport of Sarajevo Canton, 2014: Network
of public passenger transport lines in Sarajevo Canton
(https://ms.ks.gov.ba/sites/ms.ks.gov.ba/files/010420
14%20Muamer%20Kukan_mreza%20linija.pdf,
accessed in November 28, 2023)
Murray, T. G (2012). Critical infrastructure protection; The
vulnerability conudrun, Telematics and Informatics,
29., https://doi.org/10.1016/j.tele.2011.05.001
Neuman, M. (2012). Infrastructure planning for sustainable
citie. Geographica Helvetica. 66. 100-107.
https://doi.org/ 10.5194/gh-66-100-2011.
Niu, D.; Wang, L.; Li, W.; Ma, Y. (2022). An International
Comparative Study on the Resilience of Urban
Communities after COVID-19 Pandemic: A One- Year
Case Study between Lanzhou, China and Sarajevo,
Bosnia and Herzegovina. Int. J. Environ. Res. Public
Health 2022, 19, 14458. https://doi.org/10.3390/
ijerph192114458.
Petrović, N., Stranjik, A., Peternel, R. (2018): Generic
Resilience Indicators of Critical Infrastructures.
Annales of Disaster Risk Sciences. ADRS, 1 (1.), 97-103.
Pobrić, A. (2002). Osnovne značajke i posljedice
migracijskih kretanja u Bosni i Hercegovini.
Migracijske i etničke teme, 18 (4), 349-364.
Sänger, N., Heinzel, C. Sandholz, S. (2021). "Advancing
Resilience of Critical Health Infrastructures to
Cascading Impacts of Water Supply Outages— Insights
from a Systematic Literature Review" Infrastructures 6
(12). https://doi.org/10.3390/infrastructures6120177
Scholz, C., Schauer, S., Latzenhofer, M., 2022: The
emergence of new critical infrastructures. Is the
COVID-19 pandemic shifting our perspective on what
critical infrastructures are? Int J Disaster Risk, 83,
103419. https://doi.org/10.1016/j.ijdrr.2022.103419.
Smajić, M., Bajramović, Z. (2024): Risks and Vulnerability
of Critical Infrastructure in Bosnia and Herzegovina-
Assessment and Protection, Contemporary
Macedonian Defense, 23(45): 9-18.
Šiljeg, S., Marić, I., Nikolic, G. Šiljeg, A. (2018).
Accessibility analysis of Urban Green Spaces in the
settlement of Zadar (Croatia). Šumarski List. 142. 487-
496. https://doi.org/10.31298/sl.142.9-10.4.
So, S. W. (2016). Urban Green Space Accessibility and
Environmental Justice: A GIS-Based Analysis in the
City of Phoenix, Arizona, Doctoral dissertation,
University of Southern California, Los Angeles.
Svegrup L., Johansson J., Hassel H. (2019). Integration of
Critical Infrastructure and Societal Consequence
Models: Impact on Swedish Power System Mitigation
GISTAM 2024 - 10th International Conference on Geographical Information Systems Theory, Applications and Management
24

Decisions. Risk Anal. 39(9):1970-1996. https://doi.org/
10.1111/risa.13272.
Theoharidou, M., Kandias, M., Gritzalis, D. (2012).
Securing Transportation-Critical Infrastructures:
Trends and Perspectives. In: Georgiadis, C.K.,
Jahankhani, H., Pimenidis, E., Bashroush, R., Al-
Nemrat, A. (eds) Global Security, Safety and
Sustainability & e-Democracy. e-Democracy ICGS3
2011 2011. Lecture Notes of the Institute for Computer
Sciences, Social Informatics and Telecommunications
Engineering, 99. https://doi.org/10.1007/978-3-642-
33448-1_24
Tsenkova, S. (2012). Urban planning and informal cities in
southeast Europe. Journal of Architectural and
Planning Research. 29. 292-305.
URL 1 - https://aspr.hhs.gov/cip/Pages/default.aspx
(accessed in November 28, 2023)
URL 2 - https://www.coresecurity.com/industries/energy-
and-utilities (accessed in November 28, 20
URL 3 - https://ustanove.transparentno.ba/bs-Latn-BA
(accessed in December 10, 2023)
URL 4 - https://mrsri.ks.gov.ba/javne-ustanove/lista
(accessed in December 10, 2023)
URL 5 - https://vlada.ks.gov.ba/ministarstva (accessed in
December 10, 2023)
URL 6 - https://avaz.ba/kantoni/sarajevo/360505/dok-se-
politicari-brinu-o-nazivu-skole-daci-pjesace-po-9-kilo
metara (accessed in December 10, 2023)
URL 7 - https://avaz.ba/kantoni/sarajevo/664191/ocajni-
mjestani-naselja-reljevo-apeliraju-na-nadlezne-vise-od
-godinu-nemamo-vode?amp=1 (accessed in December
10, 2023)
URL 8 - https://www.fokus.ba/vijesti/bih/djaci-iz-sarajev
skog-naselja-pjesace-do-skole-i-po-cetiri-kilom etra-u-
jednom-pravcu/2757803/ (accessed in December 10,
2023)
Wolthusen, S. D. (2005). GIS-based command and control
infrastructure for critical infrastructure protection. First
IEEE International Workshop on Critical
Infrastructure Protection (IWCIP'05), Darmstadt,
Germany, 2005, pp. 8 pp., doi: https://doi.org/
10.1109/IWCIP.2005.12.
Yang, Z.; Barroca, B., Laffréchine, L., Weppe, A., Bony-
Dandrieux, A. & Daclin, N., 2023: A multi-criteria
framework for critical infrastructure systems resilience,
International Journal of Critical Infrastructure
Protection, 42, 100616, https://doi.org/10.1016/j.
ijcip.2023.100616.
Yin P. (2010). Urban–rural inequalities in spatial
accessibility to prenatal care: A GIS analysis of
Georgia, USA, 2000–2010. GeoJournal. 84(3):671-
683. https://doi.org/10.1007/s10708-018-9884-1.
Żaboklicka, E. (2020). Critical infrastructure in the shaping
of national security. Security and Defence Quarterly,
28(1), 70-81. https://doi.org/10.35467/sdq/118585
Derivation of Critical Infrastructure Accessibility Index Using GIS-MCDA and Network Analysis: Case Study of Sarajevo
25
