
Quantitative Analysis of the Relationship Between
Master Data Quality and Process Quality
Simon Nikolaj Vetter
1a
, Annika Zettl
1b
, Markus Michael Mützel
2c
and Omid Tafreschi
3d
1
Evonik Operations GmbH, Darmstadt, Germany
2
Evonik Industries AG, Hanau, Germany
3
Darmstadt University of Applied Sciences, Darmstadt, Germany
Keywords: Master Data Quality, Process Quality, Process Mining, Validation Rules.
Abstract: The interplay between master data quality and process quality is well-recognized across industries, yet
quantifying this relationship is complex. This paper introduces a methodology for analyzing this relationship
within a business context, thereby utilizing quantitative data to enhance decision-making processes. We
developed a practical approach to establish metrics for measuring master data and process quality, serving as
a guideline for other businesses. Central to our methodology is the application of linear regression analysis to
understand the dynamics and interplay between these two factors. To validate our approach, we implemented
it in a major European-based chemical enterprise with global operations, demonstrating its effectiveness and
applicability in a real-world setting.
1 INTRODUCTION
The performance of business processes and the ability
to align them with the needs of internal and external
customers in a timely, cost-effective and error-free
manner determines the competitiveness of companies
(Fleischmann et al., 2018; Koch, 2015). In this
context, data has a major influence on processes and
their performance (Dumas et al., 2018).
Master data represent the core data of business
objects such as products, suppliers, or customers and
are used multiple times in processes. Although the
relationship between master data quality and process
quality is well known, previous studies largely refer
to the results of qualitative methods (Schäffer and
Leyh, 2017; Otto and Österle, 2016). Quantifying the
correlation is considered complex (Otto et al., 2011,
p. 9; Scheibmayer and Knapp, 2014, p. 30).
The aim of this paper is to quantify the
relationship between master data quality and its
impact on process quality. For this purpose, we
examined the following question:
a
https://orcid.org/0009-0005-8245-7315
b
https://orcid.org/0009-0008-3720-1304
c
https://orcid.org/0009-0005-6143-1909
d
https://orcid.org/0000-0002-2284-4349
How much does the quality of master data
influence the quality of a process?
To quantify this relationship the following sub-
questions will be answered: How to quantify the
process quality in business practice? How to quantify
the quality of master data in business practice? To
answer the questions, two key performance indicators
(KPIs) for calculating process quality and master data
quality are presented. In the next step, the correlation
is calculated using linear regression and tested for
statistical significance. The approach and KPIs were
applied to a chemical company that sells products
worldwide in a defined, semi-automated process.
This paper is organized as follows: Section 1
provides an introduction to the research topic. After
this introduction, we discuss related work in section
2. Section 3 introduces the theoretical background of
our study, explaining key concepts related to process
quality and master data quality. Section 4 outlines the
methods employed in this study and the
methodological approach from a process perspective.
Section 5 presents the results of the analysis regarding
process quality, master data quality and their potential
50
Vetter, S., Zettl, A., Mützel, M. and Tafreschi, O.
Quantitative Analysis of the Relationship Between Master Data Quality and Process Quality.
DOI: 10.5220/0012548200003690
In Proceedings of the 26th International Conference on Enterprise Information Systems (ICEIS 2024) - Volume 1, pages 50-60
ISBN: 978-989-758-692-7; ISSN: 2184-4992
Copyright © 2024 by Paper published under CC license (CC BY-NC-ND 4.0)

correlation, as identified through the statistical
analysis. The discussion about interpretation and
limitations are shown in section 6. Section 7 contains
the conclusion and outlook.
2 RELATED WORK
The relationship between master data quality and
process quality is well-recognized in both literature
and various studies. Despite widespread
acknowledgement, quantifying the effects of master
data quality on process quality remains a challenge,
as highlighted by Scheibmayer and Knapp (2014). In
addition, Otto , Kokemüller, Weisbecker and Gizanis
(2011) describe the task of understanding and
analyzing the impact of master data quality on
process quality as complex. Furthermore, a review of
existing research suggests a tendency towards
qualitative methodologies, indicating a potential area
of further exploration through quantitative analysis.
Knut (2018) points out that the quality of master
data affects all business processes, and poor master
data quality can lead to process failures. Otto and
Hüner (2009) confirm this and consider good master
data quality as an essential prerequisite for the
performance of companies. Ofner, Straub, Otto and
Österle (2013) emphasize the fundamental
importance of master data quality for business
processes, while Götze, Leidich, Kochan and Köhler
(2014) as well as Schäffer and Leyh (2017) note that
it forms the basis for effective and efficient execution
of business processes. Batini and Scannapieca (2006)
and Schemm (2009) highlight that data quality is a
decisive factor for the performance of business
processes. Apel, Behme, Eberlein and Merighi (2015)
also underline that business processes rely on high
data quality. Fürber and Sobota (2011) add to this
perspective and see high-quality master data as a key
to error-free process execution.
While the above sources collectively underscore
the theoretical importance of master data quality and
the impact on process quality, they primarily offer
conceptual insights. This observation highlights the
need for additional empirical research to support
these theoretical views, a task that is further explored
in the following studies.
Empirical evidence from studies by Schäffer and
Leyh (2017) as well as Scheibmayer and Knapp
(2014) confirm these theoretical insights. Schäffer
and Leyh (2017) use surveys with experts showing
that 82% considered master data quality critical for
business processes. Scheibmayer and Knapp (2014)
also utilize surveys and the results highlight that poor
master data quality leads to inefficiencies in process
execution. Even though those studies provide
valuable insights, they do not offer statistical analysis
or practical applications that can be directly translated
into quantifiable impacts on process quality.
Case studies from established companies such as
Bayer Crop Science and Beiersdorf, as detailed by
Otto and Österle (2016), provide insights into how
master data quality impacts business processes. These
studies demonstrate the consequences of poor master
data quality, such as process inefficiencies and
increased costs, illustrating their real-world impact.
However, as these studies are primarily qualitative,
based on methods such as interviews and workshops,
they fall short of providing quantifiable measures of
the precise impact of master data quality on process
quality. Building upon the approaches by Bayer Crop
Science and Beiersdorf, which involve the
quantification of master data quality with validation
rules, our study extends this concept by additionally
measuring process quality, enabling a statistical
analysis of the impact of master data quality on
process quality.
This research aims to bridge the gap in the field
by introducing a quantitative, replicable methodology
along with evidence from real-world applications,
providing a deeper understanding on the impact of
master data quality on process quality.
3 THEORETICAL
BACKGROUND
This section introduces the basics of process and data
quality, which form the fundament of the paper. The
overarching element is the term quality. Quality is
defined as "the degree to which a set of inherent
characteristics of an object meets requirements" (DIN
EN ISO 9001:2015, 2015, p. 39). Inherent in this
context means "inherent in an object" (DIN EN ISO
9001:2015, 2015, p. 39). Accordingly, the quality
concept describes the extent to which the properties
and characteristics of an object correspond to the
requirements and expectations placed on this object.
3.1 Process Quality
For a consideration of process quality, it is relevant to
understand what a business process consists of and
what factors influence its quality. A business process
can be defined as a „collection of inter-related events,
activities, and decision points that involve a number
of actors and objects, which collectively lead to an
Quantitative Analysis of the Relationship Between Master Data Quality and Process Quality
51
outcome that is of value to at least one customer“
(Dumas et al., 2018, p. 6). Dumas, La Rosa, Mendling
and Reijers (2018) approach the definition of business
process through the interrelationship of the individual
components of it.
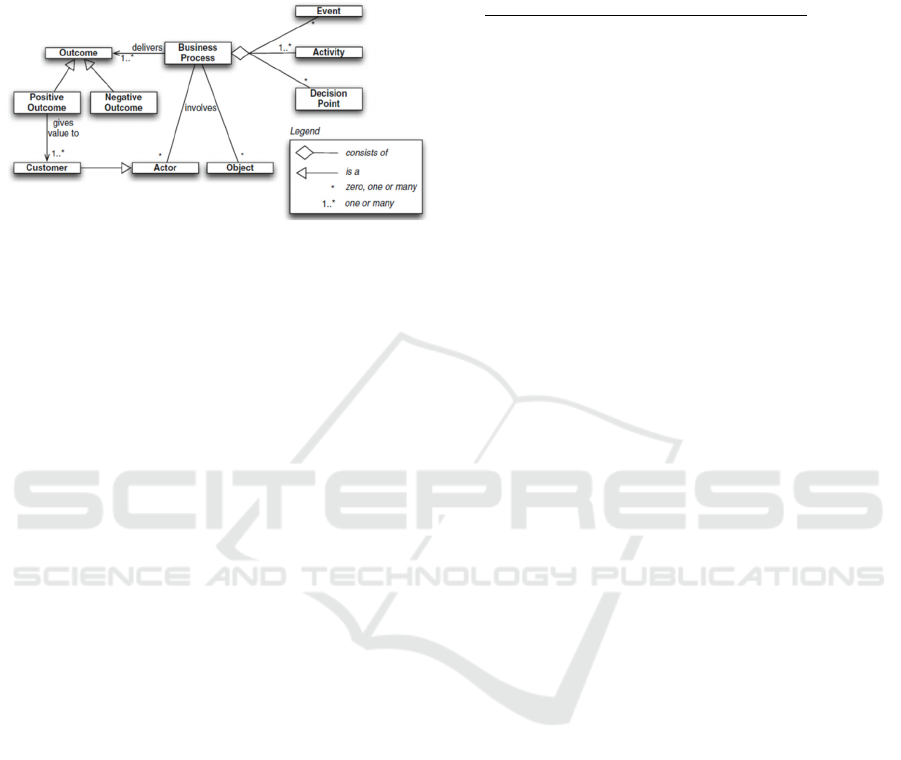
Figure 1: The ingredients of a business process proposed by
Dumas et al. (2018, p. 6).
Figure 1 presents an understanding of all
ingredients of a business process. It includes a
combination of events, activities, decision points,
actors, and objects. Briefly, events are things without
duration, like a purchase order arrival, and activities
are work that takes time, such as checking the order
for correctness. Decisions, like deciding whether a
purchase order is correct, can shift the process
direction. Actors, who execute actions or make
decisions, and objects, both tangible goods and data,
significantly contribute to process quality (Dumas et
al., 2018).
The competence of the actors and the master data
quality heavily drive the process quality,
underscoring their critical role in any business
process. In addition, Figure 1 shows that a business
process has a direct impact on customer needs as well
as strategic and operational goals of company, so that
these processes should be actively managed
(Schmelzer and Sesselmann, 2020). According to
Dumas et al. (2018), business process management
includes methods, concepts, techniques, and tools to
manage these processes.
Based on the statement “if you can’t measure it,
you can’t manage it“ (Kaplan and Norton, 1996, p.
21) business process management requires
instruments to measure process performance. So-
called process performance indicators are a suitable
instrument for analyzing processes in terms of their
performance and potential for improvement
(Schmelzer and Sesselmann, 2020). In this paper, the
First Pass Yield (FPY) is used as a key metric for
determining process quality, following existing
literature that have utilized this concept
(Schwegmann and Laske, 2012; Leyer et al., 2015;
Laue et al., 2021; Dumas et al., 2018). The FPY is
calculated as the percentage of completed process
runs that are error-free and did not require any rework
(Schmelzer and Sesselmann, 2020, p. 420). The
formula for the First Pass Yield (FPY) is as follows:
FPY (%) =
(
)
(
)
× 100
(1)
3.2 Data Quality
Data are characters that have been placed in a rule-
based context (North, 2016) and represent the basis
and origin for entrepreneurial actions (Krcmar, 2015).
Data objects represent entities. For example, in
the context of a company selling products, customers
and products are data objects. Data objects are
described by attributes. For example, the data object
"customer" can consist of the attributes name,
address, and customer number.
According to Wang & Strong (1996, p. 6) data
quality is defined as „data that are fit for use by data
consumers“. This perspective highlights the
importance of the data for users. The data user
ultimately determines the usefulness of the data based
on its suitability for the intended purpose (Strong et
al., 1997). According to Batini, Cappiello,
Francalanci and Maurino, (2009) data quality can be
represented by the dimensions accuracy,
completeness, consistency and timeliness.
Since the execution of business processes is based
on data (Weske, 2019) and data consumers use the
data in the context of business processes (Mützel and
Tafreschi, 2021), we follow the approach that data
quality is considered from the process perspective in
this paper. Given that master data serve as a
foundational basis for business processes (Ofner et
al., 2013), this paper study focuses on master data
when referring to data quality. Coming from the
process perspective it is necessary to analyze the
master data used by a process to evaluate the relation
between master data and process quality. To adopt
this perspective, the data quality of relevant master
data objects with its attributes is examined in relation
to their use in the process. The calculation of the data
quality KPI is presented in section 4.2.
4 METHODS
This section outlines the methods used for
quantifying data and process quality, serving as input
in the statistical analysis.
ICEIS 2024 - 26th International Conference on Enterprise Information Systems
52
4.1 Process Mining
Process mining is a method to evaluate process
execution by analyzing event-logs (Leyer at al., 2015;
Laue et al., 2021). Event logs document activity
execution in transaction systems such as Enterprise
Resource Planning (ERP) systems (Laue et al., 2021;
Fleischmann, 2018). Thus, insights into individual
process activities are provided (Dumas et al., 2018) to
develop, monitor and improve processes (Van der
Aalst, 2016).
We apply process mining to an existing business
process hierarchy to identify when and where rework
occurred to calculate the FPY. In the analyzed
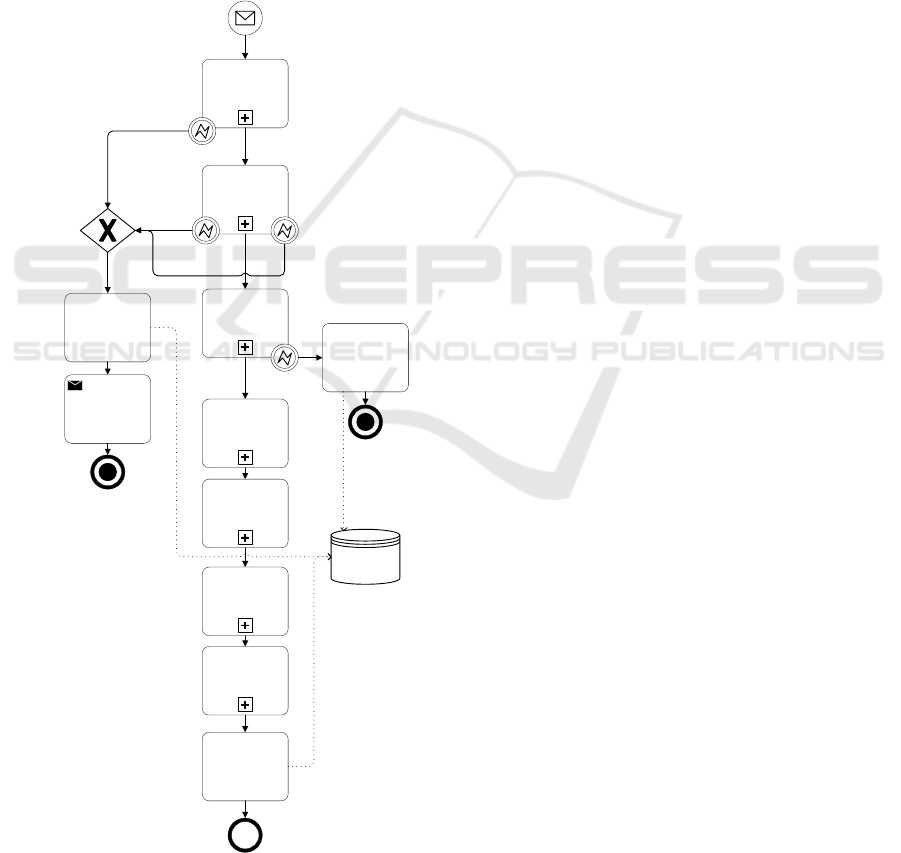
Figure 2: The overall order-to-cash (O2C) process.
company, the processes are designed and documented
according to Business Process Model and Notation
(BPMN) (Object Management Group, 2011).
As depicted in figure 2, the analyzed hierarchy
encompasses typical order-to-cash (O2C) processes,
comprising seven activities with sub-processes.The
O2C process starts when a customer places an order
and ends with the completion of the order after
payment receipt. It encompasses order validation,
order creation, delivery creation, transport creation,
dispatch-handling, invoice processing, payment
processing and the completion of the order. In
essence, the O2C-process, along with its sub-
processes, form the foundation of any business
operation, effectively managing the progression from
receiving a customer order to the receipt of payment
and the completion of the order.
In order to use process mining for the detection of
rework within the process, due to complexity and
amount of data to be analyzed we focused on the order
creation process, illustrated in figure 3 and described
below.
Over a period of one full year, we conducted a
comprehensive analysis of changes during the
execution of the order creation process. This in-depth
analysis includes a total of 6,619 orders, with 120
fields per order containing data.
The order creation process begins with the entry
of order details in the ERP system, utilizing existing
master data such as customer or product data, along
with external data received from the customer, e.g.,
order number.
Once the order has been saved, the system tracks
all data changes made to this order. It was observed
that not every modification in a process run equates
to rework in terms of the FPY. To accurately assess
the quality of a process run using process mining and
FPY, it is essential to distinguish between two types
of changes: planned changes and unplanned changes.
The differentiation between these change-types aids
in identifying whether a particular modification
should be categorized as rework, thereby impacting
the FPY.
Planned changes refer to modifications
incorporated within the process. Such data changes
do not represent “rework” in the FPY scope since they
are deliberate and desired. Examples of planned
changes which are not classified as rework include:
Automatic credit block because of exceeding
the credit limit. An employee has to check this
and unblock the order.
Purchase order
received
Validate
purchase order
Order creation
Create delivery
Create transport
Shipment
processing
Invoice
processing
Payment
processing
Order completed
Faulty
purchase order
Rule violation
not solvable
Faulty purchase
order
Decline
delivery date
Refuse purchase
order
Order declined
Cancel order
Order
canceled
Orders
Inform
customer
Complete order
Quantitative Analysis of the Relationship Between Master Data Quality and Process Quality
53
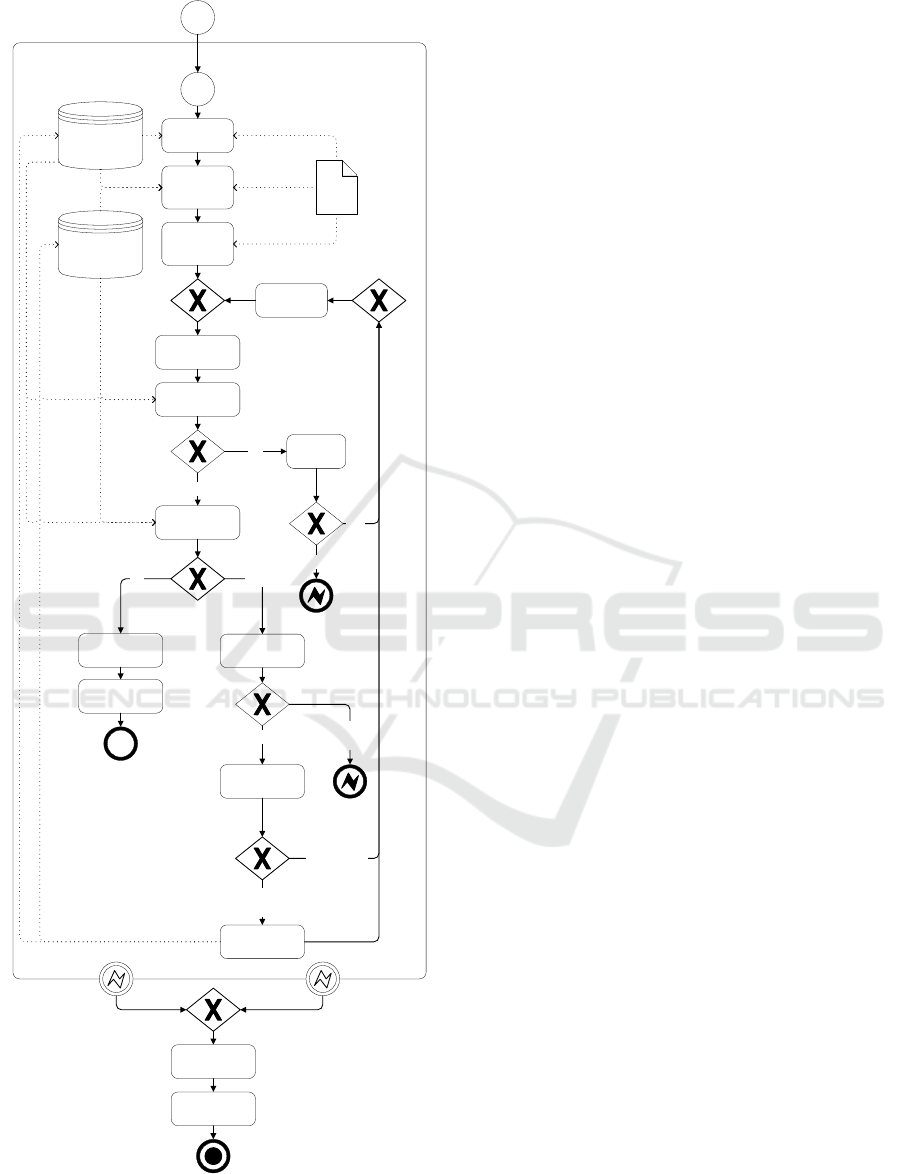
Figure 3: Order creation sub-process.
Automatic delivery block because the material
is currently not available. An employee has to
check the availability of the material and
unblock the order.
Automatic regulatory block because country of
goods recipient requires delivery approval. An
employee has to check with regulatory and
unblock the order.
Due to compliance, the system records values
of critical data fields into backup-tables. Those
recordings are listed as changes but do not
constitute rework.
On the other hand, unplanned changes are changes
stemming from erroneous user inputs or wrong
master data. Although the process design has a
correction mechanism for incorrect entries, these
corrective steps are labelled as “rework”. This implies
that the process run could not be flawlessly executed
at the first attempt. As outlined, “rework“, embodies
the crucial corrective action initiated by faulty entries.
Example for unplanned changes that resemble
rework:
Wrong payment terms are determined from the
master data.
A wrong material price is determined from the
master data.
Incoterm is determined from the master data.
A wrong customer ID is entered in the creation
process by the user, so that the customer ID has
to be changed.
Wrong product ID is entered by the user.
Amount of material is entered but does not fit
to the order of the customer, so that this has to
be changed.
A wrong delivery date is entered by a user, so
that it has to be changed.
For the next steps, it’s essential to identify all
changes in the process and assign them to planned and
unplanned changes, in order to accurately assess the
process quality using the FPY.
In addition to analyzing planned changes and
corrections, which are classified as rework, applying
process mining presented anther challenge. While
process mining provides deep insights into changes
made after order creation, it does not detect changes
made before the order is first saved. In the ERP-
system a user can manually adjust data in the order
entry interface during order creation. The pre-created
changes are invisible to process mining. To close this
analysis gap, we relied on comparing the actual saved
order data with the data pulled during the initial order
Order creation
Customer purchase
order approved
Start order
creation
Enter order
head data
Enter order
position data
Add relevant
documents
for order
Save order
Check business
rules
Business
rules are
correct?
Check created
order
Errors
detected?
Yes
Wrong
purchase
order
Release order
Send order entry
confirmation
Order entry
confirmation
is sent
No
Check error
origin
Yes
Error origin?
Purchase
order
Determine the
cause
Order
Maintain m aster
data
Wrong master
data
Correct
order
No
Wrong order
data
Open
deviations
Wrong
purchase
order
Clarify
deviations
Yes
Deviations
can be
clarified?
Open deviations
No
Refuse purchase
order
Inform
customer
Purchase order
is refused
Customer
Products
Purchase
order
ICEIS 2024 - 26th International Conference on Enterprise Information Systems
54

creation. This comprehensive approach increased the
accuracy of the FPY calculation. At the same time,
the comparison showed limitations of relying solely
on process mining for order change analysis.
The following example illustrates a scenario in
which changes, which are classified as rework, take
place before the order is created. Example: A
payment term of 60 days was stored in the customer
master data at the time of order creation. However,
the created order has a different payment term of 30
days and process mining does not show an event log
documenting this change. This example illustrates
that such changes are not being captured by process
mining, although they can be essential for correctly
determining the FPY, since the mentioned change is
classified as rework.
4.2 Validation Rules
To determine the master data quality, validation rules
that target different data quality dimensions were
checked.
Data quality was measured at the moment of order
creation. The temporal aspect of data is important
because this is the timepoint when the data has to be
“fit for use” by the data consumer – the O2C process.
Given that master data can undergo changes,
capturing its quality at the precise moment of use
posed a complex challenge. For example, a tax
number can become invalid, although it was used two
weeks earlier in an order.
To overcome this, we conducted a retrospective
analysis, examining changes to the master data object
since its use in the specific process run. This allowed
us to apply validation rules to the data as it was during
its actual use. Based on the validation results, a KPI
is determined that reflects the correctness of a data
object.
Since the validated master data objects consist of
many individual attributes, not all of which are
relevant to the selected sub-process “order creation”,
process-relevant master data attributes were
identified.
The approach, including the formulas used to
determine the master data quality at the data object
level, is described in the following. The attributes
examined with validation rules can take on values of
0 or 1.
𝑎
1,if the attribute is error − free within the scope of the validation rules
0,if the attribute is erroneous within the scope of validation rules
In this context, 𝑎𝑖 represents the attribute and the
values behind the curly braces represent the state that
the attribute can inherit. Once all identified attributes
of a master data object have been checked using
validation rules, the quality of the considered master
data object is determined:
𝑂
(
𝑎
)
= 𝑎
(2)
𝑂(𝑎
𝑖
) represents the quality of the master data
object depending on the 𝑛 examined attributes. For
its calculation, the values of the examines
attributes (𝑎
𝑖
) are multiplied. This approach is
chosen because master data objects that have errors
are no longer considered “fit for use” in the context
of the process utilization.
The following formula is applied for the
calculation of the master data quality of all used
master data objects:
𝐷𝑄 (%) =
𝑝
𝑞
× 100
(3)
It is given that:
𝑝= 𝑂
(
𝑎
)
; ∀ 𝑂
(𝑎
) ≠0
𝑞= 𝑂
(
𝑎
)
; ∀ 𝑂
(𝑎
) {0,1}
In this context, p represents the sum of the 𝑚
objects 𝑂
𝑗
(𝑎
𝑖
) that have a value not equal to 0. This
means that they have no errors in the attributes. This
number is divided by
q
.
q
represents the count of all
examined master data objects 𝑂
𝑗
(𝑎
𝑖
).
4.3 Methodological Approach from a
Process Perspective
A structured process will be developed to determine
the relevant data for calculating the KPIs.
Subsequently, this data will be used to calculate the
linear regression. The process model in figure 4
illustrates how both process quality and data quality
of the used master data objects can be inferred from a
process run.
The process model starts with the created order.
Subsequently, target and actual data for the master
data attributes defined in the order are retrieved.
These data are compared with each other and checked
for identity. If the data is not identical, this indicates
that the first process run is not error-free. The process
quality is set to zero. If the data is identical, the
process run is evaluated with a quality of one.
Quantitative Analysis of the Relationship Between Master Data Quality and Process Quality
55
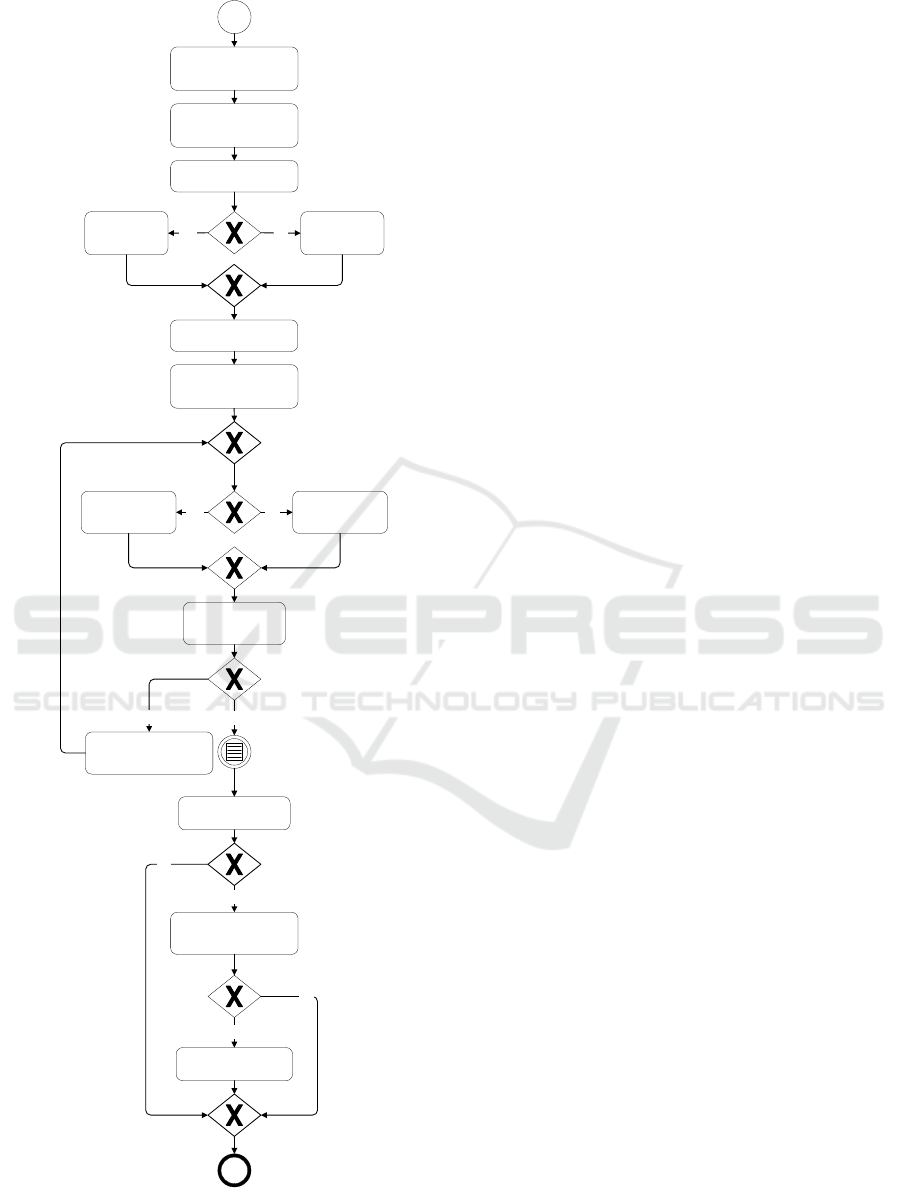
Figure 4: KPI determination process.
Following that, the used master data attributes are
validated for their quality using validation rules.
Based on the results of the attribute validation, a
quality assessment is carried out for the first used
master data object. If the attributes associated with the
master data object do not violate any rules, the master
data object is rated with a quality score of one. If rule
violations are detected for at least one attribute, the
master data object is rated with a quality score of zero.
Subsequently, it will be verified whether all
utilized master data objects have a quality
assessment. If not, the next master data object will be
evaluated. After the quality of all used master data
objects has been determined, the process continues
once the order has been marked as completed.
Afterwards, it will be checked whether the process
run was rated with quality one. If this is not the case,
the process ends with the collected process quality
and master data quality on an object level. If the
process run was rated with quality one, it will be re-
evaluated for rework using process mining. If rework
is detected, the process run will be rated with quality
zero. If the process run has no rework, the quality of
the process run remains at one. The collected process
quality and master data quality on an object level for
the specific process run form the end result.
Based on the data collected, the KPIs are
calculated, and the statistical analysis is performed.
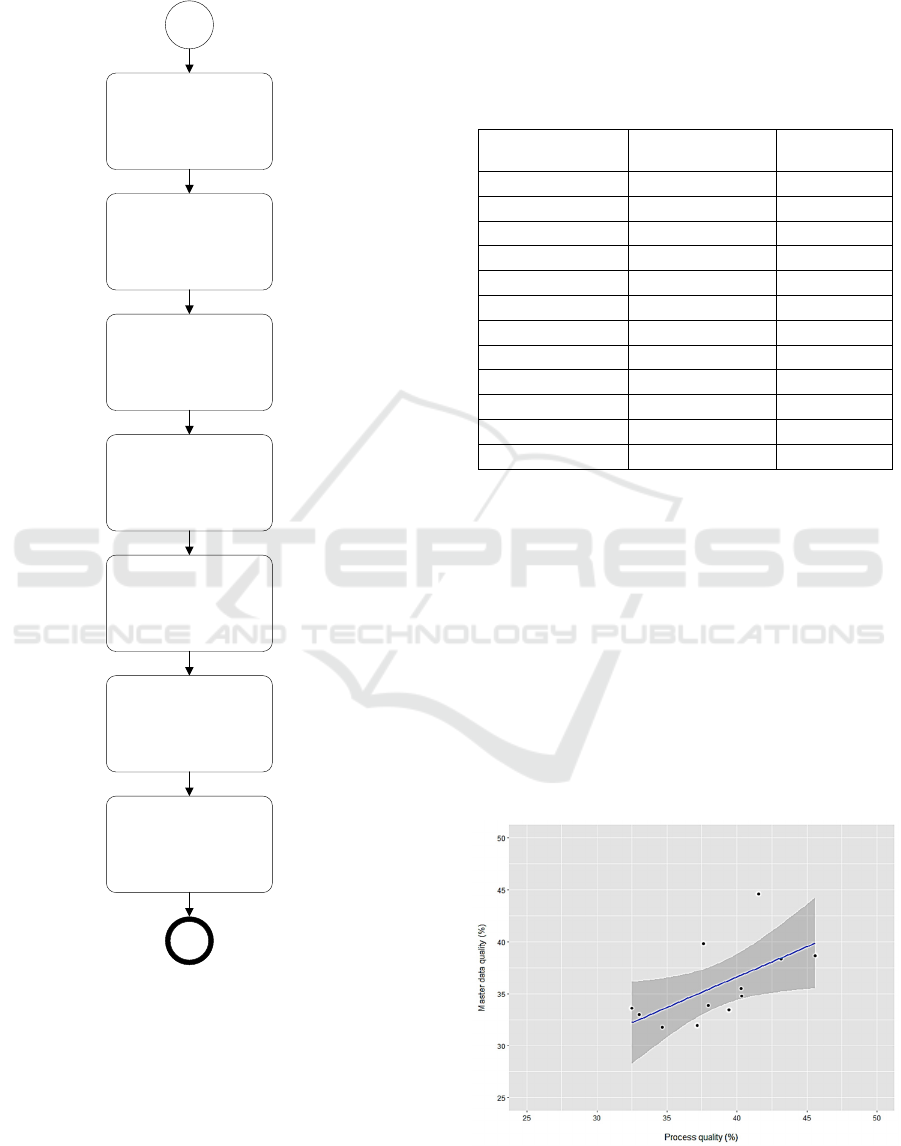
The process model is shown in figure 5 and begins at
the end of the evaluation period.
All process runs that occurred during this time are
then selected. Based on the quality assessment of the
specific process runs, the First Pass Yield is
calculated on a monthly basis. Subsequently, all used
master data objects and their quality are retrieved to
calculate the data quality on a monthly basis. A linear
regression is then calculated, and its results are
interpreted. The interpreted results of the linear
regression form the conclusion of the process model.
4.4 Statistical Analysis
The quantitative investigation of the relationship
between master data quality and process quality is
conducted by performing statistical analysis. The
KPIs described in sections 3 and 4 are used and the
relationship is tested for statistical significance in a
two-sided linear regression. The defined significance
level is 5% (Bortz & Schuster, 2010, p. 181). If master
data quality and process quality are linked by a linear
regression, process quality can be predicted by master
data quality. In addition to the linear regression, Cook
distances are calculated to check the data set for
influential values that could be outliers. Statistical
Order created
Retrieve target data for
master data attrributes in
the order
Retrieve actual data for
master data attributes in
the order
Compare target data and
actual data
Data
identical?
Set process
quality to 0 for
process run
Set process
quality to 1 for
process run
Check m aster data quality
for used attributes
Determine for the first
used master data object
O(ai) the attribute results
At least one
rule
violation?
Yes
Set the master data
object O(ai) to 0
regarding quality
No
Set the master data
object O(ai) to 1
regarding quality
Check if all master
data object O(ai) are
classified
All objects
O(ai)
classified?
No
Determine for the next
used master data object
O(ai) the attribute results
Order is closed
Yes
Check process quality
for process run
Check process mining for
rework within process
run
Proces s
quality
is 1?
Yes
No
Rework
detected?
Set process quality for
process run to 0
Yes
No
Process quality and master data object quality
for process run determined
Yes No
ICEIS 2024 - 26th International Conference on Enterprise Information Systems
56
Analysis Software RStudio was used to perform the
regression model and Cook distance calculations.
Figure 5: Data collection process.
5 RESULTS
In this section the results of the developed approaches
are presented.
5.1 Process Quality
The First Pass Yield was calculated with the data for
a complete business year on a monthly basis. Table 1
shows the process quality over a full year
a
nd the
analyzed process runs.
Table 1: Process quality over a full year.
Month Process quality
(PQ)
Amount of
orders
January 41.52 % 643
February 37.63 % 582
March 43.13 % 670
April 40.30 % 603
May 40.33 % 486
June 45.56 % 509
July 39.45 % 550
August 37.15 % 463
September 37.94 % 543
October 34.70 % 585
November 33.03 % 548
December 32.49 % 437
The process quality averaged 38.60% from
January to December (M = 38.60, SD = 3.95). At
45.58%, the highest process quality was recorded in
June. The lowest process quality was 32.49% in
December.
5.2 Data Quality
Table 2 shows the data quality over the period of one
analyzed year. The data quality averaged 35.80%
from January to December (M = 35.80, SD = 3.85).
At 44.63%, the highest data quality was recorded in
January. The lowest data quality was 31.79% in
October.
Figure 6: Regression model.
End of
evaluation
period
Select all process runs
in evaluation period
Get process quality for
all selected process
runs
Calculate monthly
FPY for evaluation
period
Get data quality for all
used master data
objects O(ai) for
selected process runs
Calculate monthly data
quality for evaluation
period
Calculate linear
regression
Interpret linear
regression results
Linear regression
interpreted
Quantitative Analysis of the Relationship Between Master Data Quality and Process Quality
57
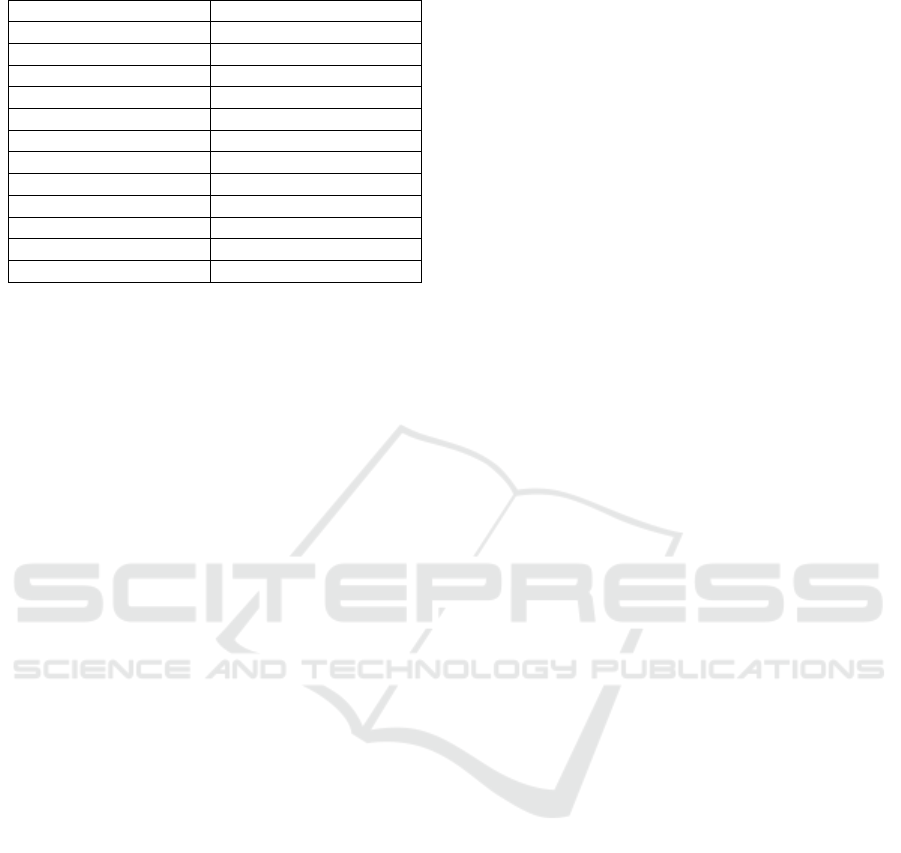
Table 2: Data quality over a full year.
Month Data
q
ualit
y
(
DQ
)
Januar
y
44.63 %
Februar
y
39.86 %
March 38.36 %
April 35.49 %
May 34.77 %
June 38.70 %
Jul
y
33.45 %
Au
g
ust 31.97 %
Septembe
r
33.89 %
Octobe
r
31.79 %
Novembe
r
33.03 %
Decembe
r
33.64 %
5.3 Linear Regression
As part of the statistical analysis to examine the
relationship between master data quality and process
quality, a linear regression model was performed.
Data used in the statistical analysis are listed in table
1 (process quality) and table 2 (master data quality).
The error level α was set to 5%. Prior to statistical
analysis, Cook distances were calculated as a measure
of the influence of individual data points on the
regression model (Cook & Weisberg, 1982). Cook
distances were < 1, so it can be assumed that there are
no outliers.
Statistical analysis revealed a significant
relationship of process quality and master data quality
(F (1, 10) = 5.67, p = 0.039). The relationship
between process quality and master data quality is
positive (β = 0.62, t = 2.38). This indicates that the
higher the master data quality, the higher the process
quality.The determination coefficient R
2
was 0.36,
which according to Cohen (1988: p. 80) corresponds
to a large effect. Overall, 36% of the variance in
process quality can be explained by master data
quality. The regression model is depicted in figure 6.
6 DISCUSSION
In this chapter, a comprehensive discussion will be
presented which entails an interpretation of the
findings, an exploration of the limitations, and a
conclusive summary accompanied by an outlook on
potential future research directions.
6.1 Interpretation
To analyze the relationship between master data
quality and process quality, methods were devised to
quantify both variables in a business setting. Master
data quality was assessed at the critical point of order
creation by utilizing validation rules on various data
attributes, deriving a quantifiable measure. The
fluctuation in master data quality percentages
observed monthly, with a high of 44.63% and a low
of 31.78%, illustrates the utility of this method in
capturing temporal variations in data quality.
Similarly, process quality was assessed by
applying process mining techniques to the order
creation phase of the O2C process, obtaining a
tangible measure of process quality via the
calculation of First Pass Yield (FPY). The variability
in monthly FPY values indicates the fluctuating
nature of process quality over time.
The linear regression analysis revealed a
significant relationship between master data quality
and process quality. Specifically, the model suggests
that for every unit increase in data quality, there's an
associated 0.62 unit increase in process quality. This
finding demonstrates that ensuring high master data
quality can lead to better process outcomes and
provides a basis for predicting process quality
developments. These findings significantly address
the central research questions, highlighting the
critical interplay between master data quality and
process quality in operational efficiency.
6.2 Limitation
The methods used in this study and the resulting
findings are subject to certain limitations, which are
explained below. Due to the complexity of the O2C
process, the analysis focused on the sub-process order
creation to allow for an in-depth investigation.
However, this focus could limit the generalizability
of the results.
The applicability of process mining is another
limitation. Since process mining can only capture
changes to the order-object after it has been created,
analyzing all changes by using only process mining is
prone to error. To overcome this limitation, a manual
reconciliation of changes before saving the order
object was performed, but this could affect the
comparability and reproducibility of the results.
The restriction of the analysis period to one year
also poses a limitation. Extending the timeframe
could yield more in-depth insights, as it would enable
better identification and analysis of long-term trends.
7 CONCLUSION & OUTLOOK
The aim of this paper was to analyze the relationship
between master data quality and process quality in a
ICEIS 2024 - 26th International Conference on Enterprise Information Systems
58

business environment guided by the central research
question: How much does the quality of master data
influence the quality of a process? To quantify this
relationship the two sub-questions were derived: How
to quantify the process quality in business practice
and how to quantify the quality of master data in
business practice? A methodical approach was taken
to create reliable metrics to measure both master data
quality and process quality in a real-world setting,
showcasing a practical model for other businesses to
follow.
By applying methods in the order-to-cash process,
specifically within the order creation sub-process, this
study was able to capture the temporal variations in
master data quality and the fluctuating nature of
process quality over time. This provided a foundation
for conducting a linear regression analysis, which
unveiled a significant positive relationship between
master data quality and process quality.
With quantifiable metrics, the analysis revealed
that a unit increase in master data quality correlated
with a 0.62 unit increase in process quality. This
finding not only underscores the crucial importance
of maintaining high master data quality but also
presents a potential pathway for predicting and
improving process quality based on master data
quality enhancements.
Looking forward, the discussed limitations of this
study lay the foundation for an expanded exploration.
The focus on the order creation phase due to the O2C
process's complexity has spotlighted the need for
broader research encompassing other crucial phases
of the O2C process, thereby providing a more holistic
understanding of how master data quality impacts the
quality of the complete O2C-process.
The utilization of process mining, though
effective, was initially limited to capturing changes
post-order creation. However, in this study, a manual
process was defined to identify changes prior to order
creation, aiming to negate this limitation. Although
effective, this manual workaround could potentially
affect the comparability and reproducibility of the
results. In the future, further refinement in the
methodology or the integration of automated
analytics tools may provide more accurate
assessments of process alterations, reducing the need
for manual interventions.
A weighting of master data attributes in
measuring master data quality could be a potential
area for enhancement. Implementing weighting
schemes could account better for the relevance of
individual data attributes in the context of their usage
in the process, leading to a more precise assessment
of master data quality.
Moreover, the temporal restriction of the study to
a one-year analysis period hints at the necessity of a
long-term analysis to unveil more profound insights
and make long-term trends more discernible and
analyzable. Conclusively, this study indicates a
pathway for future research and practical
interventions to enhance both data and process
quality, thereby driving better business outcomes.
REFERENCES
Allen, F., & Santomero, A. M. (1997). The theory of
financial intermediation. Journal of Banking &
Finance, 21(11-12), 1461-1485.
Apel, D., Behme, W., Eberlein, R., Merighi, C. (2015):
Datenqualität erfolgreich steuern: Praxislösungen für
Business-Intelligence-Projekte, 3. Aufl., überarb. u.
erw., Heidelberg, Deutschland: dpunkt.verlag GmbH.
Batini, C., Cappiello, C., Francalanci, C., Maurino, A.
(2009): Methodologies for Data Quality Assessment
and Improvement, in: ACM Computing Surveys, Bd. 41,
Nr. 3, S. 16:1 – 16:52, [online] doi:
10.1145/1541880.1541883
Batini, C., Scannapieca, M. (2006): Data Quality: Concepts
Methodologies and Techniques, Berlin, Heidelberg:
Springer Verlag.
Bortz, J., Schuster, C. (2010): Statistik für Human- und
Sozialwissenschaftlicher, 7. Aufl., Berlin, Heidelberg:
Springer-Verlag.
Castells, M. (2010). The rise of the network society (2nd
ed.). Wiley-Blackwell.
Cohen, J. (1988). Statistical power analysis for the
behavioral sciences, 2. Aufl., Hillsdale: L. Erlbaum
Associates.
Cook, D./ Weisberg, S. (1982): Criticism and Influence
Analysis in Regression, in: Sociological Methodology,
13. Jg, Washington: American Sociological
Association, S. 313-361.
Dumas, M., La Rosa, M., Mendling, J., Reijers, H. (2018):
Fundamentals of Business Process Management, 2.
Aufl., Berlin: Springer-Verlag GmbH.
Fleischmann, A., Oppl, S., Schmidt, W., Stary, C. (2018):
Ganzheitliche Digitalisierung von Prozessen:
Perspektivenwechsel – Design Thinking –
Wertegeleitete Interaktion, Wiesbaden: Springer
Vieweg.
Fürber, C., Sobota, J. (2011): Eine Datenqualitätsstrategie
für große Organisationen am Beispiel der Bundeswehr,
in: Knut Hildebrand, Boris Otto, Anette Weisbecker
(Hrsg.), HMD Praxis der Wirtschaftsinformatik, 48.
Jg., Nr. 3, S. 36-45.
Götze, U., Leidich, E., Kochan, C., Köhler, S. (2014):
Integrierte Daten-, IT- und Prozessanalyse im Rahmen
des Stammdaten- und Geschäftsprozessmanagements,
in: Begleitforschung Mittelstand-Digital (Hrsg.),
Mittelstand Digital Wissenschaft trifft Praxis: Digitale
Standards im elektronischen Geschäftsverkehr, 2.
Quantitative Analysis of the Relationship Between Master Data Quality and Process Quality
59

Ausg., Bad Honnef: Begleitforschung Mittelstand-
Digital, 34-41.
Hinrichs, H. (2002): Datenqualitätsmanagement in Data
Warehouse-Systemen, Dissertation, Oldenburg:
Universität Oldenburg, [online] http://oops.uni-
oldenburg.de/279/1/309.pdf [zuletzt abgerufen am
25.01.2021]
Hüner, K., Schierning, A., Otto, B., Österle, H. (2011):
Product data quality in supply chains: the case of
Beiersdorf, in: Electronic Markets, Bd. 21, Nr. 2, S.
141-154. [online] doi: 10.1007/s12525-011-0059-x
Kaplan, R., Norton, D. (1996): Translating strategy into
action: the Balanced Scorecard, Boston: Harvard
Business School.
Knut, H. (2018): Master Data Lifecycle – Management der
Materialstammdaten in SAP ®, in: Hildebrand, K.,
Gebauer, M., Hinrichs, H., Mielke, M. (Hrsg.), Daten
und Informationsqualität: Auf dem Weg zur
Information Excellence, 4. Aufl., Wiesbaden: Springer
Vieweg, S. 299-309.
Krcmar, H. (2015): Informationsmanagement, 6. Aufl.,
Heidelberg, Heidelberg: Springer
Laue, R., Koschmider, A., Fahland, D. (2021):
Prozessmanagement und Process-Mining, Berlin,
Bostong: Walter de Gruyter GmbH.
Leyer, M., Heckl, D., Moormann, J. (2015): Process
Performance Measurement, in: vom Brocke, J.,
Rosemann, M. (Hrsgb.), Handbook on Business
Process Management 2: Strategic Alignment,
Governance, People and Culture, 2. Aufl., Berlin,
Heidelberg: Springer-Verlag, 227-242.
Mützel, M., Tafreschi, O. (2021): Data-Centric Risk
Management for Business Processes, in: Proceedings of
the 54th Hawaii International Conference on System
Sciences, S. 5728 – 5737.
North, N. (2016): Wissensorientierte Unternehmens-
führung: Wissensmanagement gestalten, 6.,
Wiesbaden: Springer Gabler
Object Management Group - (OMG) (2011), “Business
Process Model and Notation (BPMN),”
http://www.omg.org/spec/BPMN/2.0/
Ofner, M., Straub, K. Otto, B., Oesterle, H (2013):
Management of the master data lifecycle: a framework
for analysis, in: Journal of Enterprise Information
Management, Vol. 26, Nr. 4, S. 472-491, [online] doi:
10.1108/JEIM-05-2013-0026
Otto, B., Hüner, K. (2009): Funktionsarchitektur für
unternehmensweites Stammdatenmanagement, St.
Gallen: Universität St. Gallen, Institut für
Wirtschaftsinformatik.
Otto, B., Kokemüller, J., Weisbecker, A., Gizanis, D.
(2011): Stammdatenmanagement: Datenqualität für
Geschäftsprozesse, in: HMD Praxis der
Wirtschaftsinformatik, 48. Jg., Nr. 3, S. 5-16, [online]
doi: 10.1007/BF03340582.
Otto, B., Österle, H. (2016): Corporate Data Quality:
Voraussetzung erfolgreicher Geschäftsmodelle, 1.
Aufl., Berlin, Heidelberg: Springer.
Schäffer, T., Leyh, K. (2017): Master Data Quality in the
Era of Digitization - Toward Inter-organizational
Master Data Quality in Value Networks: A Problem
Identification, in: Piazolo, F., Geist, V., Brehm, L.,
Schmidt, R. (Hrsgb.), Innovations in Enterprise
Information Systems Management and Engineering,
Cham: Springer International Publishing AG.
Scheibmayer, M., Knapp, M. (2014):
Stammdatenmanagement in der produzierenden Industrie,
Schuh, G., Stich, V. (Hrsg.), Aachen: FIR e.V. an der
RWTH Aachen, knapp:consult.
Schemm, J. (2009): Zwischenbetriebliches
Stammdatenmanagement: Lösungen für die
Datenynchronisation zwischen Handel und
Konsumgüterindustrie, Österle, H., Winter, R.,
Brenner, W. (Hrsg.) , Berlin, Heidelberg, Deutschland:
Springer.
Schmelzer, H., Sesselmann, W. (2020):
Geschäftsprozessmanagement in der Praxis: Kunden
zufrieden stellen - Produktivität steigern - Wert
erhöhen, 9. Aufl., München: Carl Hanser Verlag GmbH
& Co. KG.
Schwegmann, A., Laske, M. (2012): Der Prozess im Fokus,
in: Becker, J., Rosemann, M., Kugeler, M. (Hrsg.),
Prozessmanagement – Ein Leitfaden zur
prozessorientierten Organisationsgestaltung, 7. Aufl.,
Berlin, Heidelberg: Springer Gabler, 165-192.
Strong, D., Yang, L., Wang, R. (1997): 10 Potholes in the
Road to Information Quality, in: Computer, Bd. 30, Nr.
8, S. 38-46, [online] doi: 10.1109/2.607057
van der Aalst, W. (2016): Process Mining: Data Science in
Action, 2. Aufl., Berlin, Heidelberg: Springer-Verlag
Wang, R., Strong, D. (1996): Beyond Accuracy: What Data
Quality Means to Data Consumers, in: Journal of
Management Information Systems, Bd. 12, Nr. 4, S. 5-
33, [online] doi: 10.1080/07421222.1996.11518099
Weske, M. (2019): Business Process Management:
Concepts – Languages – Architectures, 3. Aufl., Berlin:
Springer-Verlag GmbH.
ICEIS 2024 - 26th International Conference on Enterprise Information Systems
60
