
Toward Objective Variety Testing Score Based on Computer Vision and
Unsupervised Machine Learning: Application to Apple Shape
Mouad Zine-El-Abidine
1
, Helin Dutagaci
2
, Pejman Rasti
1,3
,
Maria Jose Aranzana
4
, Christian Dujak
4
and David Rousseau
1
1
Universit
´
e d’Angers, LARIS, UMR INRAe, IRHS, France
2
Eskisehir Osmangazi University, Department of Electrical-Electronics Engineering, Eskisehir, Turkey
3
CERADE,
´
Ecole d’Ing
´
enieur Informatique et Pr
´
evention des Risques (ESAIP), Angers, France
4
Centre de Recerca en Agrigen
´
omica: Cerdanyola del Valles, Catalunya, Spain
Keywords:
Variety Testing, Variety Classification, Shape Description, Apple Shape.
Abstract:
While precision agriculture or plant phenotyping are very actively moving toward numerical protocols for ob-
jective and fast automated measurements, plant variety testing is still very largely guided by manual practices
based on visual scoring. Indeed, variety testing is regulated by definite protocols based on visual observation
of sketches provided in official catalogs. In this article, we investigated the possibility to shortcut the human
visual inspection of these sketches and base the scoring of plant varieties on computer vision similarity of
the official sketches with the plants to be inspected. A generic protocol for such a computer vision based
approach is proposed and illustrated on apple shape classification. The proposed unsupervised algorithm is
demonstrated to be of high value by comparison with classical supervised and self supervised machine and
deep learning if some rescaling of the sketches is performed.
1 INTRODUCTION
Plant variety testing refers to the activity of assessing
new varieties of plants before registering them in an
official authorized catalog. The test can assess char-
acteristics such as appearance, resistance to various
stresses and agronomical value. So far variety testing
is mostly based on human visual inspection. For scor-
ing of key characteristics, experts follow guidelines
in the form of either written instructions or visual ref-
erence sketches. Such guidelines are usually deliv-
ered in a catalog by an official variety testing organ-
ism, such as The International Union for the Protec-
tion of New Varieties of Plants (UPOV). Trait descrip-
tors are also scored by breeders and germplasm cura-
tors, who follow in-house or published/recommended
guidelines. Two limitations of manual assessment by
experts are that the rating is non-objective and that the
process is slow and time-consuming. The objective of
this article is to propose a fast and objective generic
protocol adapted to the specific requirement of variety
testing with the help of computer vision.
Computer vision is now widely used in plant phe-
notyping and agriculture (Mahlein, 2016; Li et al.,
2020; Dhanya et al., 2022) and especially for fruit
phenotyping (Bhargava and Bansal, 2021). Computer
vision has been only recently explored in the domain
of variety testing (Couasnet et al., 2021; El Abidine
et al., 2020; Zine-El-Abidine et al., 2021; Garbouge
et al., 2021b; Garbouge et al., 2021a; Koklu et al.,
2021; Meng et al., 2022; Cao et al., 2022). This ar-
ticle is a new contribution in this recent application
domain of computer vision to variety testing.
One can distinguish two approaches in computer
vision (Szeliski, 2022). The traditional approach is
the model-based approach where the characteristics
of the objects to be analyzed in the scene are trans-
lated into geometrical shapes. Features, i.e. set of
numbers, are then computed on these geometrical
shapes and the computer takes decision in this feature
space. The current leading approach is the data-driven
approach where the features space and the decision
making are built, without the help of a mathematical
expert to translate shape into features, in a supervised
manner based on training data set (part of the data
on which the expect output of the model, i.e. ground
truth, is manually established) to produce a model that
will then be used for inference on unseen data.
Zine-El-Abidine, M., Dutagaci, H., Rasti, P., Aranzana, M., Dujak, C. and Rousseau, D.
Toward Objective Variety Testing Score Based on Computer Vision and Unsupervised Machine Learning: Application to Apple Shape.
DOI: 10.5220/0012549700003720
Paper published under CC license (CC BY-NC-ND 4.0)
In Proceedings of the 4th International Conference on Image Processing and Vision Engineering (IMPROVE 2024), pages 15-22
ISBN: 978-989-758-693-4; ISSN: 2795-4943
Proceedings Copyright © 2024 by SCITEPRESS – Science and Technology Publications, Lda.
15

Coupling computer vision with data-driven super-
vised machine learning techniques has been proven
to be successful for many phenotyping tasks (Benos
et al., 2021; Li et al., 2020; Pathan et al., 2020).
However, computer vision models produced via su-
pervised machine learning depend on the training data
set. Consequently, there are some constraints on the
training data set to ensure a good generalization on
the unseen data set. First, the training data set has to
be representative of the unseen data to be tested. Sec-
ond, the size of the training data set has to be large
enough to fit with good generalization properties the
parameters to be adapted in the models. When us-
ing Deep learning, the most powerful and common
tools in data driven approach, the typical minimal size
of the training data set is some few thousands or in-
stances at least. These basics of supervised machine
learning clearly indicate that this approach is not suit-
able to mimic the current protocol for variety testing.
Indeed, in variety testing experts establish their rat-
ings in reference to the visual comparison between a
very small set of sketches (typically some units) and
the inspected real plants. These sketches cannot con-
stitute a large enough training set. Also, since the
experts can disagree on their ratings due to subjec-
tive interpretations of the official sketches, supervised
machine learning using ground truth provided by an
expert may embed some bias to their inference mod-
els and therefore not be representative of the unseen
data to be tested.
Supervised machine learning appears not suitable
for variety testing based. In this work, we investigate
the possibility to directly use reference sketches in an
official catalog for quantitative matching with images
of plants to be assessed (see Fig. 4). We test this ap-
proach, which is novel in the context of variety test-
ing, on the problem of apple shape assessment. The
closest related problem in computer vision is sketch-
based image retrieval (SBIR), where the objective is
the retrieval of related images from a data base given a
sketch query (see (Zhang et al., 2019) for a recent re-
view). The SBIR method combines information from
both datasets (sketches and RGB images) for a high
accuracy image retrieval. Rather than image retrieval,
we target classification of RGB images of apples by
quantitatively matching them with catalog sketches.
As another field of related work, shape-based clas-
sification and grading of fruits based on supervised
machine learning has been widely studied in the liter-
ature (Ishikawa et al., 2018; Jana and Parekh, 2017;
Kheiralipour and Pormah, 2017; Hu et al., 2018; Ireri
et al., 2019; Li et al., 2019). By contrast, while we
use classical shape features to characterize the shape
of apples, we do not promote a supervised machine
learning techniques here. To the best of our knowl-
edge, there exists no previous work for development
of a sketch-based classification tool in the context of
variety testing.
The article is structured in the following way.
We first present the material and methods used for
the apple use case chosen to illustrate our a sketch-
based classification tool. For fair comparison we will
naturally compare our approach either in terms of
performance and energy consumption with some of
the state-of-the-art supervised or self-supervised deep
learning methods. We demonstrate and discuss the
domain of superiority of our approach and its generic
interest for other use cases in variety testing conclude.
2 MATERIALS AND METHODS
2.1 Reference Sketches
The apple shape classification tool currently follows
the UPOV rules. In this variety testing framework,
experts inspect cut apple shapes by comparing them
to the reference sketches in the official variety test-
ing catalog (see Fig. 1). Three main classes are used
to designate the shape of apples: Flat, Globose and
Oval. For each category, there are sub-categories
such as Flat-Globose, Oblong and Ellipsoid. In this
study, we target classification of apple images into
three broad categories: Flat, Globose and Oval.
2.2 Data Set
The image acquisition procedure is shown in Fig. 2.
As image acquisition procedure, apples from the Ref-
pop population (Jung et al., 2020)) are cut along their
medial axis, placed on their flat, freshly cut side in
groups of 6 on an HP Scanjet Pro 4500 fn1 with max-
imum resolution of 1200 x 1200 dpi. Since the con-
trast between the apples and the background is strong,
we used simple thresholding on the brightness chan-
nel of HSB color space to segment the apples from the
background. The bounding box of each individual ap-
ple is obtained through connected component analy-
sis. A simple edge detection via Sobel filter is applied
to produce a binary image highlighting the boundaries
of the apples (see Fig. (4)).
Overall, 1821 images were acquired and classified
independently by two experts. Figure 3 shows the
distribution of the classes (Flat, Globose and Oval)
corresponding to the annotations of the two experts.
Three sets of class labels resulted from this annota-
tion. The class labels provided by expert 1, by ex-
pert 2 and a subset labeled in agreement by both ex-
IMPROVE 2024 - 4th International Conference on Image Processing and Vision Engineering
16
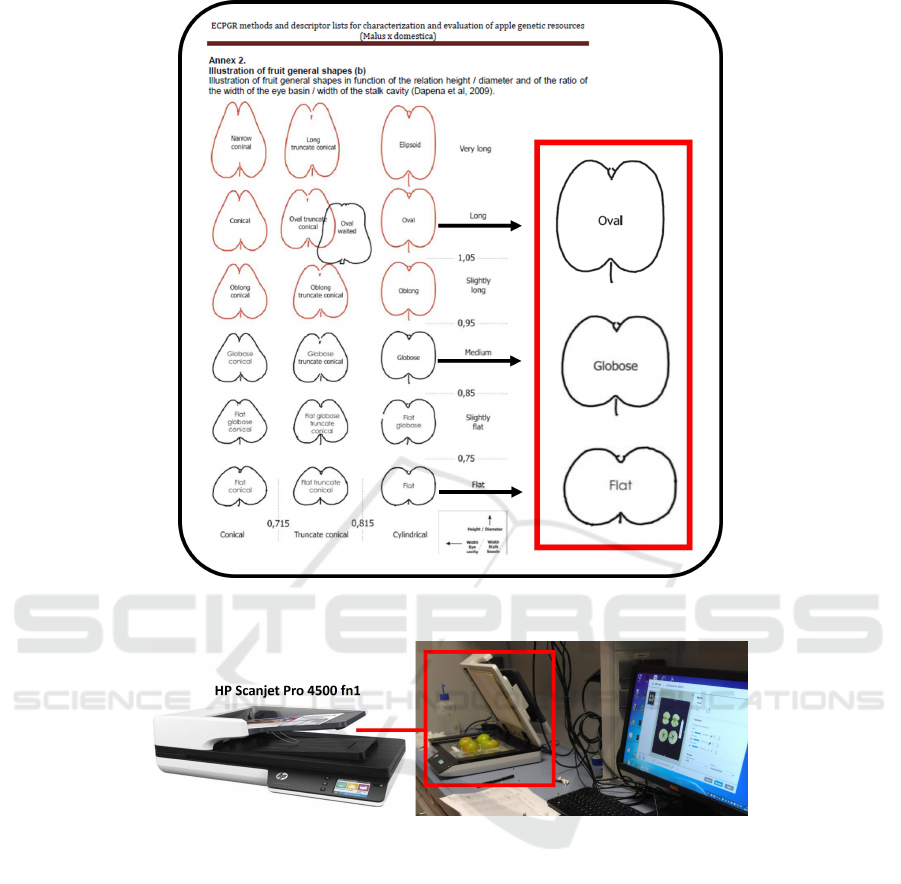
Figure 1: Reproduced and modified view of the ECPGR catalog. Apple shape sketches in the catalog of variety testing. The
classes considered in this work are highlighted in the red rectangle.
Figure 2: Acquisition device: HP Scanjet Pro 4500 fn1.
perts (600 images) were kept. This quantifies the
inter-variability between expert and the current con-
sequences of subjective rating. This also shows the
intrinsic difficulty of the visual tasks raised to experts
in variety testing where experts only agree in 30% of
the cases.
2.3 Shape Descriptors
In this article, since our aim is not to provide new
features to characterize apple shape but rather to in-
vestigate the possibility to use the reference sketches
for apple shape classification, we used some exist-
ing shape descriptors (Ishikawa et al., 2018; Ghazal
et al., 2021). We used chain-code histogram, ellip-
tical Fourier descriptors (Kuhl and Giardina, 1982)
and Frechet’s Ratio with the following hyperparam-
eters. The connectivity for the chain-code was take to
8. The 10 first harmonics of elliptical Fourier descrip-
tors were kept. All features were normalized to 1 to
allow the use of Euclidean distance in the produced
feature space.
2.4 Experiments
We evaluated two approaches for apple classifica-
tion: i) reference-based classification approach and
ii-) three model-based classification approaches, one
based on support vector machine (SVM), one based
on supervised deep neural network and one based on
self-supervised deep neural network. The details are
provided in the following subsections.
Toward Objective Variety Testing Score Based on Computer Vision and Unsupervised Machine Learning: Application to Apple Shape
17
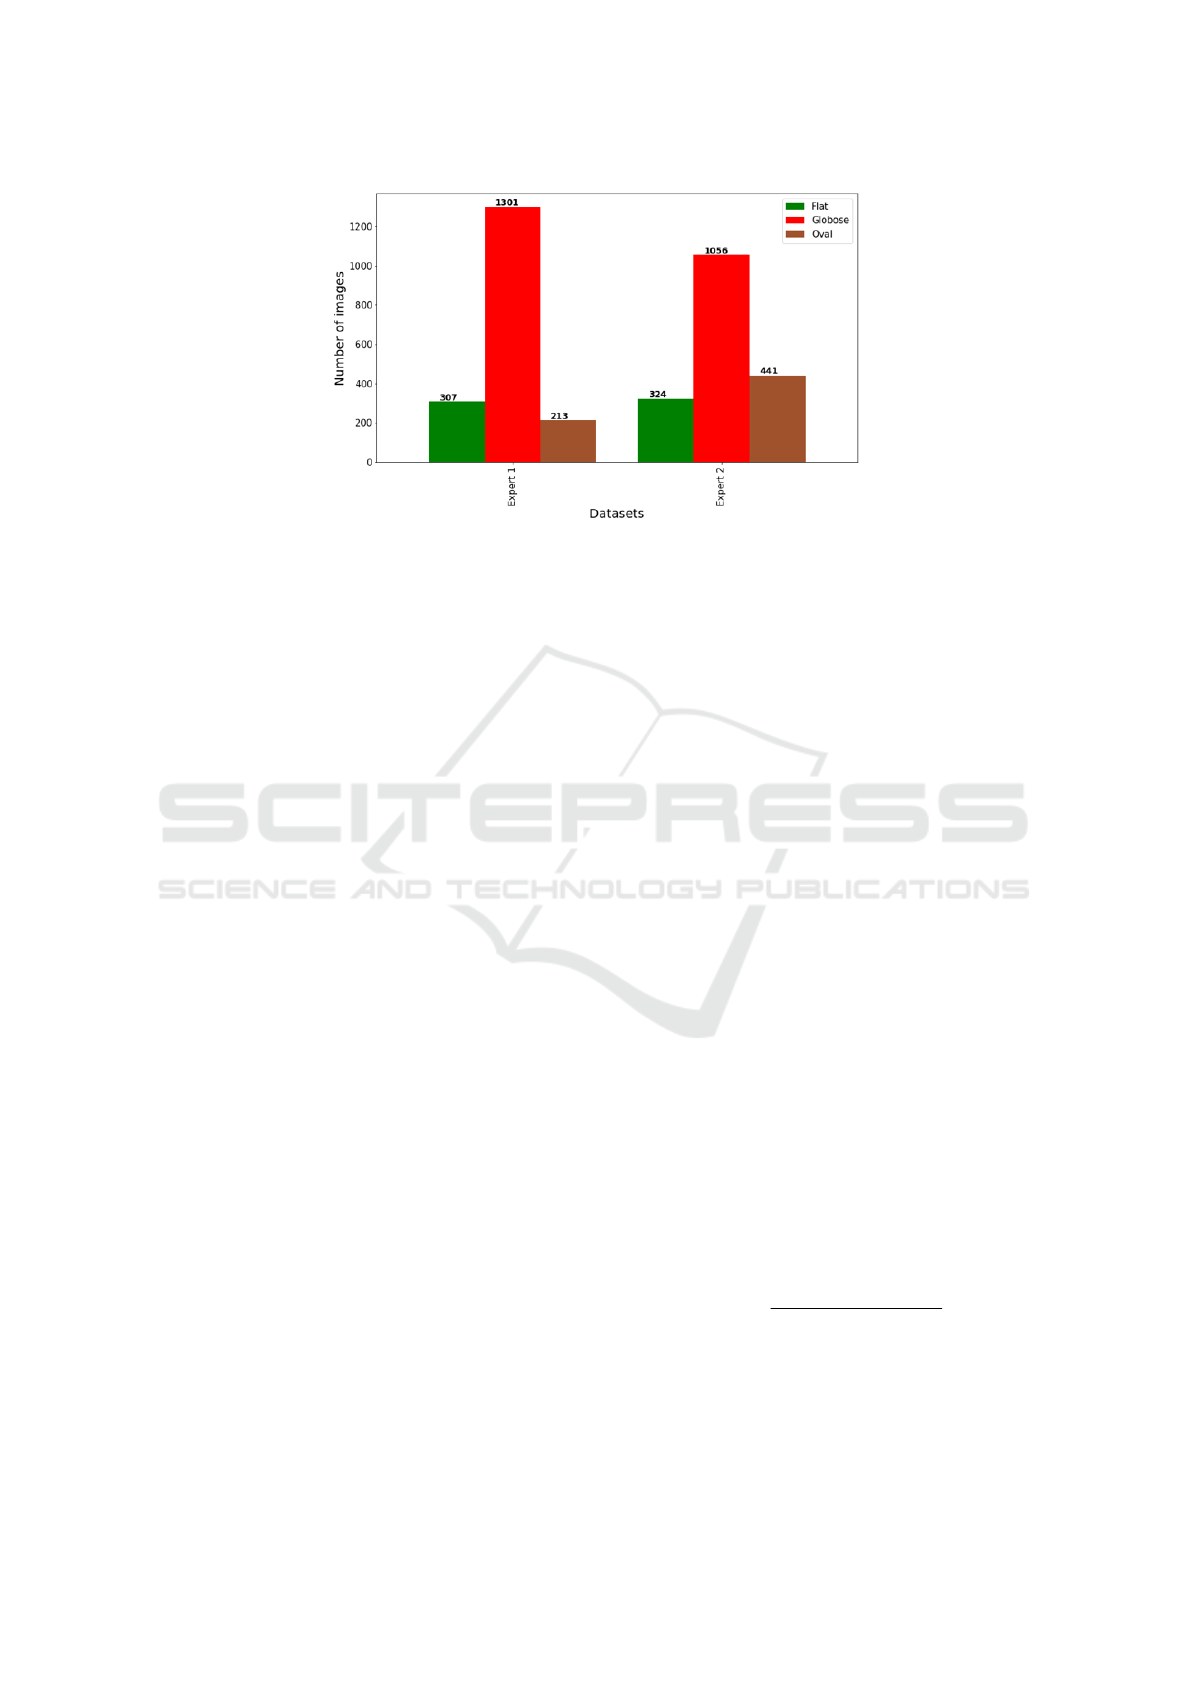
Figure 3: Histogram of the distribution of classes (Flat, Globose and Oval) assigned by experts.
2.4.1 Reference-Based Classification Approach
In this experiment, we mimic the way variety testing
experts use catalogs. We perform a multi-class classi-
fication by computing the Euclidean distance between
features of cut apple query image and features from
a reference instance of each class: one for Flat, one
for Globose and one for Oval. A visual abstract of the
pipeline is given in Fig. (4). Three types of references
were tested i) the original sketches from the official
catalog of ECPGR, ii) the contours from real apples
each representing a class, iii) The ECPGR sketches
rescaled.
First, we considered the original sketches from the
official catalog of ECPGR. As the second option, in-
stead of the sketches provided in a catalog, we consid-
ered the contours of representative apples as reference
shapes. The representative apples are chosen from the
dataset of real apple images. For each class, the apple
with the aspects ratio closest to the class average is se-
lected as the class representative. As the third option,
we modified ECPGR sketches such that the aspect ra-
tio of each reference sketch becomes equal to the cor-
responding class average. This operation bridges the
gap between the aspect ratios of the sketches and the
distribution of the aspect ratio of the apple variety to
be tested.
The average aspect ratio was computed in the fol-
lowing unsupervised way. We assigned the centroids
of each cluster as the class average aspect ratio to the
corresponding class knowing the ordinal relation be-
tween classes. This sorting was obviously not perfect
(otherwise the task would have been done).
2.4.2 Alternative Classification Approaches
In this approach, we do not follow the ECPGR cat-
alog and rather adopt supervised machine learning
techniques. Three models are trained to classify the
shape of images based on a training set composed
of annotated RGB images. Since our goal is not to
claim optimal performances but rather to provide a
comparison with our proposed reference-based ap-
proach, we selected a basic machine learning model
(an SVM with a linear kernel) and two deep learn-
ing algorithms including supervised (Kamilaris and
Prenafeta-Bold
´
u, 2018; Koirala et al., 2019) and self-
supervised deep learning (G
¨
uldenring and Nalpan-
tidis, 2021). The well-known VGG16 (Simonyan and
Zisserman, 2014) and SimSiam (Chen and He, 2021)
models have been implemented for supervised and
self-supervised deep learning models. To quantify
the sensitivity to the choice of the data reserved for
the training, multiple runs of the classification exper-
iment were conducted for various values of the train-
test split of the data set and 10-fold cross-validation.
The average value and standard deviation of the per-
formances of classification were recorded. To quan-
tify the inter-variability between annotating experts,
the experiment was repeated with labels provided by
separated labels provided by the two experts and with
the curated data set containing apples with agreed la-
bels only.
2.4.3 Metric
All the classification experiments were evaluated us-
ing the accuracy metric
ACC =
T P + TN
T P + T N + FP + FN
. (1)
To rely on this metric, the classes Flat, Globose and
Oval, on both experts’ annotated datasets and cured
dataset were balanced with 200 images for each class.
IMPROVE 2024 - 4th International Conference on Image Processing and Vision Engineering
18
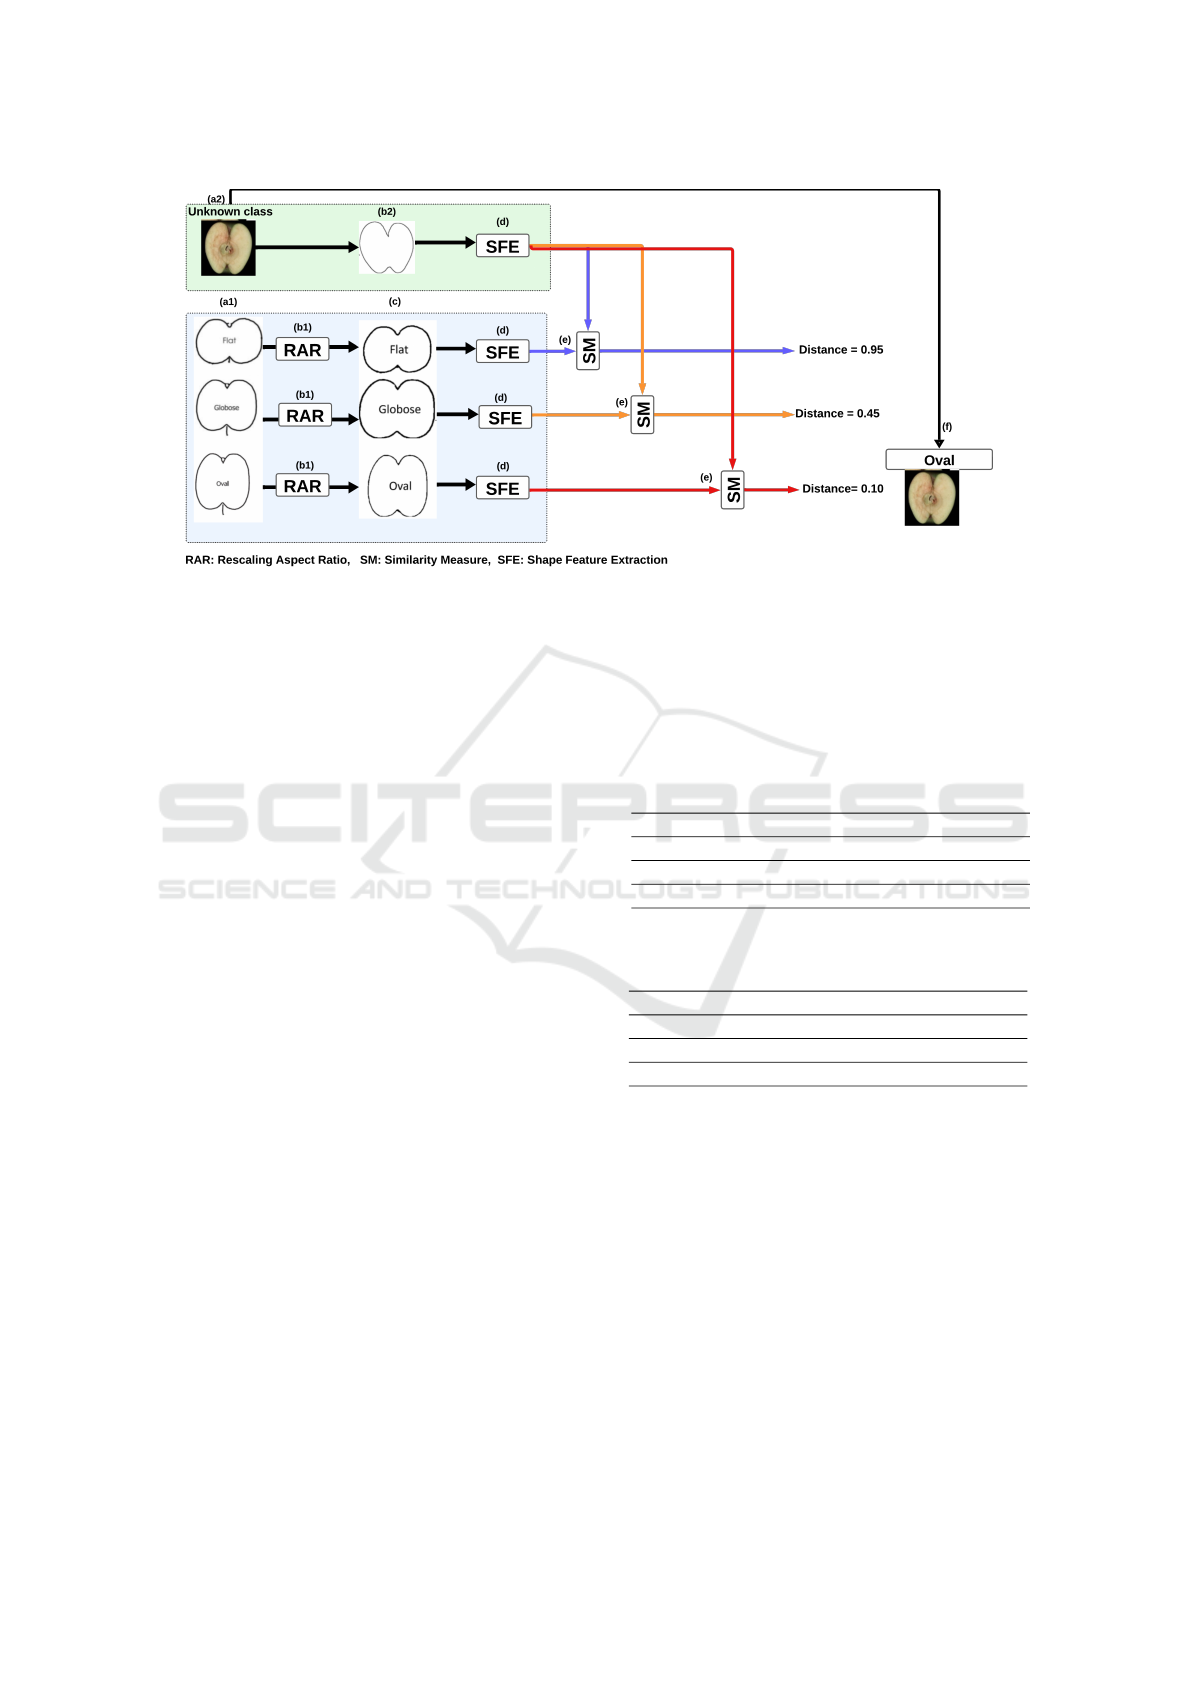
Figure 4: Illustrative pipeline for the Reference-based classification approach: (a1): reference sketches Dataset, (a2): an apple
RGB image to be classified. (b1): rescaling of the aspect ratio of sketches for each class. (b2): edge detection. (c) rescaled
sketches. (d): shape features extraction. (e): similarity measure. (f): classification results; apple RGB image classified based
on the minila distance.
3 RESULTS
3.1 Reference-Based Classification
Approach
Table 1 provides quantitative evaluation of reference-
based approach results. One can observe low accu-
racy when the sketches from the ECPGR catalog are
used as reference. A noticeable improvement of 9
to 13 % of accuracy is brought when these reference
sketches are rescaled. The best performance is ob-
tained when the class representatives are selected as
a reference. However, it is to be noticed that the
gain of performance is only of a 2 to 4 % by com-
parison with the unsupervised rescaling of the official
sketches. The performance culminates at 77% of ac-
curacy when the data are curated. We reproduced the
experiment after withdrawing the intermediate class
Globose. Results given in Table 2 show similar trends
as in Table 1 but with much higher accuracy around
95%. We still observe a gain of 2 to 3% after rescal-
ing the reference sketches of the ECPGR catalog with
our proposed approach.
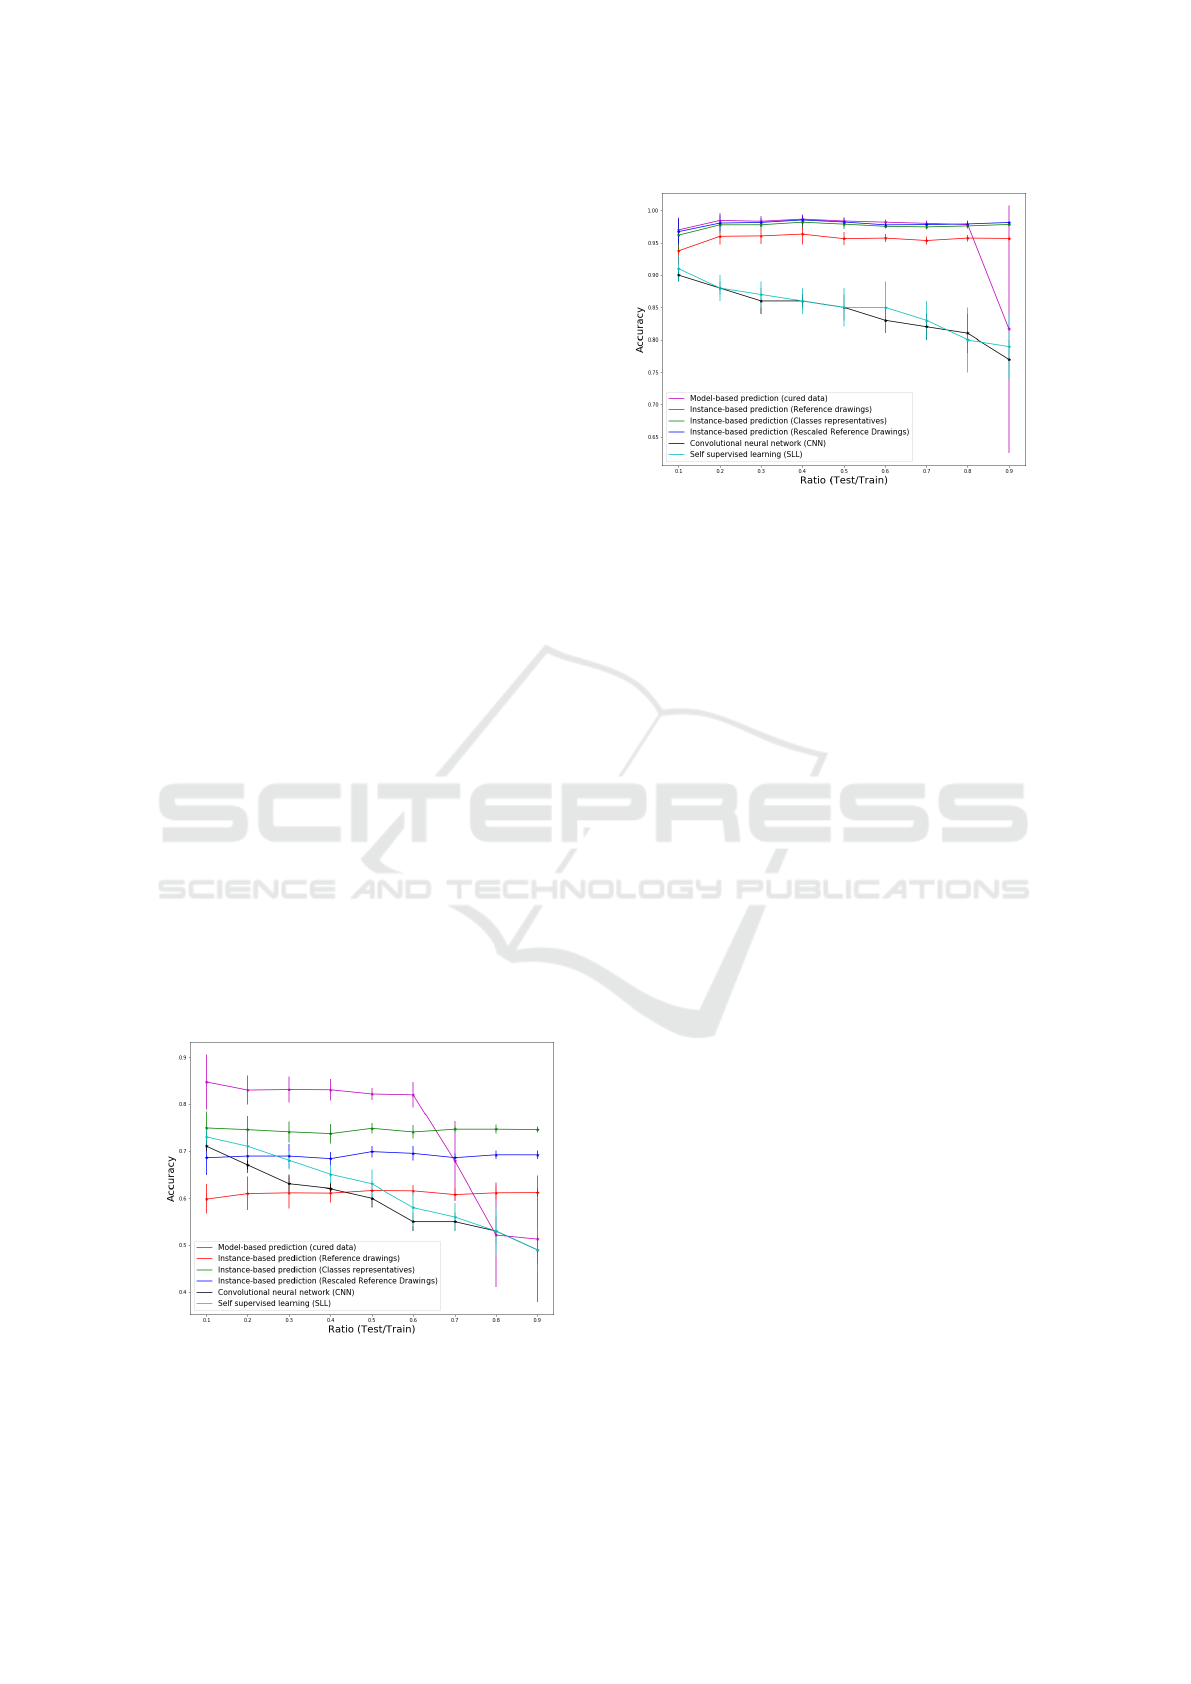
3.1.1 Comparison with Alternative Approaches
Figures 5 shows the performance of the three model-
based approaches as a function of the ratio of the size
of the test set to the size of the training set. As triv-
ially expected, the performances drop progressively
with increasing standard deviation when the amount
Table 1: Measuring accuracy (ACC) of reference-based
approach on expert 1 (E1), expert 2 (R2) and curated
data (CD), to all types of sketches. Ref stands for refer-
ence sketch, Classrep for class representatives sketches and
Rescaled for rescaled reference sketches.
Sketches % ACC
E1
% ACC
E2
% ACC
CD
Ref 58% 55% 60%
Classrep 69% 67% 77%
Rescaled 67% 63% 73%
Table 2: Same as in Table 1 but with only two classes Flat
and Oval.
Sketches % ACC
E1
% ACC
E2
% ACC
CD
Ref 94% 90% 95%
Classrep 97% 96% 98%
Rescaled 97% 95% 97%
of data in the training data set reduces. The plateau
of performance of the SVM-based method for a low
test/training ratio is around 93% for the curated data
sets but drops to around 43% with a huge standard
deviation of 14% when only one instance is kept.
The same behavior could also be seen in the perfor-
mance curved yield by the deep learning and self-
supervised learning approaches. The big gap (around
10% to 20%) in terms of accuracy between the
SVM-based approached and supervised Deep learn-
ing and self-supervised learning approaches shows
that Deep learning and self-supervised learning ap-
proaches are more data-dependent than machine
learning approaches based on handcrafted-features.
Toward Objective Variety Testing Score Based on Computer Vision and Unsupervised Machine Learning: Application to Apple Shape
19
These results should be compared with the reference-
based classification approach explained in the previ-
ous subsection, where only one image per class was
used. It also has to be mentioned that deep learning
and self-supervised learning approaches have a high
computational cost which affects the environment and
global warming. We estimate the amount of carbon
dioxide (CO2) produced by our computing resources
used to execute these two methods (Schmidt et al.,
2021). Our estimation showed that these computa-
tions consumed around 69 kWh, which equaled about
27 kg (59.5 pounds) of CO2 emissions.
The results of predictions on test set of cu-
rated data, using the same model-based approaches
and reference-based approach toward reference
sketches, centers representatives and rescaled refer-
ence sketches, are presented in Fig. 5. It is impor-
tant here to recall that the reference-based approach is
purely unsupervised and therefore fully automatic in
the case of testing of a new variety while the model-
based approach require labor-intensive annotation of
the newly introduced data set.
The performance of the reference-based classifi-
cation is found to be stable with the amount of data
used to compute the rescaling aspect ratio and outper-
forms the SVM-based approach when less than 30%
of the data sets are not annotated. This experiment
was carried out again while withdrawing the inter-
mediate Globose class with similar results shown in
Fig. 6. The difference of plateau of performance be-
tween the SVM-based approach and the reference-
based approach vanishes, and there is here no clear
advantage in annotating the images to train a model.
The current approach based on sketches can directly
be automated with the unsupervised approach pro-
posed in this work.
Figure 5: Prediction curves of test set of curated data via
model-based classification, CNN and SSL and reference-
based classification using reference sketches, centers repre-
sentatives and rescaled reference sketches, after training on
curated dataset.
Figure 6: Same as in Fig. 5 with only two classes Flat and
Oval.
4 DISCUSSION
As illustrated in Fig. (7), variety testing catalogs may
differ from one country to another, as well as between
germplasm curators and breeders, or the sketches of
reference may evolve. This situation may cause dif-
ficulty of comparison of the results over time or even
communication problems between countries not shar-
ing the same references. The instance-based approach
described in this article may actually serve to decipher
this Tour of Babel problem. As shown in Table 3,
we investigated the possibility of automatic transla-
tion of one catalog to another. To this purpose, we
provided the nearest reference sketches to a query ref-
erence sketch from a different catalog.
In Table 3, some catalogs categories are found to
be perfectly matching with each others. In other cases
the designation used in one catalog does not match
with the designation of another catalog. This shape-
based translation based on pure objective features en-
ables to overcome the semantic gap that the multi-
plicity of catalogs may cause. Consequently, our ap-
proach may not only be used to provide an objective
tool conforming the current variety testing practices,
it can also be used when judgements based on dif-
ferent visual references need to be shared. It is here
again important to stress that this translation from one
catalog of reference to another, would not be directly
accessible with supervised machine learning. Indeed
this would require to train models with annotation
provided by experts using different catalogs. Then it
would require to compare this subjective rating result
on testing data. By contrast with the unsupervised
instance-based model proposed in this article, trans-
lation from one catalog to another is almost instanta-
neous since only the objective similarity between ref-
erence sketches need to be computed.
IMPROVE 2024 - 4th International Conference on Image Processing and Vision Engineering
20
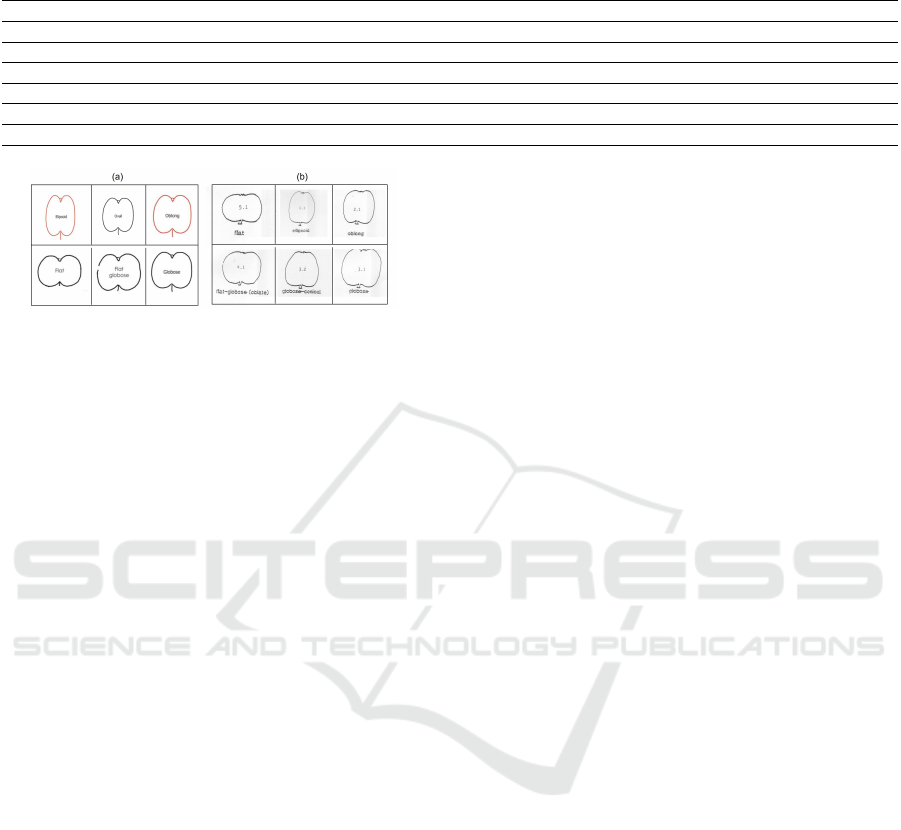
Table 3: Translation between variety testing catalogs. Each line provides K nearest neighbors (K = 6) in the Upov Catalog of
query sketches from ECPRG Catalog. The first column gives the query sketches.
ECPGR Catalog Upov Catalog
Flat Flat Oblate Globose-Canonical Ellipsoid Oblong Globose
Globose Globose Globose-Canonical Ellipsoid Oblong Oblate Flat
Oval Globose Ellipsoid Oblong Globose-Canonical Oblate Flat
Ellipsoid Oblong Ellipsoid Globose-Canonical Globose Oblate Flat
Flat-Globose Oblate Flat Ellipsoid Globose-Canonical Oblong Globose
Oblong Globose Oblong Globose-Canonical Oblate Ellipsoid Flat
Figure 7: Two different variety testing catalogs. (a): Cat-
alog delivered by The European Malus GERMPLASM
Workshop (ECPGR 2009). (b): Catalog delivered by UPOV
(2006).
5 CONCLUSION
In this article, we have demonstrated the possibil-
ity of using reference sketches in a variety testing
catalog, to help the transition from pure manual in-
spection toward automated computational practices.
The sketches can serve as references for quantita-
tive matching to classify images of plant instances.
Rescaling of the aspect ratio of the reference sketches
was shown to be helpful to boost the performances of
classification. Reference-based approach was shown
to be better suited in variety testing as compared to su-
pervised machine learning approaches since the later
requires intensive manual annotation and therefore
brings no gain of efficiency to the current practice of
manual inspection. This work opens several perspec-
tives. Although the proposed methodology was illus-
trated on apple shape evaluation in variety testing, it
could be extended to any of variety testing traits as-
sociated with reference sketches of the official cata-
logs. Some sketches in variety testing correspond to
3D rendered views. In this case the correspondence
with the 2D images would not be as direct as in this
article. It would require to first acquire a set of images
in 3D view and then find the best match with the pose
of the reference sketch in the catalogue. Concerning
apple, we followed the official protocol and operated
with freshly cut apples. It would be interesting to re-
produce the experiment with uncut apples to find if
the variety testing protocol could be adapted uncut
apples for faster and non destructive characterization.
On the side of artificial intelligence, we demonstrated
the limits of state of the art convolutional neural net-
work either in supervised or self-supervised learning
for limited data set size by comparison with our ap-
proach. It would be interesting to extend the compar-
ison with the recently introduced foundation models
which are expected to perform better with few or even
zero -shot learning.
ACKNOWLEDGEMENTS
We thank Enrique Dapena and Maria Mercedes Fer-
nandez for their contribution in the experienced an-
notation of apple images. CD was partially sup-
ported by the Horizon 2020 Framework Program
of the European Union under grant agreement No
817970 (project INVITE: Innovations in plant vari-
ety testing in Europe to foster the introduction of
new varieties better adapted to varying biotic and abi-
otic conditions and to more sustainable crop man-
agement practices) and by “DON CARLOS AN-
TONIO LOPEZ” Abroad Postgraduate Scholarship
Program, BECAL-Paraguay. We acknowledge sup-
port from the CERCA Programme (“Generalitat de
Catalunya”), and the “Severo Ochoa Programme for
Centres of Excellence” 2016-2019 (SEV-2015-0533)
and 2020-2023 (CEX2019-000902-S) both funded by
MCIN/AEI /10.13039/501100011033.
REFERENCES
Benos, L., Tagarakis, A. C., Dolias, G., Berruto, R., Kateris,
D., and Bochtis, D. (2021). Machine learning in agri-
culture: A comprehensive updated review. Sensors,
21(11):3758.
Bhargava, A. and Bansal, A. (2021). Fruits and vegetables
quality evaluation using computer vision: A review.
Journal of King Saud University-Computer and Infor-
mation Sciences, 33(3):243–257.
Cao, Q., Yang, G., Wang, F., Chen, L., Xu, B., Zhao,
C., Duan, D., Jiang, P., Xu, Z., and Yang, H.
(2022). Discrimination of tea plant variety using in-
situ multispectral imaging system and multi-feature
analysis. Computers and Electronics in Agriculture,
202:107360.
Toward Objective Variety Testing Score Based on Computer Vision and Unsupervised Machine Learning: Application to Apple Shape
21

Chen, X. and He, K. (2021). Exploring simple siamese rep-
resentation learning. In Proceedings of the IEEE/CVF
Conference on Computer Vision and Pattern Recogni-
tion, pages 15750–15758.
Couasnet, G., El Abidine, M. Z., Laurens, F., Dutagaci, H.,
and Rousseau, D. (2021). Machine learning meets
distinctness in variety testing. In Proceedings of the
IEEE/CVF International Conference on Computer Vi-
sion, pages 1303–1311.
Dhanya, V., Subeesh, A., Kushwaha, N., Vishwakarma,
D. K., Nagesh Kumar, T., Ritika, G., and Singh, A.
(2022). Deep learning based computer vision ap-
proaches for smart agricultural applications. Artificial
Intelligence in Agriculture, 6:211–229.
El Abidine, M. Z., Merdinoglu-Wiedemann, S., Rasti, P.,
Dutagaci, H., and Rousseau, D. (2020). Machine
learning-based classification of powdery mildew
severity on melon leaves. In International Confer-
ence on Image and Signal Processing, pages 74–81.
Springer.
Garbouge, H., Rasti, P., and Rousseau, D. (2021a). Deep
learning-based detection of seedling development
from indoor to outdoor. In International Confer-
ence on Systems, Signals and Image Processing, pages
121–131. Springer.
Garbouge, H., Rasti, P., and Rousseau, D. (2021b). Enhanc-
ing the tracking of seedling growth using rgb-depth
fusion and deep learning. Sensors, 21(24):8425.
Ghazal, S., Qureshi, W. S., Khan, U. S., Iqbal, J., Rashid,
N., and Tiwana, M. I. (2021). Analysis of visual
features and classifiers for fruit classification prob-
lem. Computers and Electronics in Agriculture,
187:106267.
G
¨
uldenring, R. and Nalpantidis, L. (2021). Self-supervised
contrastive learning on agricultural images. Comput-
ers and Electronics in Agriculture, 191:106510.
Hu, C., Li, D., Song, Y.-Z., Xiang, T., and Hospedales,
T. M. (2018). Sketch-a-classifier: Sketch-based photo
classifier generation. In Proceedings of the IEEE con-
ference on computer vision and pattern recognition,
pages 9136–9144.
Ireri, D., Belal, E., Okinda, C., Makange, N., and Ji, C.
(2019). A computer vision system for defect discrim-
ination and grading in tomatoes using machine learn-
ing and image processing. Artificial Intelligence in
Agriculture, 2:28–37.
Ishikawa, T., Hayashi, A., Nagamatsu, S., Kyutoku, Y.,
Dan, I., Wada, T., Oku, K., Saeki, Y., Uto, T., Tan-
abata, T., et al. (2018). Classification of straw-
berry fruit shape by machine learning. International
Archives of the Photogrammetry, Remote Sensing &
Spatial Information Sciences, 42(2).
Jana, S. and Parekh, R. (2017). Shape-based fruit recog-
nition and classification. In International Conference
on Computational Intelligence, Communications, and
Business Analytics, pages 184–196. Springer.
Jung, M., Roth, M., Aranzana, M. J., Auwerkerken, A.,
Bink, M., Denanc
´
e, C., Dujak, C., Durel, C.-E., i For-
cada, C. F., Cantin, C. M., et al. (2020). The apple
refpop—a reference population for genomics-assisted
breeding in apple. Horticulture research, 7(1):1–16.
Kamilaris, A. and Prenafeta-Bold
´
u, F. X. (2018). Deep
learning in agriculture: A survey. Computers and elec-
tronics in agriculture, 147:70–90.
Kheiralipour, K. and Pormah, A. (2017). Introducing new
shape features for classification of cucumber fruit
based on image processing technique and artificial
neural networks. Journal of food process engineering,
40(6):e12558.
Koirala, A., Walsh, K. B., Wang, Z., and McCarthy, C.
(2019). Deep learning–method overview and review
of use for fruit detection and yield estimation. Com-
puters and electronics in agriculture, 162:219–234.
Koklu, M., Cinar, I., and Taspinar, Y. S. (2021). Clas-
sification of rice varieties with deep learning meth-
ods. Computers and electronics in agriculture,
187:106285.
Kuhl, F. P. and Giardina, C. R. (1982). Elliptic fourier fea-
tures of a closed contour. Computer graphics and im-
age processing, 18(3):236–258.
Li, S., Luo, H., Hu, M., Zhang, M., Feng, J., Liu, Y., Dong,
Q., and Liu, B. (2019). Optical non-destructive tech-
niques for small berry fruits: A review. Artificial In-
telligence in Agriculture, 2:85–98.
Li, Z., Guo, R., Li, M., Chen, Y., and Li, G. (2020). A
review of computer vision technologies for plant phe-
notyping. Computers and Electronics in Agriculture,
176:105672.
Mahlein, A.-K. (2016). Plant disease detection by imag-
ing sensors–parallels and specific demands for preci-
sion agriculture and plant phenotyping. Plant disease,
100(2):241–251.
Meng, Y., Ma, Z., Ji, Z., Gao, R., and Su, Z. (2022). Fine
hyperspectral classification of rice varieties based on
attention module 3d-2dcnn. Computers and Electron-
ics in Agriculture, 203:107474.
Pathan, M., Patel, N., Yagnik, H., and Shah, M. (2020).
Artificial cognition for applications in smart agricul-
ture: A comprehensive review. Artificial Intelligence
in Agriculture, 4:81–95.
Schmidt, V., Goyal, K., Joshi, A., Feld, B., Conell, L.,
Laskaris, N., Blank, D., Wilson, J., Friedler, S., and
Luccioni, S. (2021). CodeCarbon: Estimate and Track
Carbon Emissions from Machine Learning Comput-
ing.
Simonyan, K. and Zisserman, A. (2014). Very deep con-
volutional networks for large-scale image recognition.
arXiv preprint arXiv:1409.1556.
Szeliski, R. (2022). Computer vision: algorithms and ap-
plications. Springer Nature.
Zhang, X., Li, X., Liu, Y., and Feng, F. (2019). A survey on
freehand sketch recognition and retrieval. Image and
Vision Computing, 89:67–87.
Zine-El-Abidine, M., Dutagaci, H., Galopin, G., and
Rousseau, D. (2021). Assigning apples to individual
trees in dense orchards using 3d colour point clouds.
Biosystems Engineering, 209:30–52.
IMPROVE 2024 - 4th International Conference on Image Processing and Vision Engineering
22
