
An Extensive Analysis of Data Clumps in UML Class Diagrams
Nils Baumgartner and Elke Pulverm
¨
uller
Software Engineering Research Group, School of Mathematics/Computer Science/Physics,
Osnabr
¨
uck University, 49090, Osnabr
¨
uck, Germany
Keywords:
Design Smell, Code Smell Dataset, Class Diagram, Data Clumps, Code Analysis, Reporting Format.
Abstract:
This study investigated the characteristics of data clumps in UML class diagrams. Data clumps are group of
variables which appear together in multiple locations. In this study we compared the data clumps character-
istics in UML class diagrams with them of source code projects. By analyzing the extensive Lindholmen and
GenMyModel datasets, known for their real–world applicability, diversity, and containing more than 100,000
class diagrams in total, significant differences in the distribution and nature of data clumps were revealed.
Approximately 19 % of the analyzed class diagrams contained data clumps. It was observed that field–field
data clumps predominated in UML class diagrams, particularly in the GenMyModel dataset, while parame-
ter–parameter data clumps were less frequent. Moreover, in contrast to the distribution in source code projects,
data clumps in UML class diagrams were typically distributed across multiple classes or interfaces, forming
larger chains. parameter–parameter data clumps were predominant in source code projects, indicating more
detailed implementation of methods in these projects. These findings reflect different modeling approaches
and paradigms among the respective user groups. This study has provided important insights regarding the
development of UML modeling tools, teaching methods, and design practices in software development.
1 INTRODUCTION
Software development is inherently versatile and
manifests in multiple forms, including the traditional
approach of source code development and the increas-
ingly prevalent method of graphical representation.
The latter, particularly significant, involves the graph-
ical conceptualization of software design. One of the
primary tools employed in this approach is the Uni-
fied Modeling Language (UML), a standardized mod-
eling language that provides a comprehensive frame-
work for visualizing the design and architecture of
software systems and helps to improve software qual-
ity (Nugroho and Chaudron, 2009). UML class dia-
grams, a component of this language, enable develop-
ers to depict the structure of a system by illustrating
its classes, their attributes, operations, and the rela-
tionships among objects.
Relevance. From a scientific perspective, UML class
diagrams are the most commonly used diagrams in
publications, at 26 % (Koc¸ et al., 2021). The adop-
tion of UML class diagrams in software design under-
scores the importance of a robust and effective design
strategy, as experiments have shown that the use of
UML models can filter out misinterpretations (Chau-
dron et al., 2012). This concern is not merely a the-
oretical one but also a practical necessity, as subopti-
mal design choices can lead to increased development
time, complexity in integrating new team members,
and escalated maintenance costs (Alkharabsheh et al.,
2019). A realistic empirical evaluation of the cost
and benefits of the use of UML documentation dur-
ing maintenance found that a 54 % increase in func-
tional correctness was achieved at the expense of a
14 % overhead from the development time of updat-
ing the UML documentation (Dzidek et al., 2008).
Therefore, a well–conceived design is instrumental
in leveraging the available resources to their full po-
tential, emphasizing the critical need to identify and
rectify design flaws at the earliest stages. In addition
to beta testing, modeling or prototyping can increase
the effectiveness of defect detection, at levels ranging
from 36 % up to 64 % (Chaudron et al., 2012).
A significant challenge in this context is the pres-
ence of “design smells,” a term denoting indicators of
potential issues within the software design that could
evolve into more serious problems later. Among var-
ious smells, data clumps have emerged as a note-
worthy concern (Arendt and Taentzer, 2013). Data
clumps, in simpler terms, refer to groups of data or
variables that frequently occur together across various
Baumgartner, N. and Pulvermüller, E.
An Extensive Analysis of Data Clumps in UML Class Diagrams.
DOI: 10.5220/0012550500003687
Paper published under CC license (CC BY-NC-ND 4.0)
In Proceedings of the 19th International Conference on Evaluation of Novel Approaches to Software Engineering (ENASE 2024), pages 15-26
ISBN: 978-989-758-696-5; ISSN: 2184-4895
Proceedings Copyright © 2024 by SCITEPRESS – Science and Technology Publications, Lda.
15

parts of a project (Fowler et al., 1999). Data clumps,
further elaborated by (Zhang et al., 2008), have a rec-
ognizable although modest impact on the propensity
for faults within software systems (Hall et al., 2014).
Traditionally associated with the code level, the oc-
currence of data clumps in UML class diagrams has
not been thoroughly explored, representing a gap in
the current body of research (Baumgartner and Pul-
verm
¨
uller, 2024).
Goal. Our study aimed to bridge this knowledge gap
by focusing specifically on data clumps within UML
class diagrams. Most studies in this field have primar-
ily concentrated on identifying design smells within
software source code. However, a limited number
of papers have extended this detection to UML dia-
grams, including class and communication diagrams,
as well as to binary code, ontology, and test cases
(Alkharabsheh et al., 2019). Although these stud-
ies have acknowledged the presence of data clumps
in UML diagrams, they have primarily explored their
correlations with various attributes of software quality
without providing quantitative data or detailed numer-
ical analysis. To address this deficiency, we proposed
two central research questions:
• RQ1. What are the characteristics of data clumps
in UML class diagrams?
• RQ2. How do these characteristics in UML class
diagrams compare to those observed at the code
level?
To answer these questions, our methodology in-
volved a comprehensive examination of a substan-
tial corpus of UML class diagrams. We aimed for
a sample size exceeding 1,000 diagrams to ensure a
robust and statistically significant quantitative analy-
sis. These diagrams, sourced from a variety of pub-
lic repositories, represented a diverse range of project
sizes and complexities. This diversity allowed for a
more generalizable and comprehensive understanding
of the prevalence and nature of data clumps in UML
class diagrams. We analyzed UML class diagrams ex-
pressed in machine–readable formats such as Exten-
sible Markup Language (XML) and XML Metadata
Interchange (XMI), rather than image formats, to en-
sure precision and maintain accuracy in our analysis.
The analysis was conducted using criteria for identi-
fying data clumps as defined by (Baumgartner et al.,
2023), ensuring a standardized and rigorous approach
to our investigation.
Contributions. This paper offers the following sig-
nificant contributions:
• 1) A comprehensive case study providing both
quantitative and qualitative insights into data
clumps within UML class diagrams
• 2) Identification of new characteristics of data
clumps specific to UML class diagrams as well
as in comparison to those found in source code
projects
• 3) Enhancement of a publicly available dataset re-
lated to data clumps, augmented with detection re-
sults and sources from UML class diagrams
• 4) Enhancement of an existing tool to analyze
data clumps under conditions of uncertainty, such
as incomplete information scenarios
Organization. Section 2 presents essential back-
ground information relevant to this research, includ-
ing a detailed exploration of data clumps and an
overview of UML. Section 3 explores related work,
providing a thorough examination of the literature and
detailing the sources used for our analysis. Section
4 describes our methodological approach, explaining
how we analyzed the data and generated our find-
ings. Section 5 presents a discussion of these find-
ings, drawing insights and conclusions from our anal-
ysis. Section 6 critically examines potential threats
to the validity of our findings, ensuring a reflective
perspective. Finally, Section 7 concludes the report,
summarizing our key findings and contributions to the
field of software design and development in the field
of data clumps in UML class diagrams.
2 BACKGROUND
This section provides foundational background in-
formation crucial for understanding the context and
methodology of our study. In Section 2.1, we present
the background of UML (Unified Modeling Lan-
guage) class diagrams, which may be a familiar con-
cept to many readers, with a focus on their represen-
tation through XML and XMI formats. Section 2.2
is devoted to a comprehensive introduction to data
clumps, a particular type of design smell within soft-
ware development.
2.1 UML Class Diagrams
The Unified Modeling Language (UML) is a key tool
in software development for graphically represent-
ing software specifications and documentation. It has
been standardized by the International Organization
for Standardization (International Organization for
Standardization, 2014), highlighting its importance
ENASE 2024 - 19th International Conference on Evaluation of Novel Approaches to Software Engineering
16

in the field. Various software tools, such as Visual
Paradigm (Visual Paradigm, 2002), Eclipse (Eclipse
Foundation, 2023), and IntelliJ (JetBrains, 2023) pro-
vide capabilities for creating UML diagrams. UML
assists the understanding of complex systems through
simplified models and is used extensively from the
initial definition to the final stages of software imple-
mentation (Ho-Quang et al., 2017).
UML class diagrams, a fundamental aspect of this
language, provide insights into a system’s structure
by representing classes, attributes, methods, and their
relationships. While these diagrams effectively illus-
trate relationships such as dependencies and associa-
tions, they may not always align precisely with pro-
gramming language constructs, potentially leading to
discrepancies.
In terms of file formats, UML class diagrams are
commonly found in image formats such as JPEG and
PNG for clarity and ease of use. For deeper analysis,
formats such as XMI (XML Metadata Interchange) or
XML are preferred; XMI is particularly notable for its
interoperability and vendor neutrality, as recognized
by the Object Management Group (International Or-
ganization for Standardization, 2014). The XMI ex-
cerpt in Listing 1 details a UML class diagram for
a basic class named Person. This representation in-
cludes the attributes of name (type “String”) and age
(without a given type) and the operation getInfo().
The format precisely captures the structure and ele-
ments of the Person class, demonstrating how UML
diagrams are translated into a machine–readable for-
mat that is compatible with various modeling and de-
velopment tools. It is noteworthy that information
such as type is not always provided in real–world sce-
narios (Chren et al., 2019). While the XMI format,
as illustrated by Listing 1, provides a structured and
machine–readable representation of UML class dia-
grams, it is in the analysis of these diagrams that con-
cepts such as data clumps become particularly rele-
vant.
Listing 1: Excerpt of a UML class diagram in XMI format.
<?xml version="1.0" encoding= ...>
<uml:Model xmi:version="2.0" ... >
<packagedElement
xmi:type="uml:Class"
xmi:id="Person" name="Person">
<ownedAttribute name="name"
type="String"/>
<ownedAttribute name="age" />
<ownedOperation
xmi:id="getInfo"
name="getInfo">
...
</ownedOperation>
</packagedElement>
</uml:Model>
2.2 Data Clumps
Data clumps represent an important concept that can
significantly impact the structure and quality of code
in the context of software development. First identi-
fied by Martin Fowler in 1999, data clumps are classi-
fied as a type of “code smell.” Code smells are not nec-
essarily errors in themselves but often indicate deeper
problems within a project. These issues affect the
code’s structure and can manifest in various forms and
variations (Fowler et al., 1999)
While some code smells can be attributed to spe-
cific lines of code, others, known as design smells,
emerge from higher abstraction levels, reflecting poor
design decisions in a software project. The term
“design smell” is derived from the concept of code
smells, indicating that a design smell is the result of
poor design choices. However, the boundary between
design smells and code smells is not always distinct.
Arendt and Taenzer have categorized data clumps as
both a code smell and a design smell, highlighting
their dual nature (Arendt and Taentzer, 2013).
Data clumps belong to the family of “Bloaters,”
which are problems that gradually grow over time,
making the code harder to maintain, read, and test
(Jerzyk and Madeyski, 2023). Bloaters do not imme-
diately restrict work but gradually make the project
more cumbersome, similar to chewing gum. Common
Bloater family members include Long Method, Large
Class, and Long Parameter List. Martin Fowler fa-
mously described data clumps as groups of items that
“tend to be like children: They enjoy hanging around
together” (Fowler et al., 1999).
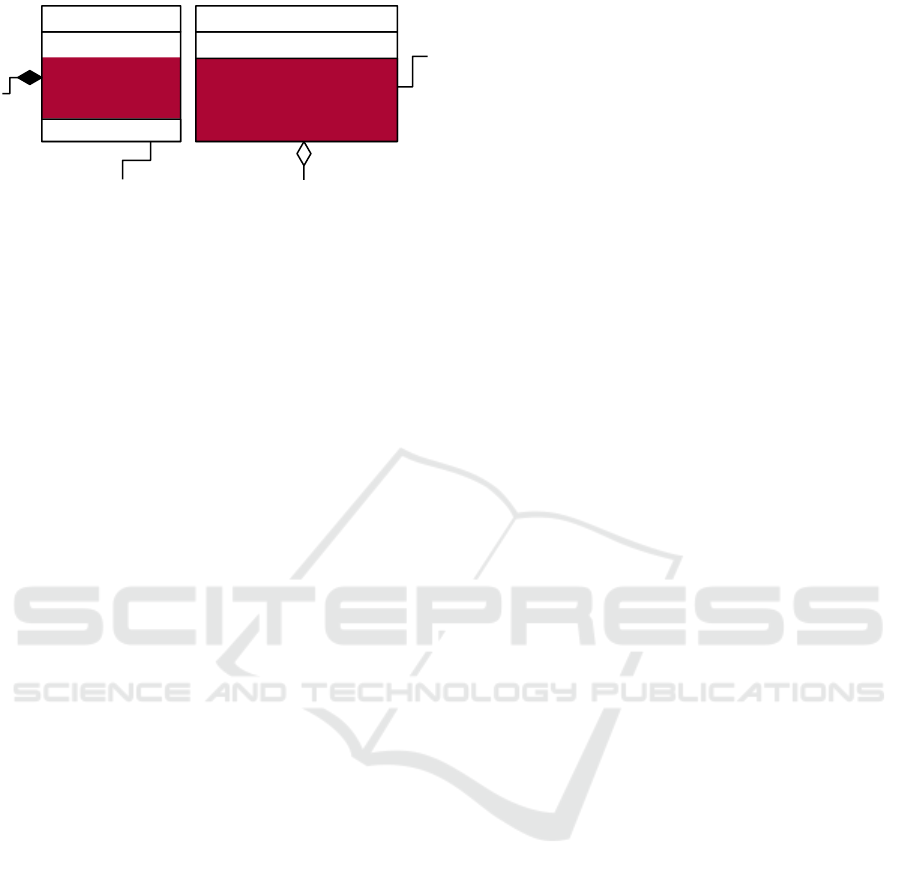
As an example of data clumps in the context of
class diagrams, an excerpt of a class diagram for a
simple online shopping application is depicted in Fig-
ure 1 There are classes such as Order and Product.
A data clump might occur if multiple classes repeat-
edly use a group of variables such as name, street, and
zip (highlighted in blue). These variables are often
passed together through various methods and classes,
suggesting that they might be better encapsulated as a
single object. This encapsulation would simplify the
interaction between classes and improve the code’s
overall structure and readability. Such an example il-
lustrates how data clumps can manifest in class dia-
grams as well as the potential benefits of addressing
them. In the example shown, the methods of Order
would use Product as a parameter object.
An Extensive Analysis of Data Clumps in UML Class Diagrams
17
vendor: Vendor
name: String
street: String
zip: int
Product Order
customer: Customer
buy(name: String, street:
String, zip: int, amount: int)
ship(country: String,
street: String, zip: int)
Figure 1: Example of data clumps in an UML class dia-
gram.
The broad definition of Martin Fowler has led
other authors (Zhang et al., 2008; Hall et al., 2014;
Baumgartner et al., 2023) to provide more precise
definitions, particularly regarding the automatic de-
tection and resolution of data clumps. The groups of
variables do not necessarily appear in the same order,
and additional variables may be present. These vari-
ables should be of the same type, although (Zhang
et al., 2008) also indicate that variables with similar
names and types could form a data clump. However,
for simplicity in automated approaches, this aspect is
often not considered. These variable groups appear
together in different code parts.
2.2.1 Types of Data Clumps
Data clumps may be categorized into three distinct
types, as refined by Zhang et al. (2008) and later by
Baumgartner and Pulverm
¨
uller (2024):
• Parameter–Parameter. This type involves the
same variables appearing across various method
parameters in different methods.
• Field–Field. In this type, identical variables ap-
pear as attributes in different classes.
• Parameter–Field. In this type, a group of method
parameters could be replaced with a class object
in which the variables are consolidated as attribute
fields of that class.
2.2.2 Types of Data Clump Clusters
Baumgartner et al. (2023) have conducted an ini-
tial taxonomy of data clumps, categorizing them into
specific cluster types (Baumgartner and Pulverm
¨
uller,
2024). This classification assists in understanding the
nature and complexity of data clumps in various soft-
ware systems. They differentiate among three main
types of clusters:
• Cluster Type 1. This type involves a scenario in
which a class or interface is isolated, meaning that
it does not have any connections to other classes
or interfaces through data clumps. It represents a
standalone entity in terms of data clumps.
• Cluster Type 2. In this type, exactly two classes
or interfaces are connected solely to each other
through data clumps. This type indicates a direct,
exclusive relationship between the two entities re-
garding their shared data clumps.
• Cluster Type 3. This type is characterized by
more than two classes or interfaces being con-
nected directly or indirectly through data clumps.
It represents a more complex network of relation-
ships and interactions facilitated by data clumps,
indicating a broader scope of interconnectedness
within the software system.
3 RELATED WORK
This section explores related work in the field of
data clumps and UML diagrams, focusing on studies
that utilized or generated the Lindholmen and Gen-
MyModel datasets, which aligned with our method-
ological criteria. Additionally, it identifies potential
sources for further investigations described in subse-
quent sections.
Data clumps in software projects have been ex-
amined by (Baumgartner and Pulverm
¨
uller, 2024),
who overcame the challenge of scarce datasets by de-
veloping a tool to analyze artifacts, such as source
code, that must be parsed into an abstract syntax
tree. These authors discovered that data clumps typi-
cally form clusters, complicating manual refactoring.
The study introduced a unified reporting format for
data clumps, and its findings, based on the analysis
of approximately 450,000 data clumps across seven
projects, indicated the predominant presence of pa-
rameter–parameter data clumps (93 %). Baumgart-
ner et al. studied Java projects, analyzing older ones
for up to 25 years and newer ones for 4 years, to
understand the evolution of data clumps in software
development over time. Baumgartner et al. also ad-
dress a potential area for future research to further ex-
amine UML diagrams based on the work of Robles,
Ho–Quang, Hebig, Chaudron and Fern
´
andez (2017).
A comprehensive examination of GitHub projects
with a focus on UML diagrams was undertaken by
(Robles et al., 2017). They had noted the lack of
an extensive, publicly accessible dataset of UML
diagrams, which motivated their goal to compile a
dataset of UML files, complete with metadata from
the software projects to which these UML files be-
longed. In their study, they systematically analyzed
over 12 million GitHub projects to identify UML
files. They further developed a semi–automated ap-
proach for collecting UML data stored in image for-
mats as well as in XMI and UML files, thereby ad-
ENASE 2024 - 19th International Conference on Evaluation of Novel Approaches to Software Engineering
18

dressing a significant gap in the availability of UML
resources. Their efforts culminated in the genera-
tion of a dataset featuring over 93,000 UML diagrams
drawn from more than 24,000 projects on GitHub.
This remarkable collection, known as the Lindhol-
men dataset,
1
, has provided a valuable resource for
researchers and practitioners in the field.
Further research leveraging the Lindholmen
dataset includes work such as that performed by (Ho-
Quang et al., 2017). They investiaged the prac-
tices and perceptions of the use of UML in open
source projects, particularly for safety–critical soft-
ware. Conducting a survey among developers from
458 open–source projects, Ho–Quang et al. gath-
ered 485 responses to understand the role of UML
and its impact on project collaboration and integra-
tion. Their key findings include that 65 % of respon-
dents found UML helpful for new contributors, indi-
cating its significance in onboarding and team com-
munication. The study further revealed that the main
motivation for using UML was to facilitate collabo-
ration, beneficial for both experienced members and
those not creating models. However, it did not dif-
ferentiate between UML diagram types. Overall, this
research has provided insights into UML’s practical
applications in enhancing teamwork and project ef-
fectiveness in open–source software development.
Common practices in the use of UML class dia-
grams were studied by (Savary-Leblanc et al., 2022),
who analyzed over 100,000 UML class diagrams
from GenMyModel
2
to understand common practices
in diagram creation and editing. This report, signifi-
cant to model–based software engineering, presents
general trends in UML class diagram composition,
including element types, usage frequency, name for-
matting, placement, and coloring. Analyzing 159,000
XMI files, the team identified 106,000 UML class di-
agrams from over 26,000 authors. They found that
90 % of the diagrams included classes with attributes,
operations, and relationships. Furthermore, 86 % of
diagrams contained attributes, 67 % included opera-
tions, and 10 % had neither. This research has pro-
duced valuable insights into UML class diagram prac-
tices, highlighting prevalent trends and potential areas
for tool adaptation and further study in software engi-
neering.
The layout quality of UML class diagrams were
studied by (Bergstr
¨
om et al., 2022), who published
also their labeled dataset. This dataset offers a unique
combination of manually verified ground truths re-
garding diagram layout quality, classifier–predicted
layout quality values, and key layout features ex-
1
available at http://models-db.com/
2
available at: http://app.genmymodel.com
tracted via image processing. However, it is important
to note that this dataset contains only images and does
not include actual UML file formats such as XML or
XMI. Due to this limitation in format, the dataset may
not be suitable for research requiring detailed data
representations in model–based analysis. Thus, while
valuable for specific types of studies, this resource
may not align with methodologies that necessitate the
precision and detail provided by standard UML file
formats.
An automated method for deriving UML class di-
agrams from natural language specifications has been
outlined by (Yang and Sahraoui, 2022). However,
this approach yields low precision and recall, primar-
ily serving as a foundation for future research rather
than a practical data source. Consequently, it was not
deemed suitable for the requirements of our analysis;
in addition, no downloadable dataset was found.
An analysis of student projects in a software en-
gineering course was performed by (Chren et al.,
2019). Over a 12–week period, students submitted
2,700 UML diagrams as part of their coursework.
This study encompassed various types of UML dia-
grams created by 123 students. After their inquiry,
the authors confirmed that the data was only avail-
able in image formats, a condition that was not suit-
able for our method. Their study also found that ap-
proximately 50 % of the students had committed er-
rors such as missing class operations and arguments
in operations, as well as the use of incorrect types of
methods in their UML diagrams. These results high-
light that UML class diagrams are often prone to er-
rors, indicating a potential need for supportive tools
or methodologies in this area. Such findings can be
instrumental in the development of better educational
resources or automated tools to assist in creating more
accurate UML diagrams.
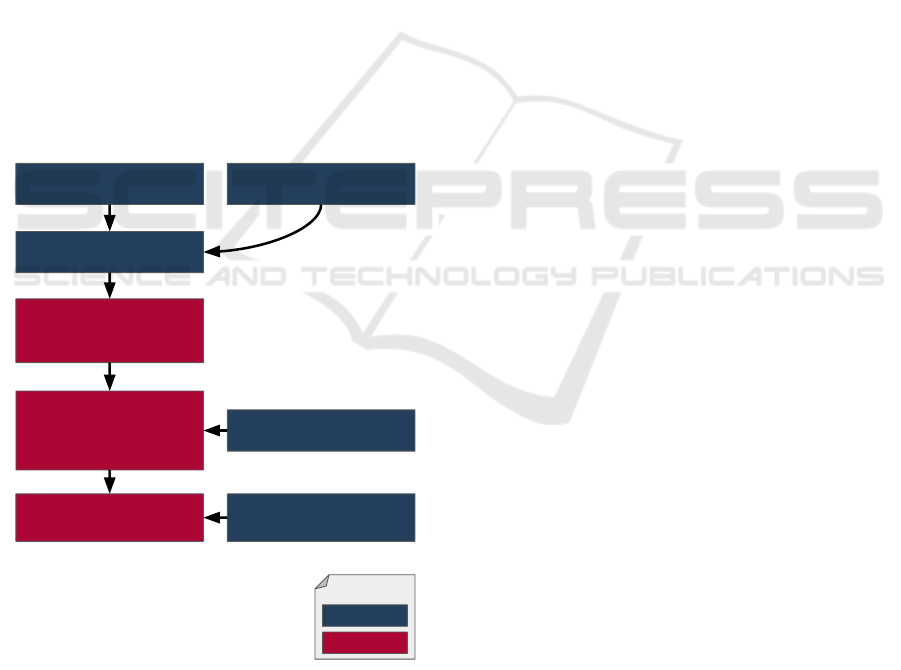
4 APPROACH
Our approach to studying data clumps in UML class
diagrams was structured into three key phases, each
addressing a specific aspect of the research process.
The general flow of our approach is depicted in Fig-
ure 2, which provides a visual representation of the
methodology and the three key phases. The bold red
boxes in the flowchart denote our direct contributions,
while the blue boxes represent external sources or
tools that were used in our research and are not to be
considered part of our original work.
In Section 4.1 we detail the data collection pro-
cess, which corresponds with the first phase. This
initial phase was crucial, as it specified the sources
An Extensive Analysis of Data Clumps in UML Class Diagrams
19
of our data and the methodology used to gather the
UML class diagrams. It involved identifying relevant
datasets, filtering and extracting UML class diagrams
for further analysis. In this first phase we identified
more than 100,000 UMl class diagrams.
Next, Section 4.2 discusses the analysis of the
gathered data, which corresponds with the second
phase. In this phase, we processed the gathered data
to ensure it was suitable for detailed examination.
This processing included cleaning, structuring, and
transforming the data into a format that could be ef-
ficiently analyzed. In this section, we also address
the steps taken and the challenges encountered during
this phase, which includes the adaption of our used
analysis tool.
Finally, Section 4.3 presents the findings of our
study, which corresponds to the third phase. This con-
cluding Section focuses on showcasing the results de-
rived from the analysis of the UML class diagrams. It
provides a presentation of the data, highlighting key
insights and patterns that were observed in the occur-
rence of data clumps within the analyzed diagrams.
Additionally we used external data clumps reports of
source code projects and compared them with our re-
sults.
UML files from
Lindholmen dataset
UML files from
GenMyModel
UML files
(n≈155,000)
1. Data Collection
UML class diagrams
(n≈100,000)
Data clumps analysis
tool
2. Analysis
- Transform Data
- Adapt analysis tool
- Conduct the analysis
Data clumps source
code reports
3. Results
(n≈100,000)
Legend
Others work
Own work
Figure 2: Flow of our approach to analyze class diagrams
for data clumps.
4.1 Data Collection
To make informed conclusions regarding data clumps
in UML class diagrams and to answer our research
questions, we first needed to gather the relevant data,
namely the class diagrams. For this purpose, we ex-
amined sources from the related work described in
Section 3.
4.1.1 Lindholmen Dataset
The Lindholmen dataset provides a wealth of infor-
mation regarding UML class diagrams. It includes a
SQL file with details from more than 170,000 classes
extracted from various sources, along with URLs to
the original files.
Our initial analysis of the SQL file revealed
a database with the stated number of classes, at-
tributes, methods, and relationships. However, a
closer examination revealed class, method, and at-
tribute names with confusing entries such as “1)are”
and “FIoatVIueChange.” Additionally, frequent mis-
interpretations of types, such as “Stnng” instead of
“String,” were found. Further investigation revealed
that the database had been generated using various
source formats and image–to–text processing, which
is also noted by (Robles et al., 2017). The use of this
database for our study was considered problematic as
it could affect the quality and accuracy of our results.
Although not all of its information had been generated
from images, initial samplings led us to disregard this
SQL database and focus instead on the original source
files and links.
We wrote a Python script to repeatedly attempt
to download files from the provided URLs, specifi-
cally filtering for “.uml,” “.xmi,” and “.xml” formats.
Out of 93,607 filtered files, we successfully down-
loaded approximately 37,000 UML files. The next
step was to filter these for UML class diagrams; we
automated this process by searching for files contain-
ing the type “uml:Class.” This process yielded ap-
proximately 2,408 UML class diagrams.
Although the Lindholmen dataset estimates ap-
proximately 30,000 class diagrams, this figure in-
cludes images, which we excluded due to previously
mentioned challenges in reading and parsing, as well
as files that were not downloadable. The authors of
the study have clarified that they manually verified
the image files as UML but did not specifically cat-
egorize them by UML diagram type (Robles et al.,
2017). From our analysis of the downloaded source
files from the Lindholmen Database, we identified ap-
proximately 66,000 classes within the UML class dia-
grams that were found. This number suggests that the
remaining class diagrams were either located among
the image files or stored in other formats that we were
unable to download.
ENASE 2024 - 19th International Conference on Evaluation of Novel Approaches to Software Engineering
20

4.1.2 GenMyModel
The study by (Savary-Leblanc et al., 2022) analyzed
UML class diagrams from GenMyModel, examining
over 100,000 class diagrams. To conduct a broader
analysis of data clumps in class diagrams, we chose to
use this source because it offered a larger quantity of
class diagrams in an easily readable format compared
to the Lindholmen dataset.
Initially, we developed a Python script to down-
load all available UML diagrams from GenMy-
Model. The platform GenMyModel provides an
API that allows downloading the diagram content
in XMI format. We successfully downloaded over
155,000 UML files, similar to the quantity obtained
by Savary–Leblanc et al. We then filtered these UML
files for class diagrams by searching for the type
“uml:Class.” This process identified over 100,000
UML class diagrams, again aligning with the findings
of Savary–Leblanc et al. We identified more than 1.1
million classes in these diagrams.
4.2 Analysis
Having gathered UML class diagrams from the Lind-
holmen Dataset (approximately 2,400 diagrams) and
GenMyModel (approximately 100,000 diagrams),
our next step was to analyze these diagrams for data
clumps.
The selection of tools for detecting data clumps
is limited, as noted by Baumgartner et al. (2023).
A few other tools exist, including CBSD (Hall et al.,
2010) and Stench Blossom (Murphy-Hill and Black,
2010), and some tools no longer exist (such as inFu-
sion and inCode). We chose the tool of Baumgart-
ner et al. due to its recent generation, extensibility,
and open–source availability. Its generic structure al-
lows analysis of both source code and other formats
for data clumps, though this task requires a specific
parser to convert the source files into the abstract for-
mat defined by Baumgartner et al. The tool identifies
data clumps by the definition of (Zhang et al., 2008),
which requires at least three common attributes.
Our next step involved converting the UML class
diagrams into the required format for analysis with
this tool. However, we encountered a unique chal-
lenge differing from the analysis of Java source code,
namely addressing dynamic typing or type inference.
In UML class diagrams, it is common for some
information, such as variable types, to be absent
(Chren et al., 2019). This issue is also present in
dynamically typed programming languages such as
JavaScript, TypeScript, or Python, in which variable
types may not be mandatory or can change over time.
This condition leads to uncertainty in the detection of
data clumps. In its current state, the tool of Baum-
gartner et al. required the data to be tranformed into
a unified JSON format, but this analysis can only be
performed if all information such as type and names
are provided. In our broad dataset, we barely had any
class diagrams that provided all required information,
such as types of variables.
To address this deficiency, we extended the chosen
tool to consider probabilities in detection and assign
probability values when certain information, such as
variable types, was missing or incomplete. We chose
to omit variable types when the information was lack-
ing and to rely on the remaining information with
an uncertainty. This approach enabled us to analyze
UML class diagrams even if not all information had
been provided. The modification also allowed us to
customize the uncertainty percentage for each miss-
ing information type, allowing the user to choose a
specific threshold value at which a data clump would
be considered.
Figure 3 illustrates our enhancements to Baum-
gartner et al.’s tool in a flowchart diagram. We have
modularized the original, hardcoded similarity check
into three distinct functions, thereby increasing the
tool’s flexibility. The three functions independently
evaluate variable types, modifiers, and names, adjust-
ing the initial similarity value from 1 (correspond-
ing to 100 %). This modification not only allows for
different types of similarity checks as described by
(Zhang et al., 2008), including those based on similar
names and various metrics such as the Levenshtein
distance (Su et al., 2008), but also empowers users
with greater control. Users can now choose to detect
strictly identical variables in data clumps or apply a
more nuanced approach for addressing missing infor-
mation and uncertainties in certain class diagrams.
4.3 Results
Having adapted Baumgartner et al.’s tool to man-
age uncertainties, we proceeded to analyze the class
diagrams from the GenMyModel and Lindholmen
datasets. The analysis focused on the generation of
evaluations for both clusters and types of data clumps
as established by (Baumgartner and Pulverm
¨
uller,
2024).
Table 1 presents an extensive overview of the
prevalence of data clumps in UML class diagrams,
derived from our analysis of the Lindholmen and
GenMyModel datasets. In addition, the table includes
a third element that represents a combined analysis
of both datasets. The table illustrates a noteworthy
trend in the distribution of data clumps across these
An Extensive Analysis of Data Clumps in UML Class Diagrams
21
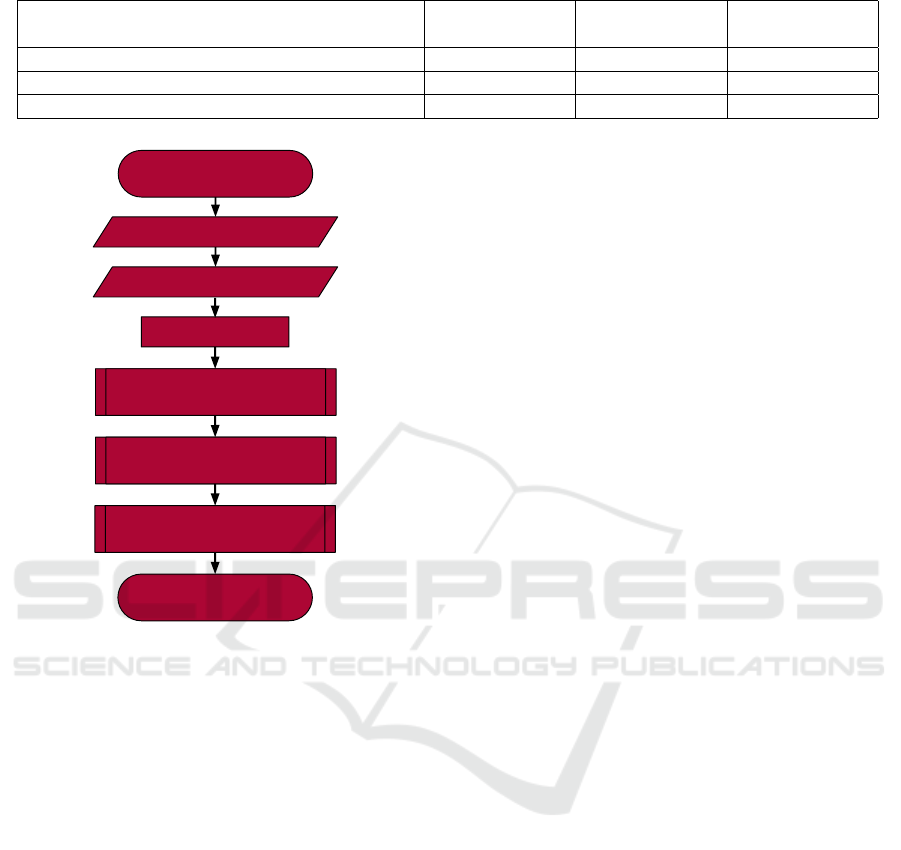
Table 1: Proportion of UML class diagrams with data clumps.
Dataset Lindholmen GenMyModel Lindholmen +
GenMyModel
Number of diagrams with data clumps 546 19,899 20,445
Total number of diagrams 2,270 104,602 106,872
Percentage of diagrams with data clumps 24 % 19 % 19 %
similarity = 1
isSimilarTo
Return similarity
Variables to compare
change similarity by
name similarity
change similarity by
type similarity
change similarity by
modifier similarity
config file
Figure 3: Flowchart diagram: Adaptation of the method for
similarity checking.
datasets.
A close inspection of the table indicates that the
Lindholmen dataset exhibited a slightly higher per-
centage of class diagrams containing data clumps
(24 %) compared to GenMyModel (19 %). This dis-
parity could reflect the specific nature or complex-
ity of projects within the Lindholmen dataset, which
might inherently be more prone to data clumps.
However, it is crucial to consider the substantial
difference in the total number of diagrams between
the two datasets. GenMyModel, with its consider-
ably larger number of diagrams (104,602 compared
to Lindholmen’s 2,270), significantly influenced the
overall percentage of diagrams with data clumps. De-
spite Lindholmen’s higher individual percentage, the
sheer scale of the GenMyModel dataset diluted the
overall prevalence, reducing it to an average of 19 %
when the two datasets were combined.
This observation underscores the impact that the
size and scope of a dataset can have on statistical out-
comes, particularly in studies involving comparative
analysis. In this case, the predominance of GenMy-
Model’s dataset in terms of quantity played a critical
role in shaping the overall findings regarding the oc-
currence of data clumps in UML class diagrams.
The box plot in Figure 4 visualizes the distribution
of data clump cluster types from GenMyModel class
diagrams. “Cluster Type 1” had a median value of
0 %, indicating very low frequency of this type of data
clump cluster. “Cluster Type 2” exhibited a median at
100 %, suggesting a consistently high presence in the
diagrams. In contrast, “Cluster Type 3” had a median
of 0 %, which implies that this type of data clump
cluster was generally absent or very rare; however,
it exhibited a wide interquartile range (IQR), indicat-
ing substantial variability within the data. This wider
spread was also characterized by a number of outliers,
suggesting the presence of occasional diagrams with
higher percentages of “Cluster Type 3” data clumps.
The box plot shown in Figure 5 illustrates the dis-
tribution of data clump cluster types from Lindhol-
men class diagrams. “Cluster Type 1” showed a me-
dian at 0 %, indicating very low occurrence within the
class diagrams that were analyzed. The median for
“Cluster Type 2” was approximately 21 %, suggest-
ing a moderate presence of these data clump cluster
type. “Cluster Type 3” had a median near 67 %, re-
flecting a more common occurrence of this type of
data clump cluster type in the dataset. It is impor-
tant to note that while “Cluster Type 1” demonstrated
limited variability, as shown by the small interquartile
range (IQR), “Cluster Type 2” and “Cluster Type 3”
presented a larger IQR, indicating greater variability
in their occurrences. Furthermore, a number of out-
liers were observed for “Cluster Type 1” and “Clus-
ter Type 2,” which could suggest the presence of un-
usual cases with significantly higher percentages of
data clump cluster types.
The box plot in Figure 6 depicts the distribution
of data clump types within the GenMyModel class
diagrams. It shows that the median percentage for pa-
rameter–parameter data clumps was approximately
0 %, indicating a very low occurrence of this type of
data clump. In contrast, the field–field category had
a median close to 100 %, signifying a very high oc-
currence rate. Similarly, parameter–field data clumps
also exhibited a median percentage at 0 %, suggesting
they were rarely found in this dataset. It is notable
that the field–field data clump category also contained
ENASE 2024 - 19th International Conference on Evaluation of Novel Approaches to Software Engineering
22
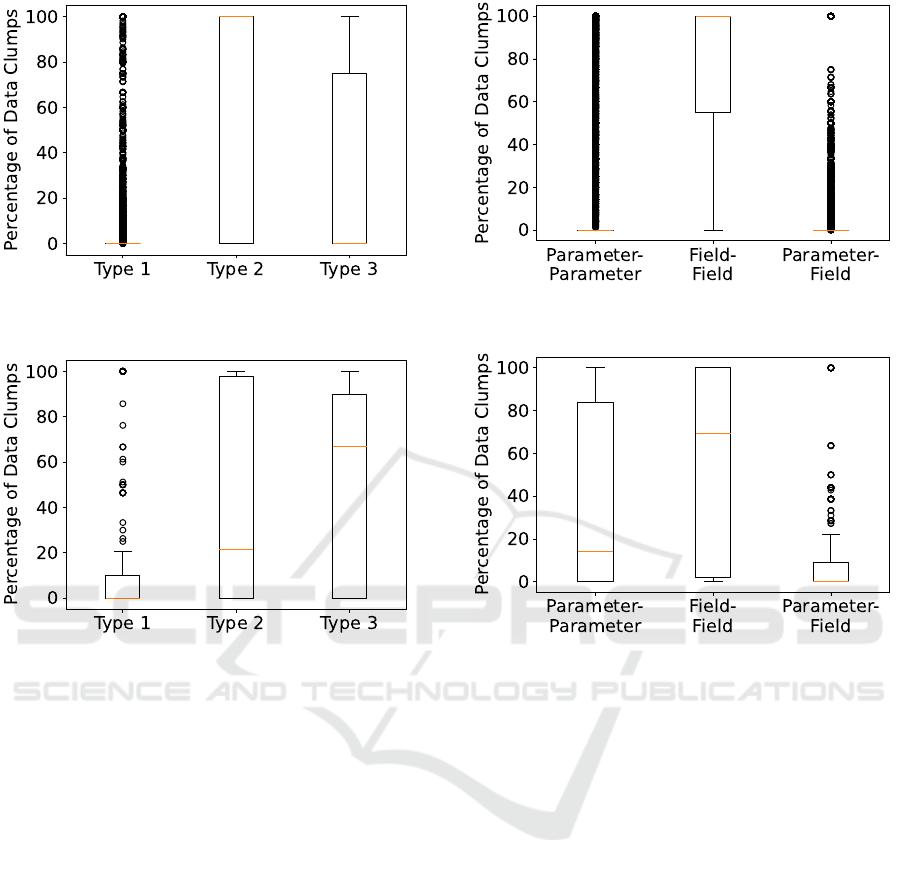
Figure 4: Distribution of data clump cluster types relative
to the number of data clumps in the GenMyModel dataset.
Figure 5: Distribution of data clump cluster types relative
to the number of data clumps in the Lindholmen dataset.
a large number of outliers, as indicated by the points
above the upper whisker of the box plot.
The box plot in Figure 7 illustrates the distribution
of data clump types extracted from Lindholmen class
diagrams. The parameter–parameter type showed
a median percentage of approximately 14 %, while
the field–field type had a median percentage close
to 69 %. For parameter–field data clumps, the me-
dian percentage was significantly lower at near 0 %.
The parameter–parameter category displayed a rel-
atively smaller interquartile range (IQR), suggesting
less variability in the data compared to the field–field
category, which exhibited a wide IQR.
5 DISCUSSION
In this section, we discuss the findings from our anal-
ysis of the Lindholmen and GenMyModel datasets
and compare their characteristics.
Figure 6: Distribution of data clump types in the GenMy-
Model dataset.
Figure 7: Distribution of data clump types in the Lindhol-
men dataset.
5.1 Cluster Types
Comparison of the Lindholmen and GenMyModel
datasets revealed notable differences in the distribu-
tion of cluster types. In the Lindholmen dataset,
“Cluster Type 1” was virtually nonexistent, while
“Cluster Type 3” was the most prevalent with a me-
dian of 67 %. “Cluster Type 2” showed a moderate
presence with a median of 21 %. The larger GenMy-
Model dataset also exhibited a 0 % median for Clus-
ter Type 1, indicating the rarity of this type in both
datasets. However, “Cluster Type 2” stood out with
a median of 100 %, signifying a significant presence.
The wide interquartile ranges for Cluster Types 2 and
3 in both datasets suggest varied expressions of these
types across different diagrams.
These differences may have been influenced by
several factors, including the complexity of projects,
the expertise level of users, and the domains of the
modeled systems. Overall, it is evident that many
data clumps spanned multiple classes or interfaces,
indicating that they could not be considered as iso-
lated within single classes.
An Extensive Analysis of Data Clumps in UML Class Diagrams
23

Comparing the distribution of cluster types in
source code projects, as examined by (Baumgartner
and Pulverm
¨
uller, 2024), we observed distinct differ-
ences and trends. In source code projects, “Cluster
Type 1” was most dominant, with a median of approx-
imately 31 % compared to “Cluster Type 2” (median
of approximately 13 %) and “Cluster Type 3” (median
of approximately 15 %). This pattern suggests that
data clumps in UML class diagrams are more widely
distributed across multiple classes or interfaces. This
effect could be due to the detailed implementation of
classes or interfaces in source code projects, which of-
ten include helper methods or classes that might not
be present in initial or rough UML class diagram plan-
ning. Another reason could relate to the evolutionary
nature of source code projects as they grow and be-
come refactored over time, potentially splitting large
networks of data clumps. The size and complexity of
source code projects might also have contributed to
this discrepancy, as they are often more extensive and
intricate than UML class diagrams.
5.2 Data Clumps Types
Analysis of data clump types in the GenMyModel and
Lindholmen datasets revealed significant differences,
yet a similar trend was observed in both. In the Gen-
MyModel dataset, field–field data clump types pre-
dominated, with a median close to 100 %, whereas
this type was present at a median of 69 % in the Lind-
holmen dataset. This predominance in both datasets
suggests a trend towards certain object–oriented de-
sign principles. The parameter–parameter and pa-
rameter–field types were significantly less common
in the GenMyModel dataset, with both showing
a median of 0 %. Conversely, the Lindholmen
dataset exhibited a noteworthy presence of parame-
ter–parameter types, at a median of 14 %, whereas
parameter–field types remained scarce.
These findings may indicate different usage pat-
terns or design approaches in the two datasets. The
Lindholmen data, primarily sourced from GitHub,
contrasts with GenMyModel’s more accessible graph-
ical interface. Further research could explore whether
class diagrams derived from these datasets inherently
differ in characteristics, especially regarding the dis-
tribution of class fields versus method parameters.
Comparing the distribution of data clump types
in class diagrams with those in source code projects
yielded clear differences. Whereas “Parame-
ter–Parameter” data clump types predominated in
source code projects, with a median of 93 %, they
were barely present in class diagrams. This dispar-
ity could be attributed to the implementation of meth-
ods in source code projects. As noted by (Chren
et al., 2019),common errors in UML diagrams in-
clude incorrect implementation or even the absence
of parameters and methods. Source code projects
showed a lower presence of field–field (approxi-
mately 5.9 %) and parameter–field (approximately
0.5 %) data clump types. Both UML class diagrams
and source code projects shared a rarity of param-
eter–field types, nearly 0 % in both cases. How-
ever, a stark contrast was observed in field–field types,
which were scarcely present in source code projects
but dominated class diagrams, with 69 % and 100 %
medians.
The low frequency of parameter–parameter data
clumps in class diagrams may be related to frequent
mistakes such as missing class operations, missing
or improper implementation of operation arguments,
or incorrect method types, as identified in student
projects. Examination of common practices showed
that UML class diagrams include attributes approx-
imately 20 % more often than they included opera-
tions (Savary-Leblanc et al., 2022). Students’ confu-
sion regarding which information should be modeled
as a method versus a class in UML class diagrams
as well as their uncertainty in implementing meth-
ods have been highlighted by (Reuter et al., 2020).
These educational insights, while specific to student
projects, may reflect broader trends in UML class di-
agramming practices.
6 THREATS TO VALIDITY
In this study of UML class diagrams, several poten-
tial threats to validity must be considered. The class
diagrams we examined might have primarily included
field definitions rather than method parameters, pos-
sibly because they were based on ER–Diagrams or
had been created by non–programmers who may have
overlooked method parameters. It is important to note
that unimplemented functions are not inherently in-
dicative of a design smell. In addressing the threats to
validity, it is essential to acknowledge that our study’s
focus was primarily on UML class diagrams, which
does not encompass all types of UML diagrams.
The sample size and complexity of the diagrams
that were analyzed could also pose a threat. The num-
ber of diagrams may have been insufficient to form a
representative sample, or the diagrams may not have
been complex enough to thoroughly test capabilities
for data clump detection. Another issue is the poten-
tial presence of duplicate diagrams within our source
files. Distinguishing between actual duplicates and
similar but independently created diagrams was not a
ENASE 2024 - 19th International Conference on Evaluation of Novel Approaches to Software Engineering
24

specific focus of our study; however, this factor could
have affected the uniqueness of our data set.
We also did not consider the varied backgrounds
of the authors of the source files, as this information
is typically unavailable in broad studies. This lack
of awareness of background diversity could impact
the generalizability of our findings. In terms of file
format filtering, it is possible that we excluded some
formats, particularly less common ones, which could
have produced an incomplete dataset.
Data download limitations presented another chal-
lenge. We were only able to download a portion of the
UML class diagrams from the Lindholmen database.
Moreover, many links in the Lindholmen dataset di-
rected to GitHub, a dynamic platform from which
some projects might no longer be accessible. This
condition could impact the repeatability of our analy-
sis and the representativeness of our data, especially
because GitHub may host numerous student or exper-
imental projects. To address this issue, we plan to
provide our source files and downloaded data in an
attachment with a link. Regarding the GenMyModel
data, we downloaded a number of files that were
nearly identical to those acquired by Savary–Leblanc
et al. However, it remains uncertain whether these
were the same files. The risk in this case is deemed
to be low because these authors’ analysis did not pri-
marily focus on data clumps.
Given these potential threats, our findings should
be interpreted cautiously, and these results should be
generalized carefully considering these limitations.
7 CONCLUSION
In responding to our research questions, comprehen-
sive analysis of the Lindholmen and GenMyModel
datasets has offered revealing insights into the char-
acteristics and nuances of data clumps in UML class
diagrams, as well as comparative aspects relative to
source code projects.
Research Question 1. What are the characteristics
of data clumps in UML class diagrams? The UML
class diagrams evaluated in our analysis exhibited a
notable prevalence of field–field data clumps, espe-
cially in the GenMyModel dataset, in which these
types were nearly omnipresent (with a median occur-
rence of nearly 100 %) in diagrams with data clumps.
The occurrence of parameter–parameter data clumps
was considerably less frequent in diagrams with data
clumps, as shown by their median occurrence of
14 % in the Lindholmen dataset. Moreover, these
data clumps were typically distributed across multi-
ple classes or interfaces, rather than being confined
to single classes, with “Cluster Type 3” (involving
more than two classes or interfaces) being particu-
larly prevalent in the Lindholmen dataset. On av-
erage, data clumps were detected in approximately
19 % of our analyzed UML class diagrams.
Research Question 2. How do these characteristics
in UML class diagrams compare to those observed
at the code level? In contrast to UML class dia-
grams, source code projects were characterized by the
predominant presence of parameter–parameter data
clumps, as indicated by the 93 % median occurrence
in the sample studied by Baumgartner et al. This
strong contrast points to a potential lack of detailed
method implementation in UML class diagrams. Ad-
ditionally, field–field data clumps, while significantly
prominent in UML class diagrams, appeared less fre-
quently in source code projects, suggesting a focus
on class structures and relationships during the initial
planning phase of UML class diagrams.
The differences between the Lindholmen and
GenMyModel datasets also shed light on the vary-
ing modeling practices and potential underlying
paradigms of their respective user groups. These find-
ings could be valuable for tool developers, educa-
tors, and practitioners who are interested in enhancing
UML modeling tools, teaching methods, and design
practices in software development. The varied dis-
tribution of data clump cluster types in the datasets,
such as the near–absence of “Cluster Type 1” in both
datasets and the dominance of “Cluster Type 2” in
GenMyModel, may reflect different levels of project
complexity, user expertise, and system domains mod-
eled in the datasets.
In conclusion, our study has underscored the di-
versity and complexity inherent in UML class dia-
gram modeling, providing crucial insights for further
research and applications in the field of software en-
gineering.
REFERENCES
Alkharabsheh, K., Crespo, Y., Manso, M., and Taboada, J.
(2019). Software Design Smell Detection: A System-
atic Mapping Study. Software Quality Journal, pages
1–80.
Arendt, T. and Taentzer, G. (2013). A tool environment
for quality assurance based on the Eclipse Model-
ing Framework. Automated Software Engineering,
20:141–184.
Baumgartner, N., Adleh, F., and Pulverm
¨
uller, E. (2023).
Live Code Smell Detection of Data Clumps in an In-
tegrated Development Environment. In Proceedings
An Extensive Analysis of Data Clumps in UML Class Diagrams
25

of the 18th International Conference on Evaluation of
Novel Approaches to Software Engineering, volume 1,
pages 64–76. Science and Technology Publications,
Lda.
Baumgartner, N. and Pulverm
¨
uller, E. (2024). The Life-
Cycle of Data Clumps: A Longitudinal Case Study
in Open-Source Projects. In 12th International Con-
ference on Model-Based Software and Systems Engi-
neering, Rome, Italy. Science and Technology Publi-
cations, Lda. [Accepted].
Bergstr
¨
om, G., Hujainah, F., Ho-Quang, T., Jolak, R., Ruk-
mono, S. A., Nurwidyantoro, A., and Chaudron, M. R.
(2022). Evaluating the layout quality of UML class
diagrams using machine learning. Journal of Systems
and Software, 192:111413.
Chaudron, M., Heijstek, W., and Nugroho, A. (2012). How
effective is UML modeling ? - An empirical perspec-
tive on costs and benefits. Software and Systems Mod-
eling, 4:571–580.
Chren, S., Buhnova, B., Macak, M., Daubner, L., and Rossi,
B. (2019). Mistakes in UML Diagrams: Analysis of
Student Projects in a Software Engineering Course.
In 2019 IEEE/ACM 41st International Conference on
Software Engineering: Software Engineering Educa-
tion and Training (ICSE-SEET), pages 100–109.
Dzidek, W. J., Arisholm, E., and Briand, L. C. (2008). A
Realistic Empirical Evaluation of the Costs and Ben-
efits of UML in Software Maintenance. IEEE Trans.
Softw. Eng., 34(3):407–432.
Eclipse Foundation (2023). Eclipse. Retrieved December
11, 2023, from https://www.eclipse.org/.
Fowler, M., Becker, P., Beck, K., Brant, J., Opdyke, W., and
Roberts, D. (1999). Refactoring - Improving the De-
sign of Existing Code. Addison-Wesley Professional,
Boston.
Hall, T., Zhang, M., Bowes, D., and Sun, Y. (2010). Code
Bad Smell Detector. Retrieved December 11, 2023,
from https://sourceforge.net/projects/cbsdetector/.
Hall, T., Zhang, M., Bowes, D., and Sun, Y. (2014). Some
Code Smells Have a Significant but Small Effect on
Faults. ACM Transactions on Software Engineering
and Methodology, pages 1–39.
Ho-Quang, T., Hebig, R., Robles, G., Chaudron, M. R.,
and Fernandez, M. A. (2017). Practices and Percep-
tions of UML Use in Open Source Projects. In 2017
IEEE/ACM 39th International Conference on Soft-
ware Engineering: Software Engineering in Practice
Track (ICSE-SEIP), pages 203–212.
International Organization for Standardization (2014).
ISO/IEC 19509:2014 - XML Metadata Interchange
(XMI). Retrieved December 11, 2023, from https:
//www.omg.org/spec/XMI/ISO/19509/PDF.
Jerzyk, M. and Madeyski, L. (2023). Code Smells: A Com-
prehensive Online Catalog and Taxonomy. In Kryvin-
ska, N., Gregus, M., and Fedushko, S., editors, De-
velopments in Information and Knowledge Manage-
ment Systems for Business Applications, pages 543–
576. Springer, Cham.
JetBrains (2023). List of Java Inspections. Retrieved
December 11, 2023, from https://www.jetbrains.com/
help/idea/list-of-java-inspections.html.
Koc¸, H., Erdo
˘
gan, A. M., Barjakly, Y., and Peker, S. (2021).
UML Diagrams in Software Engineering Research: A
Systematic Literature Review. Proceedings, 74(1).
Murphy-Hill, E. and Black, A. P. (2010). An Interactive
Ambient Visualization for Code Smells. In Proceed-
ings of the 5th International Symposium on Software
Visualization, SOFTVIS ’10, pages 5–14, New York,
NY, USA. Association for Computing Machinery.
Nugroho, A. and Chaudron, M. R. V. (2009). Evaluating
the Impact of UML Modeling on Software Quality:
An Industrial Case Study. In Sch
¨
urr, A. and Selic,
B., editors, Model Driven Engineering Languages and
Systems, pages 181–195. Springer, Berlin.
Reuter, R., Stark, T., Sedelmaier, Y., Landes, D., Mottok, J.,
and Wolff, C. (2020). Insights in Students’ Problems
during UML Modeling. In 2020 IEEE Global En-
gineering Education Conference (EDUCON), pages
592–600.
Robles, G., Ho-Quang, T., Hebig, R., Chaudron, M. R., and
Fern
´
andez, M. (2017). An Extensive Dataset of UML
Models in GitHub. In IEEE/ACM 14th International
Conference on Mining Software Repositories (MSR),
pages 519–522.
Savary-Leblanc, M., Le Pallec, X., Palanque, P., Mar-
tinie, C., Blouin, A., Jouault, F., Clavreul, M., and
Raffaillac, T. (2022). Mining Human Factors Gen-
eral Trends from +100k UML Class Diagrams. In
Proceedings of the 25th International Conference on
Model Driven Engineering Languages and Systems:
Companion Proceedings, MODELS ’22, pages 913–
922.
Su, Z., Ahn, B.-R., Eom, K.-Y., Kang, M.-K., Kim, J.-P.,
and Kim, M.-K. (2008). Plagiarism Detection Using
the Levenshtein Distance and Smith-Waterman Algo-
rithm. In 2008 3rd International Conference on Inno-
vative Computing Information and Control, page 569.
Visual Paradigm (2002). Visual Paradigm. Retrieved De-
cember 11, 2023, from https://www.visual-paradigm.
com/.
Yang, S. and Sahraoui, H. (2022). Towards automatically
extracting uml class diagrams from natural language
specifications. In Proceedings of the 25th Interna-
tional Conference on Model Driven Engineering Lan-
guages and Systems: Companion Proceedings, MOD-
ELS ’22. ACM.
Zhang, M., Baddoo, N., Wernick, P., and Hall, T. (2008).
Improving the Precision of Fowler’s Definitions of
Bad Smells. In 2008 32nd Annual IEEE Software En-
gineering Workshop, pages 161–166.
ENASE 2024 - 19th International Conference on Evaluation of Novel Approaches to Software Engineering
26
