
Detecting Edge Cases from Trajectory Datasets Using Deep Learning
Based Outlier Detection
Marcel Sonntag
a
, Lennart Vater
b
, Roman Vuskov
c
and Lutz Eckstein
d
Institute for Automotive Engineering (ika), RWTH Aachen University, Steinbachstr. 7, 52074 Aachen, Germany
Keywords:
Automated Driving, Safety Validation, Edge Case Detection, Outlier Detection.
Abstract:
The biggest challenge to overcome for automated vehicles is to prove their safety, as these vehicles are solely
responsible for the passengers’ safety. The scenario-based testing approach promises an efficient safety vali-
dation procedure by only testing the safety in relevant scenarios. An open question is how to select the relevant
scenarios for testing. So-called edge cases are frequently named in the automated driving domain to be impor-
tant scenarios for testing automated vehicles. However, it is not an easy task to define what an edge case is and
to find and validate them. In this work, we present a novel data-driven approach to finding edge cases in tra-
jectory datasets using deep learning-based outlier detection. We develop a method that calculates embeddings
for driving scenarios in a two-stage process. In the dimensionally reduced embedding space, outliers represent
potential edge cases. We apply the approach to the exiD dataset and find potential edge cases. For validation,
we present the found potential edge cases to a group of experts. The experts validate that the approach is
capable of detecting edge cases in trajectory datasets.
1 INTRODUCTION
Automated driving (AD) offers great benefits for the
passengers and also for the whole traffic in general
(Bjorvatn et al., 2021). To achieve these benefits, it
is important to make sure that the automated driving
systems (ADSs) act responsibly before they are re-
leased to the market. An approach for this safety val-
idation is the scenario-based testing approach (Ried-
maier et al., 2020). The idea is to not test a devel-
oped ADS in field tests only, but to expose it to sys-
tematically defined scenarios in simulations or on a
test track to minimize the amount of testing in real
world traffic. One promising type of scenarios are so-
called edge cases (ECs). This is a term that is fre-
quently used in the AD domain to refer to particu-
larly relevant scenarios for testing. However, defin-
ing ECs generally yet precisely is a big challenge,
because ultimately, the system under test should be
involved (Vater et al., 2023). This lack of a precise
definition makes finding potential ECs in traffic data
and also validation of the found ones challenging.
a
https://orcid.org/0009-0003-1247-1782
b
https://orcid.org/0000-0003-0785-2866
c
https://orcid.org/0009-0006-5022-9120
d
https://orcid.org/0000-0002-2586-7511
There exist different scopes when talking about
ECs. One is to consider ECs with respect to the per-
ception, i.e., the sensors of the vehicle (Breitenstein
et al., 2020). Another scope is on trajectory level.
Trajectory level means that only the interaction and
behaviour of the road users are analysed to find ECs.
On the one hand, many approaches are knowledge-
driven starting from expert knowledge and trying to
define top-down, which kind of situations might be
challenging for the ADS (Ponn et al., 2020). On the
other hand, there are statistical approaches, defining
edge cases as ”rare” situations. These data-driven ap-
proaches find ECs by detecting outliers in the param-
eter values of scenarios.
A category of ECs that is not found by both of
these approaches is the unknown unknown EC, i.e.,
a category of ECs that is not yet known to experts
and therefore cannot directly be searched for in data.
Thus, it is impossible to find unknown unknown ECs
using purely knowledge-based approaches. The un-
known unknown ECs can be understood as semantic
outliers. The search for these ECs in real-world tra-
jectory data, including complex situations and inter-
actions between many involved vehicles, can be ex-
pressed as the search for semantically different sce-
narios. Semantically different scenarios are not the
same as an extreme parameter value. Therefore, us-
Sonntag, M., Vater, L., Vuskov, R. and Eckstein, L.
Detecting Edge Cases from Trajectory Datasets Using Deep Learning Based Outlier Detection.
DOI: 10.5220/0012551600003702
Paper published under CC license (CC BY-NC-ND 4.0)
In Proceedings of the 10th International Conference on Vehicle Technology and Intelligent Transport Systems (VEHITS 2024), pages 31-39
ISBN: 978-989-758-703-0; ISSN: 2184-495X
Proceedings Copyright © 2024 by SCITEPRESS – Science and Technology Publications, Lda.
31

ing purely statistical approaches can also not find the
unknown unknown edge cases. It is also challeng-
ing to validate found potential ECs. Previous EC de-
tection methods have mainly qualitatively presented
found ECs in their work (Souflas et al., 2022).
In this paper, we present a model-free EC detec-
tion approach that is not based on expert knowledge
but works in a semi-supervised way, analysing whole
trajectory datasets. In addition, we present a system-
atic validation method for EC detection algorithms
based on an expert survey. Taking expert knowledge
into the loop after the actual detection promises the
benefit that the algorithm can first work unbiased,
but then can still be validated using precious expert
knowledge. In short, our main contributions in this
paper are the following:
• A model-free semi-supervised approach to find
ECs in large trajectory datasets,
• A validation method for EC detection algorithms
based on an expert survey,
• Demonstrating how to use both methods on a pub-
licly available large scale trajectory dataset.
The remainder of the paper is structured as fol-
lows: In Section 2, we present the related work that
we built our method upon. In Section 3, we detail the
methodology of our approach for EC detection and
the knowledge-based validation approach. In Sec-
tion 4, we show results of a case study we performed
using our method on a large scale trajectory dataset
and the result of the subsequently conducted expert
survey. We then discuss the results in Section 5 and
give a conclusion in Section 6.
2 RELATED WORK
In the context of scenario-based testing, scenarios can
be described as a sequence of scenes (Ulbrich et al.,
2015). We apply this definition, but use the term
frame instead of scene. The 6-Layer Model (Scholtes
et al., 2021) is a frequently used model for defining all
relevant factors of a given scenario. In the remainder
of the paper, we use the term driving scenario (DS)
with the following definition:
A driving scenario is a short period of driving de-
fined by its main driving task (e.g. car following, lane
change) or triggered by an event (e.g. an obstacle in
the lane). (Sonntag et al., 2023)
We explicitly include the term driving to empha-
size the difference to (traffic) scenarios with a broader
scope. Following this definition, a DS describes a
range of driving scenario instances of one class, e.g.,
cut-ins. To differentiate a specific instance of a DS
from the class, we use the term DS instance.
There exist multiple ideas of what ECs are. In a
previous work (Vater et al., 2023), we have analyzed
existing usages of the term edge case in the litera-
ture to derive a common definition that is as specific
as possible while taking as much of the existing at-
tributes of ECs into account. The definition for ECs
we derived is the following:
An edge case is a novel or rare situation that still
needs specific design attention to be dealt with in a
reasonable and safe way, as it is a boundary case of
one parameter for the system. The quantification of
“rare” is relative, and generally refers to situations or
conditions that will occur often enough in a full-scale
deployed fleet to be a problem. (Vater et al., 2023)
It is slightly adapted from the already existing def-
inition of (Koopman and Wagner, 2017) to make it
more applicable in a wider range of contexts. An-
other finding of the literature review is that the term
corner case, which is often used in similar contexts
as the term edge case in the literature, has very sim-
ilar attributes than an edge case (Vater et al., 2023).
Therefore, in this paper, we will not differentiate be-
tween the two terms, but use just the term edge case
for both.
The challenge is to identify those novel and rare
cases to use them for scenario-based testing. Most
data driven approaches utilize models based on ex-
pert knowledge to identify those cases. For example,
(Ponn et al., 2020) use metrics to determine the com-
plexity of DSs. They talk about challenging scenarios
without using the term edge case. Other model-based
approaches generate synthetic ECs based on accidents
(Souflas et al., 2022). Those approaches have in com-
mon that the used model adds a bias to the identified
ECs. This leads to the fact that elements not incor-
porated in those models might be overlooked, which
is especially true for unknown unknown ECs, as they
are rare things that have not been thought of before.
Additionally, both approaches do not apply a valida-
tion step that is independent of an actual system im-
plementation.
To find those unknown unknowns, general outlier
detection methods utilizing deep-learning instead of
knowledge based models can be applied. (Pang et al.,
2021) present three different deep-learning based ap-
proaches. Most applicable for our work is the ap-
proach of learning feature representations of normal-
ity. The objective is to not just learn features, but to
focus on learning specific features representing nor-
mality. (Pang et al., 2021) use the term anomaly de-
tection. Although (Yang et al., 2021) define that there
are slight differences between outlier detection and
VEHITS 2024 - 10th International Conference on Vehicle Technology and Intelligent Transport Systems
32
anomaly detection, the overall approaches are trans-
ferable.
Finding feature representations is a crucial step for
detecting outliers, as it reduces the dimensionality of
the data. In high dimensional spaces, there might be
no clusters of data and, thus, no outliers, because of
the high amount of possible combinations of param-
eters in all dimensions. Therefore, methods for re-
ducing the dimensionality of DS representations are
required. In the literature, different approaches were
developed with the purpose of identifying clusters of
DS instances to structure the space of possible DS.
(Harmening et al., 2020) introduce two approaches
considering only the dynamic objects, but neglecting
the static environment. (Zhao et al., 2021) introduce a
two stage process based on image representations of
the scenes incorporating the dynamic objects as well
as the street layout. In the first stage, embeddings for
each scene are learned based on an autoencoder. In
the second stage, a temporal representation of a se-
quence of scenes is learned using a recurrent neural
network (RNN). Both publications do not optimize
and use the representations for detecting outliers.
(Han et al., 2022) analyse different existing ap-
proaches for detecting global outliers. They identified
that k-th nearest neighbour (Ramaswamy et al., 2000)
is the most effective detector for identifying global
outliers. It calculates the distance to the k-th near-
est neighbour and takes this score as a measure for
anomaly.
3 METHODOLOGY
The literature review reveals that there are no vali-
dated approaches for detecting ECs considered as un-
known unknowns applied to large amounts of data.
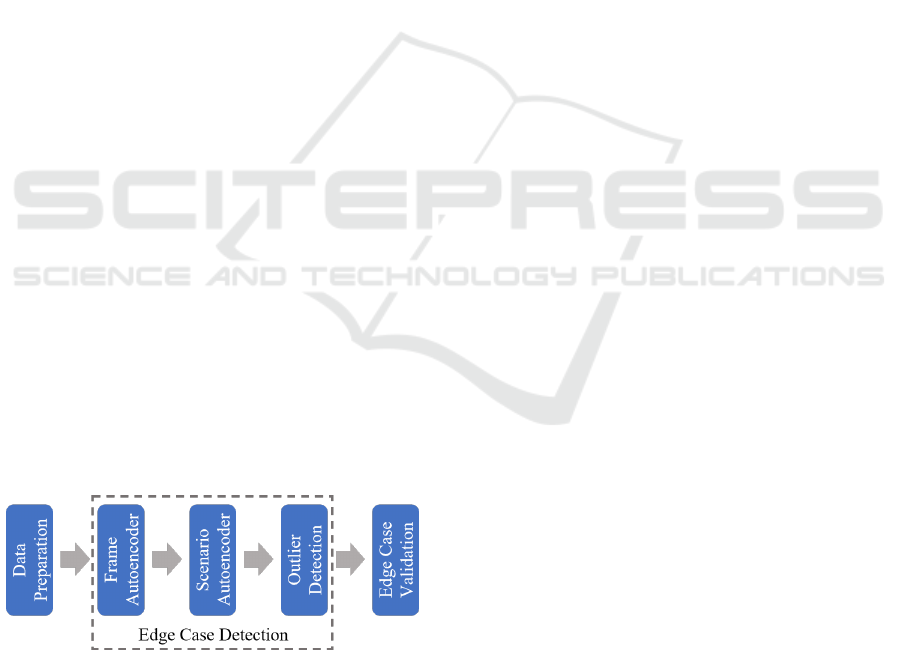
The presented method overcomes this lack. Figure 1
gives an overview of the developed method.
Figure 1: Edge Case Detection Method Overview.
At first, the trajectory data is preprocessed to pro-
vide the required information abstracted from the
original object and map data. After that, within the
EC detection, embeddings of these data are calcu-
lated. Those DS embeddings are used for detecting
outliers. To validate the developed method, an expert
survey is conducted.
3.1 Data Preparation
The preprocessing of the data as an input for the EC
detection consists of a spatial and a temporal abstrac-
tion step. The spatial abstraction extracts and converts
the relevant information per frame. The temporal ab-
straction step segments the recorded track into smaller
chunks representing DSs. This chunking step is re-
quired, because having DSs all with similar length,
makes them more comparable.
3.1.1 Spatial Abstraction
For the spatial abstraction of trajectory data, most
relevant are the elements on layer 4 (dynamic ob-
jects) and layer 1 (street layer) of the 6-Layer Model
(Scholtes et al., 2021). Therefore, the spatially ab-
stracted trajectory data consists of two sets, which
correspond to the two relevant layers of the 6-Layer
Model: the traffic set and the street set.
The traffic set represents the dynamic objects. It
includes the dynamics of all relevant dynamic objects
that are in the surrounding of the ego vehicle. Objects
are considered relevant when they are on the same
road as the ego vehicle and within a radius of 50 me-
ters. This value is selected, as in that range a precise
perception with the ego vehicle’s sensors is assumed
and the behaviour of the close objects is assumed to
influence the ego vehicle’s behaviour. For each rel-
evant object the relative position in x and y to the
ego vehicle, the heading, the velocities in x and y, as
well as the width and length are considered. The ego
vehicle’s position marks the origin of the coordinate
system in each frame. In addition to the surrounding
objects, the ego velocity is considered as well.
The street set represents the street layer. This
novel approach of using a set to represent the street
layer uses a 2D point cloud abstracting the lane mark-
ings. The point cloud is created using the points defin-
ing the lines in a Lanelet2 map (Poggenhans et al.,
2018). Additional points along the lines are added,
when there are long straight lines with more than 5
meters between the individual points, to achieve a
minimum density of the points.
The result of the data preprocessing of an example
frame is visualized in Figure 2. The street set and the
traffic set are depicted as an overlay onto an image of
the road segment and the Lanelet2 lines (green lines).
Detecting Edge Cases from Trajectory Datasets Using Deep Learning Based Outlier Detection
33

Figure 2: Visualization of the frame data as an overlay. Ego
vehicle depicted as red rectangle.
3.1.2 Temporal Abstraction
The temporal abstraction cuts the recorded tracks into
segments representing individual DS instances to re-
duce the number of manoeuvres and interactions per
segment. This reduces the number of possible com-
binations of those within one segment, resulting in
comparable tracks. The goal is to find meaningful
segments in the data without being too specific and
thereby influencing the outlier detection.
For this work, the DS concept developed within
the Hi-Drive project is used as a basis (Sonntag et al.,
2023). The concept allows using different levels of
abstraction for DSs. For the presented approach,
only segmenting the track is relevant, and no de-
tailed classification is required, leading to a high level
of abstraction. In fact, the tracks within the trajec-
tory dataset are segmented first into Driving in Lane,
Changing Lane, Crossing, and Turning according to
the first level of the DS concept. As the driving-in-
lane segments can still be rather long with multiple
interactions, they are further segmented according to
lower levels of the DS concept. This segmentation is
done by detecting the DSs Cut-in (passive), Follow-
ing a Lead Vehicle, Approaching a Lead Vehicle, Ego
Vehicle Stationary, and Uninfluenced Driving. When
there are still segments exceeding a length of ten sec-
onds, they are further segmented into uniform chunks
of a duration of up to ten seconds.
3.2 Edge Case Detection
The EC detection approach itself consists of two main
steps. First, the data is compressed to find compact
representations for the individual DS instances in the
data. The goal is to get an embedding for each DS
instance within a lower-dimensional parameter space.
Based on that, outliers are detected.
The approach for the DS encoding using a two
stage process is adapted from (Zhao et al., 2021). But
instead of using image representations of the scenes,
a set-based representation is used as input. Using im-
ages leads to sparse inputs with strong focus on the
street level, leading to issues during representation
learning. First, each frame is encoded using the frame
autoencoder. The purpose of the frame autoencoder
is to generate a semantically meaningful and fixed-
length representation for each time step. Those frame
embeddings are then encoded again using an RNN au-
toencoder to find one embedding for each DS instance
as a sequence of frame embeddings to allow outlier
detection within fixed-length DS representations.
3.2.1 Frame Autoencoder
The design of the frame autoencoder is depicted in
Figure 3. Each frame contains three distinct pieces of
information that need to be treated differently. The
core is an autoencoder. It encodes and decodes a con-
catenation of a street set vector, traffic set vector, and
ego speed into a 64-element embedding vector us-
ing fully connected layers and ReLU non-linearities.
The expectation is that the embedding produced by
the core autoencoder is more semantically rich than
a simple concatenation, as the input data are fused
together within the bottleneck layer. The street set
vector and traffic set vector are generated from the
corresponding sets (cf. Section 3.1.1) by two adapted
FSPool (Zhang et al., 2020) encoder-decoder pairs.
The autoencoder itself uses the triplet loss similar to
(Zhao et al., 2021) in addition to the reconstruction
loss. This triplet loss ensures two things for frame
representations in the embedding space:
• All frames from the same track are represented
closer to each other than to frames from different
tracks.
• Frames from the same track that are temporarily
close are represented closer to each other than to
temporally distant frames.
3.2.2 Driving Scenario Autoencoder
The DS autoencoder leverages the frame embeddings
learned by the frame autoencoder. The structure
brought to the frame embeddings’ relations through
the triplet loss is crucial for the DS autoencoder, as
it makes them semantically more meaningful. This is
required to further process them using RNNs. The de-
sign of the DS autoencoder is shown in Figure 4. All
three RNNs depicted are implemented as two-layered
LSTM networks
The input to the DS autoencoder are the different
segments of the whole track as sequences of frames
(cf. Section 3.1.2). The encoder only processes the
frames with an even index, and an embedding is de-
rived from the final state of the RNN. This embedding
is used as initial states for the predictor and recon-
structor. The predictor receives the even frames and
VEHITS 2024 - 10th International Conference on Vehicle Technology and Intelligent Transport Systems
34

Figure 3: Frame autoencoder design. The functions ϕ
encode
and ϕ
decode
are both, two layer fully connected networks with a
ReLU activation function in between the layers.
predicts the subsequent odd frames. The reconstruc-
tor’s goal is to reconstruct the input sequence from the
DS embedding in reverse order. This is supported by
a linear layer ϕ
scenario
projecting the DS embedding
into the right size to be used as an input for each time
step to promote sequence learning.
For effective outlier detection based on the em-
beddings, a semantic meaningful embedding space is
required. To achieve this semantic richness, a super-
vised contrastive loss adapted from (Vaze et al., 2022)
is added. This loss adds a soft similarity constraint for
the defined DSs to ensure that instances of the same
DS are closer together in the embedding space.
3.2.3 Outlier Detection
By processing the trajectory data using the two con-
secutive autoencoders, we achieve a dimensionally re-
duced but still semantically rich representation of the
DSs. Based on this embedding, it is feasible to detect
outliers using the k-th nearest approach (Ramaswamy
et al., 2000). The top n DS instances with the highest
score, meaning that they have the highest distances to
their k-th nearest neighbour, are classified as outliers
and thus as potential ECs.
3.3 Validation Method
Validating the detection approaches is a crucial but
challenging task. Evaluating, if an identified DS in-
stance is an EC in an automated way requires having
the actual ADS available to test the DS instance. Of-
ten, this is not available or the EC detection task is
not limited to one specific ADS. With the presented
approach, it is the goal to find DS instances, which
are unlikely to be already considered by AD devel-
opers. Therefore, we propose an expert survey ad-
dressing AD developers for validating EC detection
methods. The idea behind this validation approach is
to use the intuition of the AD developers as potential
users of ECs for improving their ADS.
The expert survey has two goals. The first goal
(a) is to verify that the DS instances found by the EC
detection algorithms are unusual. The second goal (b)
is to validate that the DS instances found by the EC
detection algorithm are actual ECs.
To address the first goal (a), a selection of DS in-
stances are shown to the survey participants as short
videos from the birds-eye perspective. The DS in-
stances consist of the n DS instances with the high-
est score and m randomly selected DS instances from
the base dataset. The hypothesis is that the n DS in-
stances with the highest anomaly score are more un-
usual than the m randomly selected DS instances from
the base dataset For each DS instance, they need to
give a rating from ”normal” to ”very unusual”. In this
first stage, the term edge case is not used to not bias
the participants and only get a statement regarding the
unusualness.
The second goal (b) of the survey is to validate
if actual ECs are detected. This stage is required, as
there can be DS instances with a high score, but the
anomaly leading to this is not relevant for the usage
of ECs. To address this second goal, the participants
are asked, after inspecting all DS instances, if they
consider at least one of the presented DS instances an
EC.
4 RESULTS
The developed EC detection approach is evaluated on
trajectory data recorded on motorways. First, the data
Detecting Edge Cases from Trajectory Datasets Using Deep Learning Based Outlier Detection
35
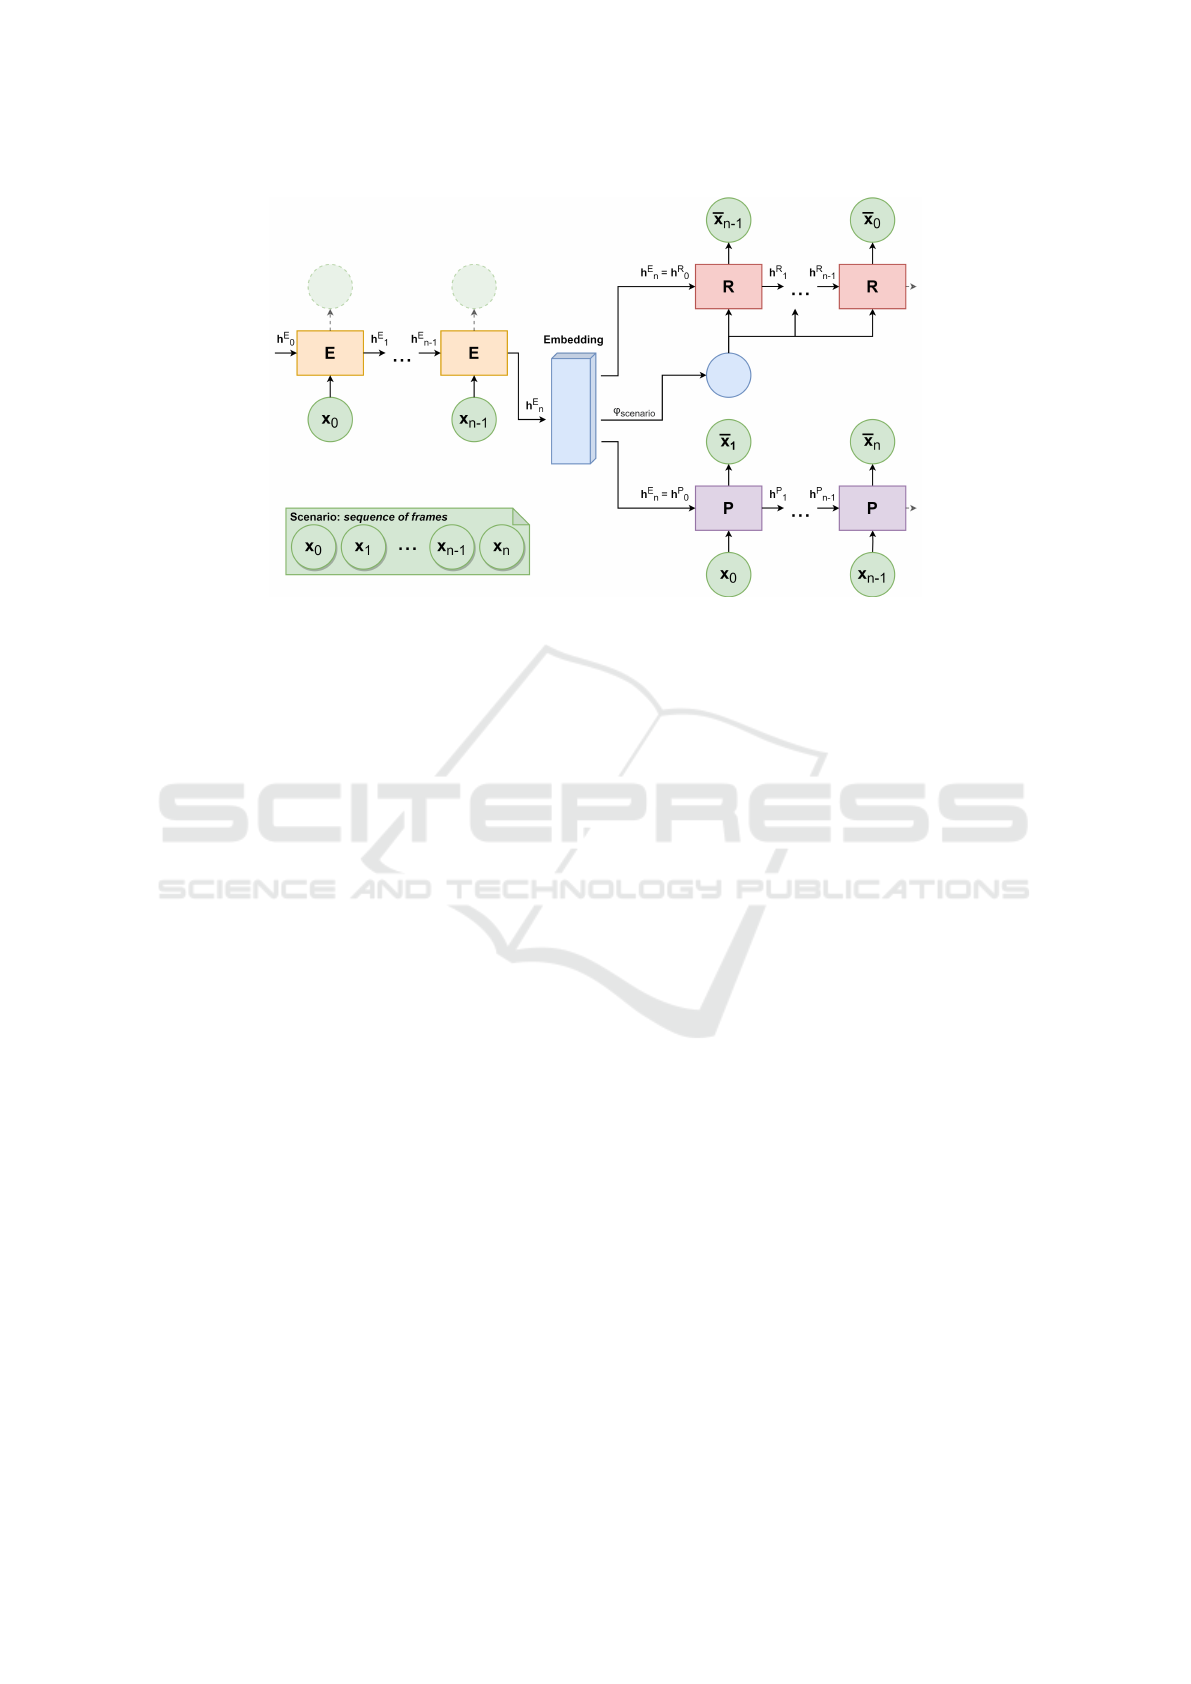
Figure 4: The RNNs are shown in unfolded view. The Encoder is labelled with E. The reconstructor as R, the predictor as P.
is presented in detail. After that, the results of the au-
toencoders calculating the embeddings are presented
as a basis for the actual outlier detection. Finally, the
results of the expert survey are shown for validating
the approach.
4.1 Data for Evaluation
The developed approach is evaluated on the exiD
dataset (Moers et al., 2022). The dataset contains real
world traffic recordings comprising approximately 16
hours of footage leading to nearly 70,000 trajectories
captured by drone. The footage specifically focuses
on seven distinct entrances and exits of German Au-
tobahn sections. These recordings present a field of
view of approximately 400 meters at each location.
Within the exiD dataset, interesting interactions are
expected due to the ramps.
The dataset is converted to the required format de-
scribed in Section 3.1.1. From the dataset, 50,000
tracks are selected randomly. Each vehicle in the
dataset is treated as an ego vehicle once, resulting
in approximately 210 hours of combined ego driving
footage at 5 Hz frame rate. The segmentation (cf.
Section 3.1.2) results in approximately 100,000 DS
instances.
4.2 Edge Case Detection Results
The basis for the detection of ECs using outlier de-
tection is a semantically rich DS embedding. In the
following section, the results of the autoencoders are
presented.
4.2.1 Scenario Encoding Results
One indicator for checking the performance of the
frame autoencoder is the reconstruction error. We
achieve a meaningful frame embedding when we have
low reconstruction errors for the street set and the traf-
fic set. The resulting reconstruction error of the points
in the 2D point cloud are 0.22 m for the x and 0.17 m
for the y value.
The average error is in the order of magnitude of
ten centimetres. Compared to the regular lane width
of the lanes on German Autobahn of 3.5 to 3.75 me-
tres, this error is in an acceptable range. The same
is valid for the reconstruction error of the traffic set
depicted in Table 1. Deviations in the given order of
magnitude do not change the overall driving situation
and the interactions.
Unlike the frame autoencoder, the DS autoencoder
operates on frame vectors received from the frame au-
toencoder, instead of raw input variables. As a result,
the reconstruction error cannot be meaningfully inter-
preted, both in terms of reconstruction and prediction
errors. By analysing the resulting embedding space,
we found out that the lane changes to the left and
those to the right are largely separated without hav-
ing this explicitly included during the training pro-
cess. This gives at least indication on the semantic
richness of the embedding space.
4.2.2 Outlier Detection Results
The resulting DS embeddings are used to detect out-
liers applying the k-th nearest neighbour metric (Ra-
maswamy et al., 2000), where k = 10. The anomaly
scores of the DS instances, represented by the dis-
VEHITS 2024 - 10th International Conference on Vehicle Technology and Intelligent Transport Systems
36
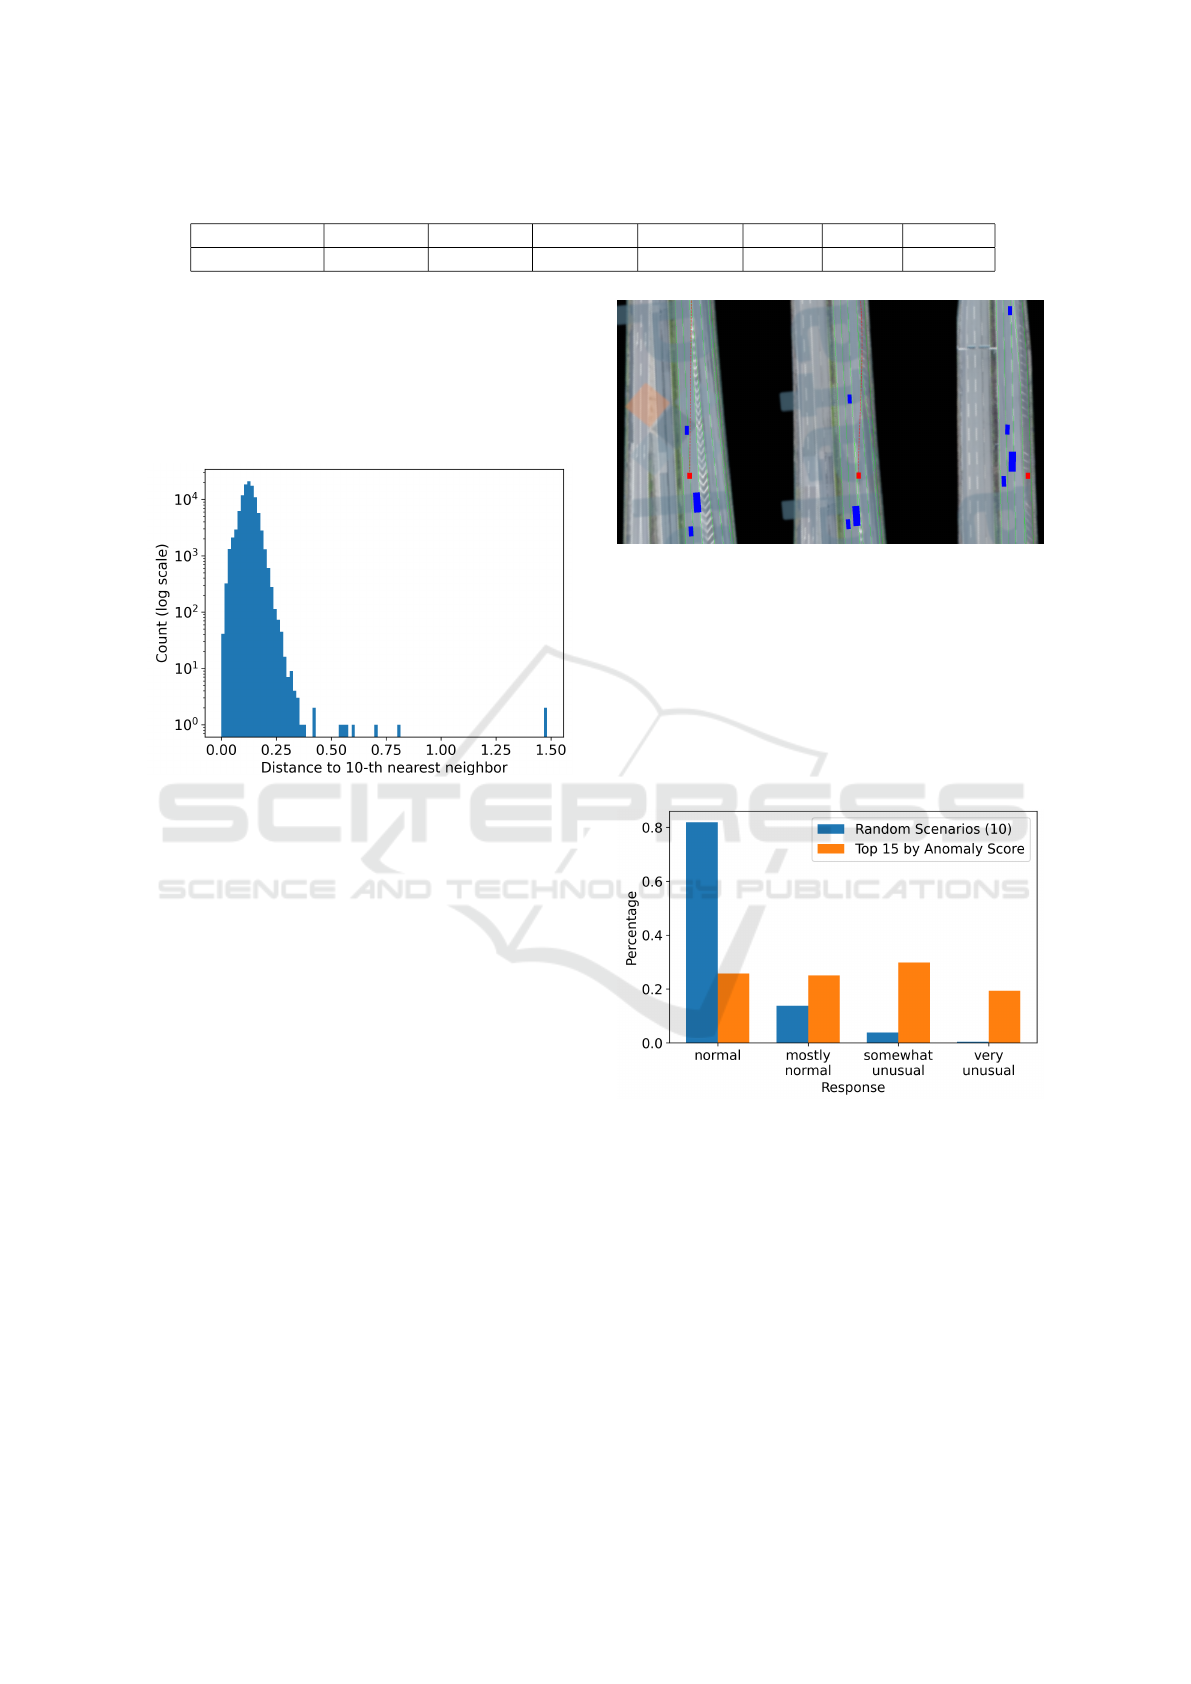
Table 1: Average error over all frames for the traffic set.
Parameter Position x Position y Velocity x Velocity y Width Length Heading
Average error 0.39 m 0.39 m 0.42 m/s 0.21 m/s 0.04 m 0.13 m 1.17 deg
tance to the tenth nearest neighbour, are depicted as
a histogram in Figure 5. It indicates that distance
scores above 0.35 are exceptionally uncommon, en-
compassing approximately 15 out of the 100,000 DS
instances. Therefore, n is set to 15. Beneath an
anomaly score of 0.35, the histogram shows roughly
a Gaussian distribution.
Figure 5: Histogram of the 10-th neighbour distances.
Within those DS instances with the highest
anomaly scores, different interesting phenomena are
present. Two instances revealed errors in the dataset.
One object was detected as driving backwards with
a high velocity due to a detection error. The second
error found was the detection of one vehicle as two
overlaying objects. Detecting those errors gives a first
indication that unusual characteristics are found.
But also within the top DS instances with correct
data, unusual situations happened, like a truck abort-
ing exiting the motorway and driving with low speed
from the exit lane back onto the Autobahn. Another
example is depicted in Figure 6. It shows three frames
of an unusual segment in the data. The ego vehicle
is driving on the left lane, then doing multiple lane
changes also crossing a solid line and finally stopping
on the emergency lane.
4.3 Expert Survey Results
To quantify those qualitative findings, an expert sur-
vey is conducted. The survey is conducted with the
top n = 15 DS instances, excluding the dataset er-
rors. In addition, m = 10 DS instances are selected
randomly from the dataset as a baseline.
In the first stage of the survey, 21 AD develop-
ers were asked to rate how unusual (cf. Section 4.3)
Figure 6: Three frames of a DS instance extracted from
exiD (Moers et al., 2022) where the ego vehicle (red)
crosses multiple lanes to get onto the right shoulder.
the individual DS instances are based on a top view
video similar to the frame representation in Figure 6.
The aggregated results of this survey are aggregated
in Figure 7. While the baseline is considered rather
normal, the rating of the top 15 DS instances de-
tected with the presented approach is rather equally
distributed.
Figure 7: Histogram of how often a response label is as-
signed to the control group of ten randomly selected DS
instances versus the test group of top 15 anomaly score in-
stances.
In the second stage of the survey, approximately
80 percent of the respondents indicated that there was
an EC within the presented 25 DS instances. Approx-
imately half of the experts explicitly mentioned the
DS instance depicted in Figure 6 as an EC.
Detecting Edge Cases from Trajectory Datasets Using Deep Learning Based Outlier Detection
37

5 DISCUSSION
The low reconstruction loss for the frame embeddings
and the implications of visualizing the DS embed-
dings indicate that using the developed approach, it
is possible to calculate semantically rich embeddings
for the analysed data. This is the basis for detecting
outliers based on those DS embeddings.
The clear tendency in the survey towards rat-
ing the detected outliers as unusual verifies that the
method identifies rather unusual DS instances com-
pared to a random selection. This is supported by
the ability of finding dataset errors as unusual DS
instances. But still, some DS instances with a high
anomaly score are considered as normal by the ex-
perts. This indicates that there might be some features
in the DS embedding space making DS instances un-
usual that are not seen relevant by the asked experts.
On the other hand, the used dataset is still rather small
for the purpose of detecting real ECs. It is highly
unlikely that the analysed 100,000 motorway DS in-
stances contain a high amount of clear ECs. E.g. no
accidents are in the data. In general, the majority of
the experts indicates that the developed approach is
capable of detecting unusual DS instances that can be
considered as ECs.
6 CONCLUSIONS
In this work, we presented an approach for detect-
ing edge cases in trajectory data using deep-learning
based outlier detection. This two-staged approach en-
codes the data of the dynamic objects and the street
layout first for each time step based on an autoen-
coder. Second, the resulting per-time-step embed-
dings are aggregated over the duration of basic driving
scenarios DS based on an RNN autoencoder. Those
driving scenarios are used to segment the continuous
driving data into less complex segments. Based on
the calculated driving scenario embeddings, outliers
are detected using the k-th nearest neighbour metric.
The approach was evaluated on motorway data from
the exiD drone dataset. The results were validated
with an expert survey containing identified potential
edge cases as well as randomly selected driving sce-
nario instances. The survey showed that using the de-
veloped approach, we were able to identify unusual
driving scenario instances that can be considered as
edge cases.
For future work, the approach will be extended
for urban data as the situations happening on urban
domain are more diverse, leading to more challeng-
ing outlier detection and requiring larger amounts of
data. The identified edge cases will be collected in
a database developed within the Hi-Drive project to
allow test case derivation for AD development.
ACKNOWLEDGEMENTS
The research leading to these results has received
funding from the European Union’s Horizon 2020 re-
search and innovation programme under grant agree-
ment No 101006664. The sole responsibility of this
publication lies with the authors. The authors would
like to thank all partners within the Hi-Drive project
(hi-drive.eu) for their cooperation and valuable con-
tribution.
REFERENCES
Bjorvatn, A., Page, Y., Fahrenkrog, F., Weber, H.,
Aittoniemi, E., Heum, P., Lehtonen, E., Silla,
A., B
¨
argman, J., Borrack, M., et al. (2021).
L3Pilot deliverable D7.4: Impact evaluation results.
https://l3pilot.eu/downloads.
Breitenstein, J., Termohlen, J. A., Lipinski, D., and Fin-
gscheidt, T. (2020). Systematization of corner cases
for visual perception in automated driving. In
2020 IEEE Intelligent Vehicles Symposium (IV), pages
1257–1264. IEEE.
Han, S., Hu, X., Huang, H., Jiang, M., and Zhao, Y. (2022).
ADBench: Anomaly detection benchmark. Advances
in Neural Information Processing Systems, 35:32142–
32159.
Harmening, N., Bilo
ˇ
s, M., and G
¨
unnemann, S. (2020).
Deep representation learning and clustering of traffic
scenarios. arXiv preprint arXiv:2007.07740.
Koopman, P. and Wagner, M. (2017). Autonomous vehicle
safety: An interdisciplinary challenge. IEEE Intelli-
gent Transportation Systems Magazine, 9(1):90–96.
Moers, T., Vater, L., Krajewski, R., Bock, J., Zlocki, A., and
Eckstein, L. (2022). The exiD dataset: A real-world
trajectory dataset of highly interactive highway sce-
narios in germany. In 2022 IEEE Intelligent Vehicles
Symposium (IV), pages 958–964. IEEE.
Pang, G., Shen, C., Cao, L., and Hengel, A. V. D. (2021).
Deep learning for anomaly detection: A review. ACM
computing surveys (CSUR), 54(2):1–38.
Poggenhans, F., Pauls, J.-H., Janosovits, J., Orf, S., Nau-
mann, M., Kuhnt, F., and Mayr, M. (2018). Lanelet2:
A high-definition map framework for the future of
automated driving. In 2018 21st International Con-
ference on Intelligent Transportation Systems (ITSC),
pages 1672–1679. IEEE.
Ponn, T., Breitfuß, M., Yu, X., and Diermeyer, F. (2020).
Identification of challenging highway-scenarios for
the safety validation of automated vehicles based on
VEHITS 2024 - 10th International Conference on Vehicle Technology and Intelligent Transport Systems
38

real driving data. In 2020 Fifteenth International Con-
ference on Ecological Vehicles and Renewable Ener-
gies (EVER), pages 1–10. IEEE.
Ramaswamy, S., Rastogi, R., and Shim, K. (2000). Efficient
algorithms for mining outliers from large data sets. In
Proceedings of the 2000 ACM SIGMOD international
conference on Management of data, pages 427–438.
Riedmaier, S., Ponn, T., Ludwig, D., Schick, B., and Dier-
meyer, F. (2020). Survey on scenario-based safety
assessment of automated vehicles. IEEE Access,
8:87456–87477.
Scholtes, M., Westhofen, L., Turner, L. R., Lotto, K.,
Schuldes, M., Weber, H., Wagener, N., Neurohr, C.,
Bollmann, M. H., K
¨
ortke, F., et al. (2021). 6-layer
model for a structured description and categoriza-
tion of urban traffic and environment. IEEE Access,
9:59131–59147.
Sonntag, M., Weber, H., Rahmani, S., Gelder, E. d., and
Eckstein, L. (2023). Hi-Drive driving scenario con-
cept. Zenodo. 10.5281/zenodo.8207762.
Souflas, I., Lazzeretti, L., Ahrabian, A., Niccolini, L., and
Curtis-Walcott, S. (2022). Virtual verification of de-
cision making and motion planning functionalities for
automated vehicles in urban edge case scenarios. SAE
International Journal of Advances and Current Prac-
tices in Mobility, 4(2022-01-0841):2135–2146.
Ulbrich, S., Menzel, T., Reschka, A., Schuldt, F., and Mau-
rer, M. (2015). Defining and substantiating the terms
scene, situation, and scenario for automated driving.
In 2015 IEEE 18th International Conference on Intel-
ligent Transportation Systems, pages 982–988.
Vater, L., Sonntag, M., Hiller, J., Schaudt, P., and Eckstein,
L. (2023). A systematic approach towards the defi-
nition of the terms edge case and corner case for au-
tomated driving. In 2023 3rd International Confer-
ence on Electrical, Computer, Communications and
Mechatronics Engineering (ICECCME).
Vaze, S., Han, K., Vedaldi, A., and Zisserman, A. (2022).
Generalized category discovery. In Proceedings of the
IEEE/CVF Conference on Computer Vision and Pat-
tern Recognition (CVPR), pages 7492–7501.
Yang, J., Zhou, K., Li, Y., and Liu, Z. (2021). Generalized
out-of-distribution detection: A survey. arXiv preprint
arXiv:2110.11334.
Zhang, Y., Hare, J., and Pr
¨
ugel-Bennett, A. (2020). FSPool:
Learning set representations with featurewise sort
pooling. arXiv preprint arXiv:1906.02795.
Zhao, J., Fang, J., Ye, Z., and Zhang, L. (2021). Large scale
autonomous driving scenarios clustering with self-
supervised feature extraction. In 2021 IEEE Intelli-
gent Vehicles Symposium (IV), pages 473–480. IEEE.
Detecting Edge Cases from Trajectory Datasets Using Deep Learning Based Outlier Detection
39
