
Performance Metric for Horn and Brake Automation on Mainline Trains
Rustam Tagiew
a
and Christian Klotz
b
German Centre for Rail Traffic Research (DZSF)
∗
at the Federal Railway Authority,
August-Bebel-Str. 10, Dresden, Germany
Keywords:
Driverless Train Operation, Computer Vision, Performance Metric.
Abstract:
This paper argues for the introduction of a mainline rail oriented end-user performance metric for driver-
replacing on-board perception systems. Perception at the head of a train is analysed and divided into several
subfunctions. This paper presents a preliminary submetric for the obstacle detection subfunction, focusing
on false-negatives. To the best of the authors’ knowledge, there is no other such proposal for rail on-board
perception systems. A set of submetrics for the subfunctions should facilitate the end-user oriented comparison
of perception systems and guide the measurement of human driver performance. It should also be useful for
a standardised predictive assessment of the number of accidents for a given perception system in a given
operational design domain. In particular, for the proposal of the obstacle detection submetric, practitioners
among the readership are invited to provide their feedback and quantitative information to the authors. In
addition to the interim feedback, the analysis results of the full feedback will be published later.
1 INTRODUCTION
Driverless and unattended train operation (DTO and
UTO) have several advantages (Singh et al., 2021), in-
cluding increased capacity, reliability, service flexibil-
ity, energy efficiency, and alleviation of driver short-
ages. So far, these advantages can only be realised
in the case of metros and other trains without signifi-
cant exogenous influences. “AutoHaul” (Yusuf et al.,
2020) is the only known mainline rail system to im-
plement UTO. It is a heavy-haul train that operates
regularly in a sparsely populated area and relies solely
on collision detection rather than contactless auto-
matic perception. DTO for mainline trains is still an
unresolved challenge in most cases. The crucial dif-
ference is that on most mainline tracks the exogenous
influences are significant and large scale fencing or
walling is usually not economically justifiable and has
not been proven to be sufficiently effective.
Mainline rail automation is related to road traffic
automation and can benefit from technology transfer.
It requires the development of an on-board AI system
cabable of multi-sensory perception. However, a lit-
a
https://orcid.org/0000-0002-7892-6351
b
https://orcid.org/0000-0001-5814-7193
∗
This work originated within the tasks of the DZSF and
is not an official statement, guideline or directive of the Fed-
eral Railway Authority.
erature review showed an order of magnitude lower
research activity for rail than for road (Tagiew et al.,
2023). It also showed insufficient progress – the cur-
rent technology readiness level (TRL) for on-board
collision prediction is 5 and has not been exceeded for
two decades. A key finding was the lack of a widely
accepted end-user performance metric that could link
rail safety requirements with the perception system
development community.
This paper addresses the lack of an end-user per-
formance metric for rail on-board AI perception sys-
tems. Such a performance metric would, on the
one hand, provide developers with clear application-
oriented goals, make their results comparable and, on
the other hand, make progress measurable for out-
siders. The paper proposes a preliminary performance
submetric for the major subfunction of obstacle de-
tection, which primarily improves measurement of
false-negative detection of obstacles. Based on this
proposal, a discussion can be started and first per-
formance results of perception systems can be com-
pared. Practising readers of this paper are encouraged
to actively submit either the performance data of their
systems or their suggestions for improving the per-
formance submetric to the author by any appropriate
means. In addition, this paper introduces the state of
the art to developers unfamiliar with railways, in or-
der to facilitate the research.
212
Tagiew, R. and Klotz, C.
Performance Metric for Horn and Brake Automation on Mainline Trains.
DOI: 10.5220/0012553100003702
Paper published under CC license (CC BY-NC-ND 4.0)
In Proceedings of the 10th International Conference on Vehicle Technology and Intelligent Transport Systems (VEHITS 2024), pages 212-219
ISBN: 978-989-758-703-0; ISSN: 2184-495X
Proceedings Copyright © 2024 by SCITEPRESS – Science and Technology Publications, Lda.
Contactless perception
Collision prediction
Obstacle detection RoI determinationDistance estimation
Obstacle trajectory prediction, intention recognition and other
predictive functions
Visual inspection of
infrastucture and rolling stock
Visual and acoustic signal recognition
(for GoA0 and GoA1 only)
Visual Odometry
Collision detection
Overrun event detection Impact detection
Perception at the head of a train
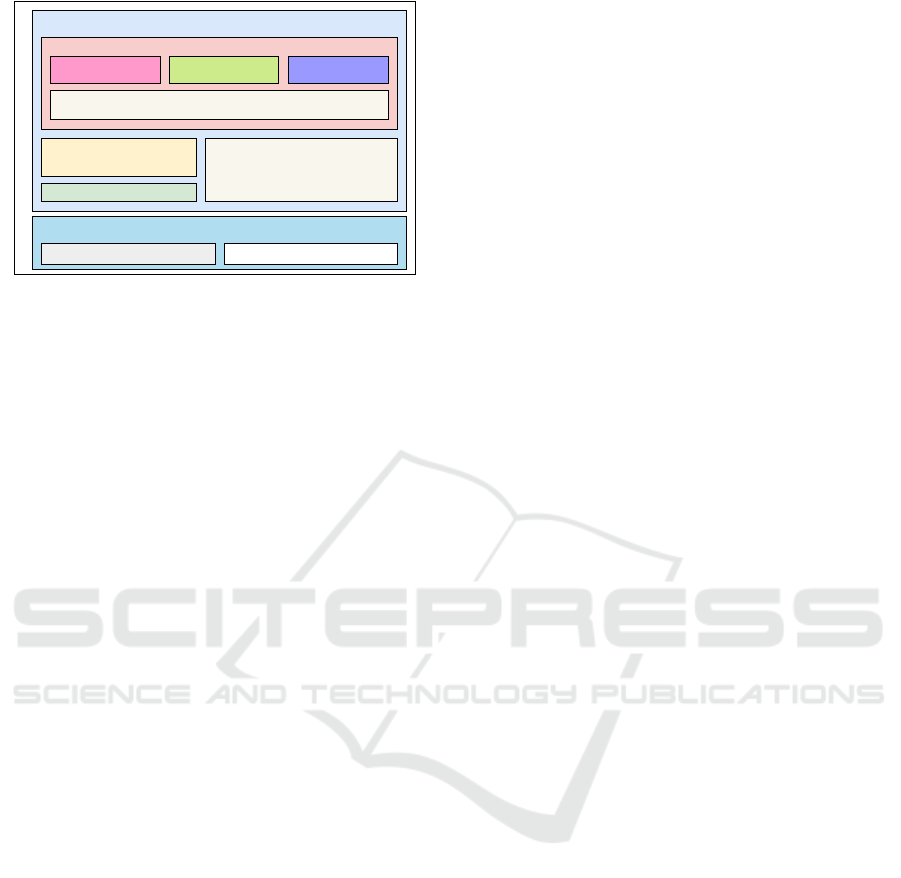
Figure 1: Rough categorization of system’s functions for
mainline DTO, which in comparison to DTO of metros, re-
quire additional technological effort (Tagiew et al., 2023).
2 SUBFUNCTIONS
AI perception systems that replace human staff on
mainline trains need to perform multiple functions.
Considering the current state of the art, these func-
tions will not represent the full range of human ca-
pabilities one-to-one, but only cover the most rele-
vant functions with at least the same or higher level
of performance. Non-implemented functions might
be compensated by higher performance of the im-
plemented functions. For example, infrared sensors
for better night vision could compensate for poorer
intention recognition of humans. The functions can
be divided into two main sub-functions, the percep-
tion of objects with and without physical contact
(fig.1). Fig.1 does not include many subfunctions,
such as door operation monitoring, emergency detec-
tion, crime detection, etc.
Perception by contact with objects is referred
to here as collision detection and replaces the train
driver’s acoustic and haptic sensation. Already in EN
62267, a standard for driverless metros, it is men-
tioned that a collision has to be detected at the latest
at the contact with an obstacle. In the special case of
shunting, controlled collisions such as running into a
drag shoe or coupling of cars are part of normal op-
eration. In all other cases, collisions with objects are
unwanted, dangerous accidents that cannot always be
avoided and must always be detected. Two types of
collisions can be identified so far, impact and overrun
events. The detection of impact events is referred to
here as impact detection. For mainline railways, little
research on impact detection and only one seminal re-
search on overrun event detection systems (Herrmann
et al., 2023) are known. Collision detection is there-
fore at a very early stage of development.
Contactless obstacle detection replaces human vi-
sion from the cab. It encompasses several tasks, of
which collision prediction is the most challenging
(Leinhos et al., 2022). It is assumed that collision pre-
diction is always prone to errors, false negatives and
false positives, and therefore cannot make collision
detection obsolete.
Visual inspection of infrastructure and rolling
stock is more important for mainline railways than for
metros due to greater exogenous influences and larger
operating areas, and is not only important for predic-
tive maintenance. There are also cases such as sun
kinks, catenary damage, broken signals, malfunction-
ing railway crossing gates and slipping loads during
train meets that require emergency braking and are
therefore part of the driving function. Visual odom-
etry complements rotary encoders, inertial measure-
ment units (IMU) and sensors for global navigation
satellite system (GNSS).
Railway signals can be recognised from the ve-
hicle as if it were a human driver. There are sev-
eral groups of signals, which can be visual or audi-
ble. In case of shunting for the lowest grade of au-
tomation (GoA) 0, signals are e.g. fouling point in-
dicators at the railway switches. Although the detec-
tion of signals is ensured by automatic train stop in
case of GoA1, they still have to be recognised from
the vehicle. The challenge of signal detection also
includes detection of tracks and their assignment to
the signals (Petrovi
´
c et al., 2022; Staino et al., 2022).
From GoA2 on, most visual signals do not need to be
detected and are transmitted by cab signalling when
used with ETCS. The GoA2 is also conceptually fea-
sible if an automatic visual detection of signals assists
the driver (Hofmann et al., 2023).
Prediction of collision with obstacles requires al-
gorithms for obstacle detection, distance estimation,
region of interest (RoI) determination, obstacle trajec-
tory prediction, pedestrian intention recognition and
other predictive functions. Depending on the choice
of the operational design domain (ODD), some of the
functions, such as pedestrian intention recognition,
may be unnecessary. Obstacle detection can be fur-
ther divided into object detection, obstacle classifica-
tion and spatial angle determination. There are inter-
nal obstacles such as rail vehicles and buffer stops.
The external obstacles can be people, road cars, large
animals, trees, rocks, wrongly placed drag shoes,
floods, fires and similar. Obstacles do not only appear
on the ground, they might also hang on the catenary or
levitate in the air. For example, bicycles might hang
on the catenary (Augsburger Allgemeine, 2014; Ober-
hessische Presse, 2015; STIMME, 2021; RUHR24,
2022; Fr
¨
ankische Landeszeitung, 2022).
Distance estimation is important for shunting and
Performance Metric for Horn and Brake Automation on Mainline Trains
213

"ODD-Data"
Schedule, braking properties,
transported load and
passengers, route geometry,
probabilities for obstacles,
collision consequences ...
System's collision prediction and
collision detection for all relevant
conditions
Human collision prediction and
collision detection for all relevant
conditions
Explicit risk assessment
10
-7
per hour for one fatality and
10
-9
per hour for multiple fatalities
Reference system comparison
Figure 2: Data required for two currently available ap-
proaches of safety argumentation for European mainline
railway systems (Tagiew et al., 2022). The grey frame de-
notes the explicit risk assessment with resulting hourly fa-
tality rates and the maximal values of harmonized design
goals. The orange frame denotes the comparison with the a
human train driver as reference system.
also for detecting obstacles from long distances in
curves, where a relatively small distance error deter-
mines whether or not an object intersects with the
structure gauge (Gebauer et al., 2012). Spatial an-
gle determination together with distance estimation is
referred to as obstacle localisation.
For the RoI determination, a 3D tubular space
formed by the predicted train’s driveway and the
structure gauge should be determined in the scene.
Train’s driveway is also known as train’s path (Risti
´
c-
Durrant et al., 2021). The structure gauge is supple-
mented with a speed-dependent hazard zone for peo-
ple, which arises due to wind drag of the train (GUV-
R 2150, 2008). In the rare case that the states of the
switches are not otherwise available to the perception
system, they must be extracted from the visual input
for the train’s path prediction.
3 SAFETY ARGUMENTATION
All subfunctions, described in Sec.2, require
performance-indicating submetrics for all relevant
stakeholders, especially the developers and the reg-
ulators. Safety relevant functions for European main-
line railways are approved according to the EU Reg-
ulation No. 402/2013 (CSM-RA) (European Union,
2013). Herein, performance metrics are needed,
which allow proof of compliance with standards,
comparison with human performance or calculation
of resulting hourly fatality rates. Since there are still
no standards for this, only two remaining approaches
of safety argumentation are available (fig.2). These
are the reference system comparison and explicit risk
assessment according to harmonised design goals.
As depicted in fig.2 for collision risks, both ap-
proaches need performance data of the system’s col-
lision prediction and collision detection for all rele-
vant conditions. Explicit risk assessment requires ad-
ditional data to calculate, whether the probability of
an accident with a single fatality is lower than 10
−7
and for an accident with more than one fatality is
lower than 10
−9
. This additional data includes sched-
ule, braking properties, route geometry, probabilities
for obstacles, collision consequences, acoustic prop-
erties for warning horn, transported load and passen-
gers. This data describes the ODD of a train and is
called here ”ODD-Data”. Instead of ODD-Data, the
reference system comparison needs performance data
of human collision prediction and collision detection
for all relevant conditions.
4 OBSTACLE DETECTION
To justify performance metrics, this section provides
a detailed analysis of obstacle detection in the rail-
way domain with a focus on safety. Commonly used
performance metrics for image processing do not cor-
relate well with the safety argumentation. Reference
system comparison requires metrics applicable for
both humans and machine. Explicit risk assessment
requires domain-specific redesign and adjustment of
the metrics. In particular, the performance metric in-
tersection over union (IoU), which is oriented to the
2D space of camera images, could mislead the devel-
opment of a perception system. Even in 3D space,
IoU still requires a safety-oriented weighting of the
spatial direction of the mismatch between prediction
and ground truth. Mean average precision (mAP)
based on IoU provides a value only for single shot
prediction, not for a sequence of images of a train ap-
proaching an obstacle.
According to Eurostat statistics for 2021 in the
EU (EUROSTAT, 2022), 64.5% of fatalities result
from accidents to persons by rolling stock in mo-
tion, 34.3 % from level crossing accidents including
pedestrians and only 1.2 % from railway vehicle col-
lisions and other accidents. The portion of pedestri-
ans in level crossing accidents can be assumed to be
14.6% based on German statistics by Deutsche Bahn
(Deutsche Bahn, 2019) for 2018. Therefore, the most
probable fatal type of an accident is collision with a
person at roughly 70%. Second most probable acci-
dent type is collision with a road car at roughly 24%.
The circumstances that can lead to accidents are
also known as critical scenarios according to ISO
34502 (ISO 34502, 2022) and hazardous situations
according to IEC 62267 (IEC 62267, 2009) and ISO
VEHITS 2024 - 10th International Conference on Vehicle Technology and Intelligent Transport Systems
214
0 5 10 15 20 25
Distance available for emergency breaking in m
Seconds for the warning horn to be heard (Effective range is 350m)
−100 −50 0 50 100 150 200 250 300 350 400 450 500 550 600 650 700
2 fatalities, both drivers
Severe injury of train driver
Risk of derailment
Fatality of car driver
Severe injury of car driver
No collision
185 190 195 200 205 210 215 220
Risk area at the obstacle im cm (dashed)
t =
1
a
(
v 0m ≤ d < 350 m
p
v
2
− 2a(d − 350m) 350m ≤ d ≤ 652 m
!
−
p
v
2
− 2ad
!
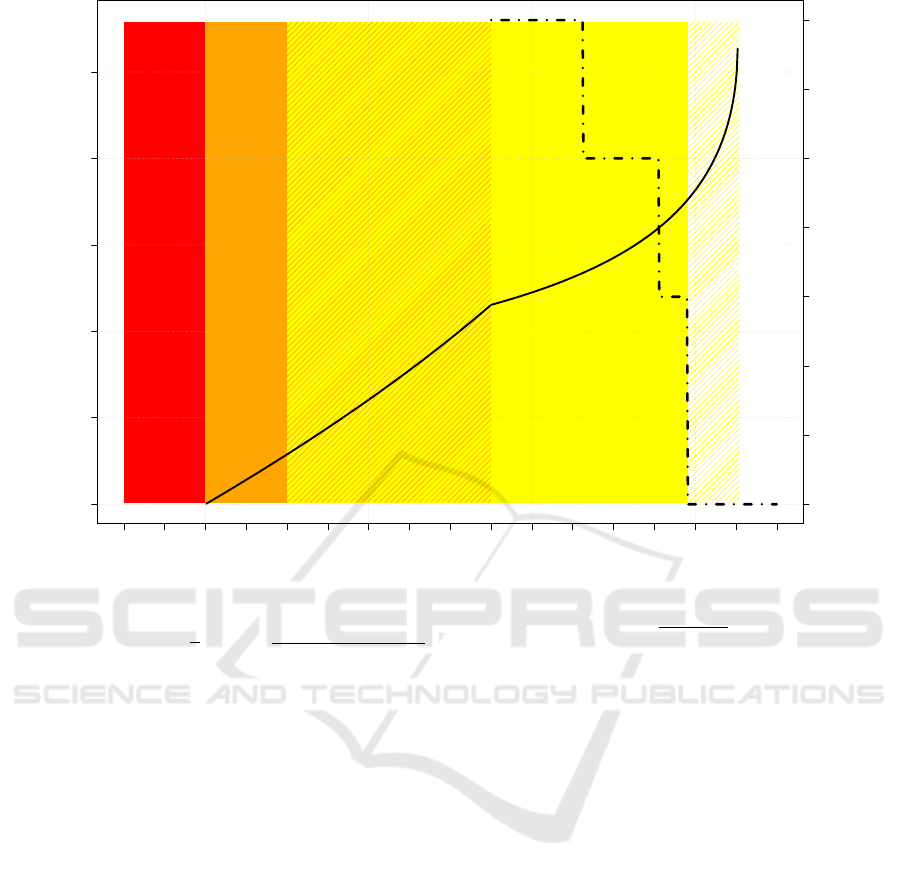
Figure 3: Estimated consequences for a frontal collision of a train going at 130
km
/h with a stationary passenger car depending
on braking distance (Tagiew et al., 2022). The braking deceleration is set to be 1
m
/s
2
. The driver can hear the warning horn
at a distance of 350m or less and may be able to escape. Negative distances mean the onward movement of an unbraked
collided train. Warning horn and emergency braking start simultaneously. The solid kinked curve shows the number of
seconds between hearing the warning horn by the car driver and the collision. The formula for this curve is added below the
graph and provides an explanation for the kink (t-time, a-decceleration, v-speed, d-distance). The dashed zigzag line depicts
the size of the risk area at the collision site. For the sake of simplicity, it is assumed in this that the derailment risk in this
example is only present in collisions at speeds of 130
km
/h and above.
22737 (ISO 22737, 2021). For the sake of simplicity,
the term scenario is used to refer to these in this paper.
Both the most common scenarios on railways,
pedestrian and car collisions, are also the most com-
mon on roads (BASt, 2023). Unlike road vehicles,
emergency braking and warning horn are the only re-
actions available on rail vehicles. The braking dis-
tance for rail vehicles is approximately 5 times longer
than for road vehicles. The ≈ 15dB(A) louder warn-
ing horn can and should be heard from larger dis-
tances (StVZO, 2016; Sch
¨
one and Bagola, 2013).
This changes the minimum acceptable performance
of collision prediction and requires long range object
detection (LROD). Due to curves, weather and light
conditions, LROD is not always possible. Whereas
for road vehicles, collision prediction enables colli-
sions to be mostly avoided, for rail vehicles it is more
a matter of damage limitation and deference.
Collision with a person causes a fatality for all
ego vehicle speeds in case of railways as according
to DIN VDE V 0831-103. However, out of a total of
695 accidental fatalities and serious injuries in 2021
in EU caused by rolling stock in motion, 36.5% were
seriously injured, i.e. survived (EUROSTAT, 2022).
When a deadly collision with a person cannot be pre-
vented, the braking must be applied to preserve the
dignity of the dead, to facilitate investigation by au-
thorities and prevent exposure to casual bystanders.
This is also important for the more than 2000 rail sui-
cides in EU each year, which are not counted as acci-
dents. Warning horn and braking is never too late and
has to be done as soon as possible in this scenario.
Performance Metric for Horn and Brake Automation on Mainline Trains
215

Table 1: Human detection of objects on railways in m.
Object Median
distance
of detection
fluorescent objects at night, 60
km
/h,
measurements/simulation (Itoh et al., 2001)
40 × 40 × 40cm 250
20 × 20 × 20cm 175
10 × 10 × 10cm 50
5 × 5 × 5cm < 25
measurements (Polz et al., 2003)
0.4m
2
& 2m
2
, 30% contrast > 750
2m
2
, 8% contrast 500
0.4m
2
, 8% contrast 240
2m
2
, 30% contrast, night 180
0.4m
2
, 30% contrast, night 60
0.4m
2
& 2m
2
, 8% contrast, night < 60
measurements (Mockel et al., 2003)
person in safety jacket 400
passenger car 300
person 240
passenger car, night < 60
person in safety jacket, night < 60
person, night < 60
statistics of accidents (Nakasone et al., 2017)
trees, 50-70
km
/h 60
fallen rocks, 20-120
km
/h 30
Collision with a passenger car is more intricate
scenario than with a person regarding the conse-
quences of different ego vehicle speeds. Fig.3 shows
the roughly estimated consequences for the collision
of a train travelling at 130
km
/h with a stranded pas-
senger car. For simplicity, a uniform emergency brak-
ing deceleration of 1
m
/s
2
without delay is assumed.
More realistic modeling would require consideration
of additional modifiers such as co-functioning of dif-
ferent types of brakes, sanding to improve adhesion,
and surge behavior of the liquid load. In the best
case, if the car is recognised at more than 652 m, the
emergency braking can prevent the collision. In the
worst case, if the car is not recognised before the col-
lision, the impact detection system should recognise
the crash and break to reduce the risk of a potential
derailment of the train. The LROD can not always
achieve the best case due to obstruction of view in
curves, through hilltop, weather conditions, insuffi-
cient illumination, as well as due to sudden intrusion
of a moving obstacle.
However, earlier braking between the best and
worst case reduces harm, which can be shown in our
example in fig.3. According to the risk model by
ENOTRAC (Moser and Schibig, 2017), the damage
of obstacles to a train grows with their mass and the
speed of the train. According to DIN VDE V 0831-
103, a crashing train with a speed higher than 40
km
/h
will cause fatality of the car driver. If the car driver
can escape the car after hearing the warning horn,
early braking gives more time for the resort depicted
as solid curve. The assumption for the maximal dis-
tance of 350 m at which the warning horn can be
heard by the car driver is derived from the German
regulation for the maximal distance between a rail-
way crossing and a whistle board (Volker Behrendt,
2012). A lower speed at the obstacle as a consequence
of early braking reduces the risk area created by air
stream around the vehicle depicted as dashed zigzag
line as according to the speed thresholds in the regula-
tion of German Statutory Accident Insurance (GUV-R
2150, 2008).
The distribution of distances, at which human
drivers detect objects on railway, has an irregular bell
shape (Tagiew et al., 2022). Tab.1 shows median dis-
tances for human performance at detecting objects on
the tracks from all known sources. According to these
measurements, a human driver can prevent collision
with the car only if the car is of contrasting paint and
is presented at daylight. At night without illumina-
tion, rainy weather and a decent car paint, the con-
sequences will be much more severe. The shapes of
the obstacle detection distances distribution are much
steeper for computer vision systems than for humans
(Mockel et al., 2003; Nakasone et al., 2017). One
source reports distances (Zhangyu et al., 2021), at
which first more or less erroneously placed boxes ap-
pear for target objects.
False-negative and false-positive obstacle detec-
tion may occur due to reproducible or irreproducible
failures in sensors and algorithms. The failures can
be assigned to certain functions in certain cases. For
example, objects such as stones and trees from the
perceived space outside of RoI may be detected as ob-
stacles due to wrong localisation of them or to wrong
localisation of RoI. The space perceived by sensors is
often larger than the 3D RoI, even in the presence of
view obstructions. Another example is small animals
that are recognised as obstacles because they are mis-
classified as humans or vice versa. Computationally,
moreover, false-positive visual detection, i.e., false
alarms, must occur much less frequently than false-
negatives, since the case of absent obstacle is over-
whelmingly predominant and obstacles are extremely
rare. Additionally, mainline rail vehicles’ emergency
brakes can not be interrupted until full stop in many
cases, obstruct the railway operation, damage to the
vehicles and constitute therefore a significant cost fac-
tor, which has to be considered in the performance
metrics. Since false-positive detection can not be out-
VEHITS 2024 - 10th International Conference on Vehicle Technology and Intelligent Transport Systems
216
10
-1
10
-2
10
-3
10
-4
10
-5
10
-6
10
-7
10
-8
100 200
300 400 500 600
700 800
False-positive braking/warning per hour
Minimal distance for X% of detected obstacles in m
Possible performance minima for braking
Possible performance minima for warning horn
System A
System B
Detection at contact
with an obstacle and
non-detection are
counted as same
Exemplary limit: 100 000 000 hours of sensor data
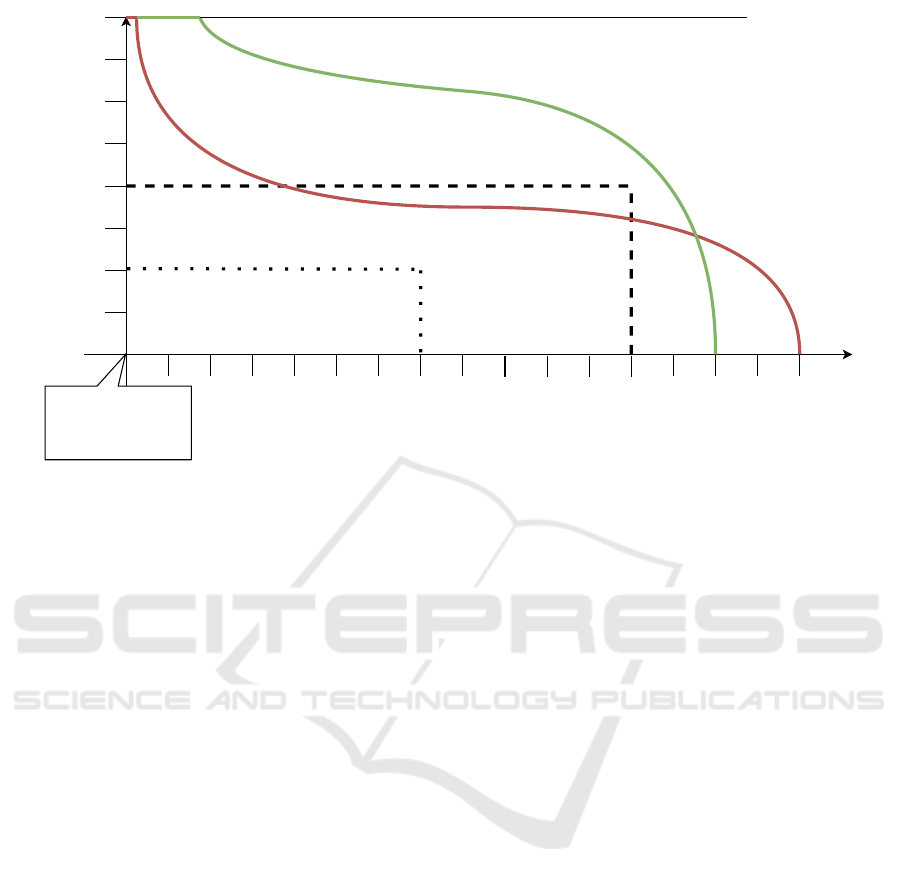
Figure 4: Performance submetric for obstacle detection with results of two hypothetical systems A and B. X can be replaced
by a positive number up to 100. A detection on contact with an obstacle and a non-detection are counted as the same.
ruled, collision prediction will be most probably com-
plemented by collision detection to refute false visual
detection (Tagiew et al., 2022).
5 PERFORMANCE SUBMETRIC
Fig.4 shows the proposed obstacle detection end-user
metric. This metric is designed for moving train. The
abscissa shows the distances, at which X% of appear-
ing obstacles are detected while approaching them.
(100 − X )% are detected at closer distances. Setting
X = 50 would denote a median distance for obstacle
detection. The ordinate shows hourly rates of false-
positive detections, which will cause unneeded warn-
ing horn and jam-creating emergency braking. The
values on the ordinate are negative logarithms of the
hourly rate, the lower the better. The performance val-
ues of a system on these two axes are interlinked and
can be adjusted by changing detection thresholds and
tweaking internal parameters of a system. Like with
precision-recall (PR) and receiver operating charac-
teristic (ROC) curves, increasing performance on the
one axis will most probably reduce performance on
the other axis.
The results according to this metric depend on the
number and type of obstacles, the speed of the ego
vehicle, the frame rate of the sensors, the track ge-
ometry, the time of day, the weather conditions, and
other properties of a data set used to validate a sys-
tem. The characteristics of the validation dataset will
most likely depend on a chosen ODD. The shape of
such performance curves is speculative and is shown
in Fig.4 for hypothetical systems A and B.
Both systems A and B have maximum ranges due
to their sensor resolutions. The measurement errors
of currently used sensors such as Lidar, RGB/IR cam-
era and Radar increase over longer distances (Leinhos
et al., 2022). Weather and light conditions can exac-
erbate this effect. Robust object detection using deep
neural networks requires a minimum number of pix-
els. Setting the internal thresholds of one system to
the extreme of permanent positive detection will give
the maximum range on the abscissa and 10
0
on the or-
dinate. The opposite extreme, where the system is in
permanent negative detection, will result in 0 on the
abscissa and 10
−H
on the ordinate. 10
−H
is the num-
ber of hours of sensor data available for evaluation
and is set to 100 million as an example. The shapes of
the curves in between for the hypothetical systems are
drawn based on intuition. From the shape of the curve
for the system A, it can be inferred that (100 − X)%
of car-collision scenarios will result in one or more
fatalities with this system adjusted to < 10
−4
false-
positives (fig.3). The system B has to be adjusted to
< 10
−3
false-positives, 10x more inappropriate stops,
to achieve the same level of safety.
Based on a certain ODD, there will be certain per-
formance minima for each of the axis. If the func-
tions of emergency braking and warning horn are
separated, the performance minima for both func-
tions can be different. In project KOMPAS, 10
−4
or
Performance Metric for Horn and Brake Automation on Mainline Trains
217

less false-positive emergency braking per hour is sug-
gested as the minimal acceptable performance (Polz
et al., 2003). Since false-positive warning horn does
not create jams on the railways, the minimal require-
ments can be much less rigorous. However, extensive
false-positive warning horn will probably not be wel-
comed by residents living close to the railway. For
orientation, this paper proposes a rate of 10
−2
cases
per hour as depicted in fig.4.
The issue with the minima for distances depends
stronger on ODD. Certain ego vehicle speeds, drive-
way geometries, weather and illumination conditions
either prohibit or do not demand LROD for safety
argumentation. For example in case of car-collision
scenario, warning horn is assumed to be effective a
most 350 m only. Low ego vehicle speeds or better
brakes result in lower distance requirements for ob-
stacle detection. If a typical curved route does not al-
low sensors to penetrate further forward than 600m,
a system will not be required to have a higher range.
Both minima are depicted in fig.4.
In the pedestrian-collision scenario, the emer-
gency braking function demands a system to over-
come simultaneously higher minima on both axes
than the warning horn function. In such case, system
A is better than system B for both functions. For the
pedestrian-collision scenario, effective distance for
warning horn can be significantly longer than brak-
ing way (Sch
¨
one and Bagola, 2013; Toward et al.,
2022) and that can make system B more appropriate
for warning horn subfunction, while system A is more
appropriate for emergency braking subfunction.
Once the performance minima are met, the order
of preference for both performance values becomes
important in the choice of system and system param-
eter configuration. This could lead to answers to ques-
tions such as how much resident annoying extra warn-
ing horn is justified to save the life of one unlawful
trespasser or one wild animal.
6 ONGOING CALL FOR DATA
The contents of this paper are recently uploaded as
preprint to elicit feedback from the research commu-
nity. It contains a proposal for a submetric for an
autonomous train perception system and a rationale
for its design. The amount of feedback will be max-
imized by wide dissemination. The data expected
here are lists of measurements that fit within the pro-
posed submetric in fig.4 and 4-tuples of the perfor-
mance minima for braking and warning. An element
in the list of measurement contains the name of the
system, the X, rate of false-positives per hour and the
Table 2: Survey results for acceptable false-positive brakes.
Per operational hour Expert votes %
1 in 100 2 13,33
1 in 1 000 3 20
1 in 10 000 5 33,33
1 in 100 000 3 20
1 in 1 000 000 2 13,33
minimal distance for X% detections. Textual feed-
back is also welcome, especially as reasoning for the
suggested performance minima. Also, human per-
formance measurements as benchmark are welcome.
The anonymized data from the feedback will be an-
alyzed and published in a separate paper, for which
this paper serves as a draft.
The interim results of the call for performance
data show that at least one development team has
a triple digit number of hours of multi-sensor data.
Less data is reported to be annotated. The first an-
notated multi-sensor open dataset OSDaR23 contains
only about 3 min of sensor data (Tilly et al., 2023).
A survey of 15 experts from German mobility sec-
tor conducted during the “Verkehrs- und Infrastruk-
turtagung (VIT) 2023” in Berlin shows support for the
maximal 10
−4
false positive brakes per hour (Tab.2).
7 CONCLUSION
A very important idea take away is the inaptitude of
the concept of a binary false negative rate for obstacle
detection for mainline railways. The non-detection of
obstacles is gradual and not binary. The question is
not “What share of the obstacles is detected?”. The
question is “At what distance will X% of the obsta-
cles be detected at the latest?”. The other impor-
tant idea is that smooth operation, or minimising the
number of false-positive stops, is the primary goal
and more computationally demanding, while safety,
or maximising the timeliness of obstacle detection, is
the secondary goal.
The main result of this work is the proposal of
an end-user performance submetric for obstacle de-
tection by a moving train, based on the two ideas in-
troduced. On the one hand, this submetric should help
to correlate the performance requirements of the end-
user with the goals of the developers. On the other
hand, this submetric makes the train-side perception
system comparable and the progress of the perception
system measurable for external analysis. A first feed-
back from mobility experts is already included in this
paper. However, the proposal needs more attention
from the community of mobility experts for further
development and refinement. Another useful outcome
VEHITS 2024 - 10th International Conference on Vehicle Technology and Intelligent Transport Systems
218

is a short introduction to the DTO for mainline rail.
REFERENCES
Augsburger Allgemeine (23.04.2014). Unbekannter wirft
Fahrrad von Br
¨
ucke in die S-Bahn-Oberleitung. 2
BASt (2023). Traffic and Accident Data. Summary Statis-
tics – Germany. Federal Highway Research Institute.
Bergisch Gladbach. 4
Deutsche Bahn (2019). Schranken schließen nicht ohne
Grund! deutschebahn.com. 3
European Union (2013). Commission Implementing Regu-
lation (EU) No 402/2013. 3
EUROSTAT (2022). Railway safety statistics in the EU.
ec.europa.eu. 3, 4
Fr
¨
ankische Landeszeitung (15.07.2022). Gegenst
¨
ande in
Oberleitung: Z
¨
uge erreichen Landshut nicht. 2
Gebauer, O., Pree, W., and Stadlmann, B. (2012). Au-
tonomously driving trains on open tracks—concepts,
system architecture and implementation aspects. In-
formation Technology. 3
GUV-R 2150 (2008). Sicherungsmaßnahmen bei Arbeiten
im Gleisbereich von Eisenbahnen. Deutsche Geset-
zliche Unfallversicherung. 3, 5
Herrmann, T., Noethlichs, B., Schischkoff, M., Hanisch,
T., Lauer, D., K
¨
oppel, M., and Wolter, K. U.
(2023). Auf dem Weg zum vollautomatischen Fahren
– ein erstes Forschungsprojekt zur Erkennung von
¨
Uberfahrereignissen. ZEVrail, 03. 2
Hofmann, K., Tagiew, R., Tilly, R., Klotz, C., and Rein-
hardt, M. (2023). Standortbestimmung des DZSF zum
Thema ATO. DER EISENBAHNINGENIEUR, 01. 2
IEC 62267 (2009). Railway applications - Automated urban
guided transport (AUGT) - Safety requirements. 3
ISO 22737 (2021). Low-speed automated driving (LSAD) -
Systems for predefined routes - Performance require-
ments, system requirements and performance test pro-
cedures. 4
ISO 34502 (2022). Road vehicles - Test scenarios for auto-
mated driving systems - Scenario based safety evalua-
tion framework. 3
Itoh, K., Seki, M., and Hoshino, T. (2001). A Simulation-
based Study on Night Train Operators’s Track In-
spection Performance by Use of Cognitive-Perceptual
Model. DGLR Bericht. 5
Leinhos, D., Flatt, H., and Witte, S. (2022). Sensorik
als technische Voraussetzung f
¨
ur ATO-Funktionen.
Technical report, Deutsches Zentrum f
¨
ur Schienen-
verkehrsforschung. 2, 6
Mockel, S., Scherer, F., and Schuster, P. (2003). Multi-
sensor obstacle detection on railway tracks. In Intelli-
gent Vehicles Symposium, pages 42–46. IEEE. 5
Moser, M. and Schibig, G. (2017). Analyse und Model-
lierung von Eisenbahnunf
¨
allen. 5
Nakasone, R., Nagamine, N., Ukai, M., Mukojima, H.,
Deguchi, D., and Murase, H. (2017). Frontal obsta-
cle detection using background subtraction and frame
registration. Quar. Report of RTRI, 58(4):298–302. 5
Oberhessische Presse (12.02.2015). Fahrrad auf Ober-
leitung: G
¨
uterzug verhakt sich. 2
Petrovi
´
c, A. D., Bani
´
c, M., Simonovi
´
c, M., Stamenkovi
´
c,
D., Miltenovi
´
c, A., Adamovi
´
c, G., and Rangelov, D.
(2022). Integration of Computer Vision and Convo-
lutional Neural Networks in the System for Detection
of Rail Track and Signals on the Railway. Applied
Sciences, 12(12):6045. 2
Polz, J., Mihm, P., and Czurda, W. (2003). Automatis-
ches Fahren (AF) - Lastenheft ”Hinderniserkennung
Fahrweg”. Technical report, Bundesministerium f
¨
ur
Bildung und Forschung. 5, 7
Risti
´
c-Durrant, D., Franke, M., and Michels, K. (2021).
A review of vision-based on-board obstacle detec-
tion and distance estimation in railways. Sensors,
21(10):3452. 3
RUHR24 (20.05.2022). Fahrrad verursacht an DB-Strecke
in NRW lebensgef
¨
ahrlichen Lichtbogen. 2
Sch
¨
one, E. J. and Bagola, R. (2013). Wahrnehm-
barkeit akustischer Signale der Bahnfahrzeuge an
Bahn
¨
uberg
¨
angen. EI-Spezial, 10. 4, 7
Singh, P., Dulebenets, M. A., Pasha, J., Gonzalez, E. D.
R. S., Lau, Y.-Y., and Kampmann, R. (2021). De-
ployment of autonomous trains in rail transportation:
Current trends and existing challenges. IEEE Access,
9:91427–91461. 1
Staino, A., Suwalka, A., Mitra, P., and Basu, B. (2022).
Real-Time Detection and Recognition of Railway
Traffic Signals Using Deep Learning. Journal of Big
Data Analytics in Transportation, 4(1):57–71. 2
STIMME (28.06.2021). Unbekannte werfen Fahrrad in
Oberleitung. 2
StVZO (2016). §55 Einrichtungen f
¨
ur Schallzeichen.
Straßenverkehrs-Zulassungs-Ordnung (StVZO). Bun-
desgesetzblatt. 4
Tagiew, R., Buder, T., and Fietze, M. (2023).
¨
Uberblick
zur fahrzeugseitigen Kollisionsvorhersage f
¨
ur Eisen-
bahnen. ZEVrail, 4. 1, 2
Tagiew, R., Buder, T., Hofmann, K., and Klotz, C. (2022).
Risikoanalyse der Schnellbremsung bei frontaler Kol-
lisionsgefahr. Elektrische Bahnen, 6-7. 3, 4, 5, 6
Tilly, R., Neumaier, P., Schwalbe, K., Klasek, P., Tagiew,
R., Denzler, P., Klockau, T., and K
¨
oppel, M. (2023).
OSDaR23. TIB. DOI: 10.57806/9mv146r0. 7
Toward, M., Wiseman, M., Lower, M., and Thompson, D.
(2022). Relationship between train horn sound levels
tested at 25 m and sound levels experienced at distance
by track workers. In IWRN14, pages 92–99. 7
Volker Behrendt (2012). Signal Pf 2 – Pfeiftafel vor
Bahn
¨
uberg
¨
angen (DV 301). DB Netz AG, Frankfurt.
I.NPB 4(B) Ril 301A10. 5
Yusuf, M., MacDonald, A., Stuart, R., and Miyazaki, H.
(2020). Heavy Haul Freight Transportation System:
AutoHaul. T. to Achieve Smarter Mobility, 69(6). 1
Zhangyu, W., Guizhen, Y., Xinkai, W., Haoran, L., and Da,
L. (2021). A camera and LiDAR data fusion method
for railway object detection. IEEE Sensors Journal,
21(12):13442–13454. 5
Performance Metric for Horn and Brake Automation on Mainline Trains
219
