
Large-Scale Forecasting of Electric Vehicle Charging Demand Using
Global Time Series Modeling
Tijmen van Etten
1,2 a
, Victoria Degeler
1 b
and Ding Luo
2 c
1
University of Amsterdam, Science Park, Amsterdam, The Netherlands
2
Shell Information Technology International B.V., Amsterdam, The Netherlands
Keywords:
Time Series, Deep Learning, Multiple Time Series, E-Mobility, Electric Vehicles, Intelligent Transportation,
Forecasting, Energy Demand.
Abstract:
Electric Vehicle (EV) charging demand forecasting holds paramount significance in advancing sustainable
transportation systems, particularly as electric vehicle adoption surges globally. Accurate predictions of charg-
ing demand are instrumental for optimizing charging infrastructure, energy management, and grid stability. By
forecasting the demand for charging, stakeholders can effectively distribute resources, plan ahead for peak us-
age times, and lay out blueprints for the growth of infrastructure. Furthermore, precise forecasting enables
the seamless integration of renewable energy sources into transportation, promoting a cleaner and greener
future. In this work, challenges in EV charging demand forecasting are addressed, and an innovative frame-
work tailored for large-scale prediction is proposed. The methodology involves generating individual fore-
casts for multiple charging stations, enabling a comprehensive evaluation of forecasting models across diverse
contexts. The potential of global deep learning models to enhance prediction accuracy by capturing shared
patterns across time series is explored. These models exhibit remarkable generalization capabilities, proving
effective even in forecasting demand at previously unobserved charging stations. The contributions of this
research encompass both methodologies and insights, enriching the realm of accurate EV charging demand
forecasting. This work bears significance in fostering the integration of electric vehicles into transportation
systems, aligning with the trajectory towards sustainable energy solutions.
1 INTRODUCTION
Electric Vehicle (EV) charging demand forecasting
is crucial for ensuring sustainable transportation sys-
tems. As EV adoption increases, accurate predictions
become critical for optimizing infrastructure, man-
aging energy efficiently, and maintaining grid sta-
bility. This enables resource allocation, integration
of renewable energy sources, and cleaner transporta-
tion, ultimately facilitating the widespread adoption
of EVs and a greener transportation ecosystem.
Existing research primarily focuses on predicting
single demand curves, which may not generalize well
to diverse geographical areas, time periods, and de-
mographic segments. To address this limitation, a
framework for large-scale EV charging demand fore-
casting is presented. This framework involves gen-
a
https://orcid.org/0009-0006-5659-3046
b
https://orcid.org/0000-0001-7054-3770
c
https://orcid.org/0000-0003-2661-0926
erating forecasts for individual charging stations and
collectively evaluating their accuracy.
This framework offers a more nuanced and real-
istic evaluation of forecasting models by considering
multiple individual time series instead of a single ag-
gregated one. It aims to reduce bias and potential in-
accuracies associated with focusing on a single time
series, thereby advancing EV charging demand fore-
casting for practical applications. Additionally, the
potential of deep learning-based models to discern
patterns across diverse time series is explored, ad-
dressing the complexity of forecasting at new charg-
ing station locations.
This research addresses two key questions: how
can global deep learning models enhance demand
forecasting by extracting and sharing patterns across
time series? How well do these global models gen-
eralize to predict charging demand at new, unseen
charging station locations? These questions aim to
overcome current limitations in the literature and con-
tribute to the development of robust, scalable, and ef-
40
van Etten, T., Degeler, V. and Luo, D.
Large-Scale Forecasting of Electric Vehicle Charging Demand Using Global Time Series Modeling.
DOI: 10.5220/0012555400003702
Paper published under CC license (CC BY-NC-ND 4.0)
In Proceedings of the 10th International Conference on Vehicle Technology and Intelligent Transport Systems (VEHITS 2024), pages 40-51
ISBN: 978-989-758-703-0; ISSN: 2184-495X
Proceedings Copyright © 2024 by SCITEPRESS – Science and Technology Publications, Lda.

fective demand forecasting models for the EV charg-
ing industry.
This work contributes to the field of EV charg-
ing forecasting by proposing a novel framework for
large-scale demand forecasting across multiple charg-
ing station locations. A robust solution for accurately
estimating forecasting model performance using his-
torical data is offered. Additionally, the applicability
of global deep learning in EV charging demand fore-
casting is demonstrated, showcasing superior perfor-
mance while reducing operational complexity. The
research validates the effectiveness of global deep
learning models in predicting charging demand for
previously unseen stations, emphasizing their capac-
ity to generalize and adapt to new situations.
2 RELATED WORK
2.1 Electric Vehicle Charging Load
Forecasting
In recent years, there has been a growing interest in
forecasting EV charging demand, leading to numer-
ous studies in the field. However, the literature on this
topic is characterized by a significant level of frag-
mentation and divergence (Amara-Ouali et al., 2021).
This division can be attributed to the wide variety of
datasets used and the diverse range of forecasting ap-
plications considered, each with its own correspond-
ing geographical and temporal scales. As a result, var-
ious forecasting techniques have been studied, with
many different techniques appropriate depending on
the task at hand. In this section, the different ap-
proaches and models used in EV forecasting literature
will be described, as well as the different geographical
and temporal scales on which forecasts are generally
made.
2.1.1 Approaches and Models
Originally due to the lack of real-world EV charg-
ing data, studies have been conducted using simula-
tions methods. However, these approaches often use
proxies for electricity consumption such as road traf-
fic data (Su et al., 2017; Andrenacci et al., 2016; Xy-
das et al., 2013) or individual EV charging profiles
(Gerossier et al., 2019; Yan et al., 2020; Huber et al.,
2020). These methods are therefore often relied upon
strong assumptions, such as the replacement of the
current car fleet by electric vehicles (Kim and Kim,
2021).
More recently, charging demand data has become
increasingly available due to the development of new
charging infrastructure (Amara-Ouali et al., 2021),
facilitating the potential to leverage statistical and
machine learning methods for supervised learning.
These methods can be broadly classified into three
categories: statistical, classical machine learning, and
deep learning methods.
Simple statistical methods have been proven to
provide highly competitive results for charging load
forecasting. The autoregressive integrated moving av-
erage (ARIMA) (Kim and Kim, 2021; Ren et al.,
2022) model, for example, is commonly implemented
and used as a basis for more advanced models due to
its ease-of-use and interpretability. Extensions of the
ARIMA model include the Seasonal Autoregressive
Integrated Moving Average (SARIMA) (Louie, 2017)
Machine learning techniques, such as support vec-
tor machines (SVM) (Xydas et al., 2013), random
forests (RF) (Buzna et al., 2019), gradient boosting
regression tree (GBRT) (Buzna et al., 2019), and eX-
treme Gradient Boosting (XGBoost) (Yi et al., 2022),
have been effective in load forecasting. On the other
hand, the rise of deep learning, especially models like
artificial neural networks (ANNs), convolutional neu-
ral networks (CNNs) (Zhu et al., 2019), and recurrent
neural networks (RNNs) (Zhu et al., 2019; Yi et al.,
2022; Moon et al., 2018), has enabled sophisticated
charging demand forecasting due to their prowess in
handling sequential data and learning non-linear re-
lationships. Notably, the Long Short-Term Mem-
ory (LSTM) model, and its variations, have emerged
as solutions to handle datasets with long dependen-
cies (Yi et al., 2022; Koohfar et al., 2023; Eddine
and Shen, 2022). One standout hybrid approach is
the SARIMA-LSTM model (Ren et al., 2022), which
combines linear and non-linear components for more
precise forecasting.
While RNN-based architectures such as LSTM’s
have shown effective on a wide variety of tasks,
more recently attention-based mechanisms have been
shown to outperform these approaches on tasks such
as Natural Language Processing (NLP). (Koohfar
et al., 2023) attempts to fill the gap in the EV forecast-
ing literature by applying Transformer-based models
to the task of forecasting charging demand. Their re-
search shows that these models can offer superior per-
formance compared to both statistical and other deep
learning-based approaches.
A different type of network that is becoming
increasingly popular is the Graph-Neural Network.
As mentioned previously, one study successfully
modeled the dependencies between charging stations
(H
¨
uttel et al., 2021). In the paper they propose their
novel Temporal Graph Convolution Model, demon-
strating outperformance of their model on both short
Large-Scale Forecasting of Electric Vehicle Charging Demand Using Global Time Series Modeling
41

and long-term forecasting compared to other forecast-
ing methods.
2.1.2 Geographical Scales
As previously mentioned, studies use a wide range
of different geographical resolutions on which energy
load predictions are made depending on the type of
application.
Studies have attempted to predict charging load
for small-scale power consumption types such as sev-
eral EVs (Gerossier et al., 2019) or a single road
(Wang et al., 2018), while other studies attempt to
forecast the charging load for an individual charging
station (Kim and Kim, 2021; Koohfar et al., 2023;
Eddine and Shen, 2022; Ren et al., 2022).
(Yi et al., 2022) uses clustering to group a number
of charging stations together into regions to forecast
the aggregated charging demand for a number of re-
gions in the U.S. state of Utah and the city of Los An-
geles. This approach significantly reduces the vari-
ance of the aggregated load curve, leading to more
stable results. However, this aggregated approach
sacrifices the granularity of forecasting demand for
individual charging stations.
Furthermore, as stated in (Amara-Ouali et al.,
2021), the intricate spatial and temporal dependen-
cies between charging stations is one of the difficul-
ties in predicting the demand for EV charging. While
the forecasting of charging load for a charging sta-
tion has been relatively well studied, few account for
the dependencies between individual sites. Instead,
the charging demand for each electric vehicle charg-
ing station (EVCS) is more commonly aggregated
and forecasted as a single time series (Louie, 2017).
(H
¨
uttel et al., 2021) proposed a solution that combines
the charging data of multiple charging stations in Palo
Alto using a spatio-temporal graph-based modeling
approach to account for these spatial-temporal cor-
relations between individual stations. Other stud-
ies have been conducted that attempt to predict the
charging demand of a city (Kim and Kim, 2021; Yi
et al., 2022) or province (Buzna et al., 2019). Lastly,
country-level forecasting attempts have been made
to predict the total load demand for a total of 1,916
charging stations in Korea (Kim and Kim, 2021) and
similarly for the country of China (Eddine and Shen,
2022).
2.1.3 Forecasting Horizons
Besides different geographical scales, approaches in
the existing literature use a wide range of forecast-
ing horizons. Forecasting horizons can generally
be divided into three different categories: short-,
medium, and long-term forecasting. Short-term fore-
casts, ranging from minutes (Hu et al., 2021), up to
hours (Ren et al., 2022), can aid energy suppliers to
plan and optimize their short-term energy production
to efficiently satisfy energy
demand. Medium-term forecasts, ranging from
days up to several weeks (Ren et al., 2022; Eddine and
Shen, 2022; H
¨
uttel et al., 2021), can be used by EVCS
operators to make informed decisions about capacity
planning, load management, and maintenance plan-
ning. Lastly, long-term forecast horizons can further
be used to assist long-term investment planning and
allocation of resources for charging infrastructures.
2.1.4 Limitations in Charging Load Forecasting
Literature
While research in the field of EV charging demand
forecasting has been extensive across various geo-
graphical scales, significant limitation arises in how
the accuracy of forecasting methods is both assessed
and reported, often focusing on just a singular time
series. This narrow focus on individual time series
restricts the scalability and applicability of proposed
models in diverse settings. Although some papers,
such as (Kim and Kim, 2021), have explored multi-
ple geographical scales, it is important to note that
each corresponding scale is typically still investigated
solely based on a single aggregated demand curve.
To address this limitation and improve the fore-
casting models, the need to move beyond analyzing
just one time series is emphasized. In this work, by
studying multiple individual time series from a spe-
cific geographical area, a more complete evaluation
is aimed for. This method is intended to enhance the
accuracy and versatility of the models.
Another prevalent limitation found in the litera-
ture is the lack of proper model validation in the eval-
uation of the presented forecasting models. A com-
mon approach is to make a forecast with a given hori-
zon for only a single window in a held-out test set.
This approach, as seen in studies such as (Koohfar
et al., 2023) and (H
¨
uttel et al., 2021), often involves
evaluating the model’s performance using only the
first consecutive data points. Restricting the evalua-
tion to a single forecast window introduces a notable
bias in the reporting of results, which can potentially
lead to an overestimation or underestimation of the
model’s actual performance.
To address this limitation, a rolling-window his-
torical forecasting approach is incorporated. With this
approach, models undergo a more realistic evaluation
in terms of forecasting performance. This method-
ology allows for testing the models on a diverse and
representative set of historical data windows, offering
VEHITS 2024 - 10th International Conference on Vehicle Technology and Intelligent Transport Systems
42

a comprehensive assessment of their predictive capa-
bilities and generalization across different time peri-
ods.
2.2 Global Time Series Modeling
Training machine learning models on multiple related
time series data –also known as ”cross-learning”– has
gained substantial attention in recent years due to its
potential to enhance forecasting accuracy and capture
interdependencies among variables. This approach
involves leveraging data from multiple time series that
measure the same phenomenon or variable, aiming
to exploit the relationships and patterns among them.
The motivation behind training on multiple related
time series stems from the recognition that individual
time series often exhibit inherent dependencies that
can be better understood and harnessed when consid-
ered together.
Notable methodologies in this space include
DeepAR (Salinas et al., 2020), which melds the
capabilities of LSTM-based recurrent networks and
Bayesian probabilistic models. This framework has
shown promise in predicting intricate time-dependent
patterns based on a multitude of related time series.
Similarly, N-BEATS (Oreshkin et al., 2020) of-
fers a unique deep learning architecture designed for
univariate time series point forecasting. Its capability
to outperform the previous M4 competition winner,
ES-RNN, underlines its efficacy in capturing complex
temporal sequences through a combination of deep
stacks and residual connections.
N-HiTS (Neural Hierarchical Time Series), pro-
posed in (Challu et al., 2022), extends N-BEATS’ ca-
pability for long-horizon forecasting with hierarchical
interpolation & multi-rate data sampling techniques.
It shows a 20% improvement in accuracy over the
state-of-the-art while reducing computational time by
50 times, highlighting its efficiency.
Yet another noteworthy approach is the probabilis-
tic forecasting framework based on Temporal Convo-
lutional Neural Networks (TCNs) (Chen et al., 2020).
It leverages stacked dilated causal convolutional net-
works to grasp complex temporal dependencies, sig-
nificantly improving forecast accuracy even when his-
torical data is sparse.
3 METHODOLOGY
To enable effective large-scale forecasting, several
key aspects of the time series forecasting lifecycle
need to be reconsidered, specifically focusing on the
model, training setup, and evaluation methodologies.
This section delves into these facets, providing an in-
depth understanding of their enhancements.
3.1 Task Definition
Given a time series dataset D = {T
1
, . . . , T
N
} com-
prising N time series, where each time series T
n
is
represented by a sequence of values: (y
n
1
, y
n
2
, . . . , y
n
L
)
of length L, the objective is to construct a forecast-
ing model F that accurately predicts future values for
each time series sequence.
Mathematically, the forecasting model F can be
represented as a function mapping historical observa-
tions within each time series T
n
up to time step t to
predicted values for subsequent time steps t + 1 to H
points in advance. Therefore, for each time series T
n
,
the forecasting process can be formalized as follows:
ˆy
n
t+1
, ˆy
n
t+2
, . . . , ˆy
n
t+H
= F(y
n
1
, y
n
2
, . . . , y
n
t
) (1)
Where:
• F is the forecasting model.
• ˆy
n
l+1
, ˆy
n
l+2
, . . . , ˆy
n
L
are the predicted values for time
steps t + 1 to L for time series T
n
.
• y
n
1
, y
n
2
, . . . , y
n
t
represent the historical observations
up to time step t for time series T
n
.
3.2 Model
This methodology utilizes the N-HiTS model for time
series forecasting. Similar to the N-BEATS archi-
tecture, the N-HiTS architecture follows a hierarchi-
cal structure composed of stacks, each consisting of
blocks. With each block, the model learns to ac-
curately approximate a specific segment of the in-
put signal while delegating the remaining portions to
be approximated by subsequent blocks in the model
through a process called doubly residual stacking. For
a more detailed description of the model architecture,
the reader is referred to the original N-BEATS and N-
HiTS papers.
3.3 Splitting Multiple Time Series Data
For our research objectives, two different types of
splits of time series data are utilized.
Temporal Partitioning. Unlike conventional ma-
chine learning procedures, which often assume the su-
pervised data follows an independent and identically
distributed (i.i.d.) pattern, time series data has distinct
characteristics. Given the inherent sequential nature
of time series data, careful consideration is required
Large-Scale Forecasting of Electric Vehicle Charging Demand Using Global Time Series Modeling
43

when partitioning it into training and testing sets, ne-
cessitating specialized methods.
The foremost and widely employed approach that
that is utilized in this work, involves splitting time
series across time intervals. Let L denote the total
number of data points in each time series Y , with
l
train
indicating the allocated training duration. Conse-
quently, L − l
train
data points are left for testing. This
partitioning method can be formulated as follows:
T
train
n
= (y
n
1
, . . . , y
n
l
train
) (2)
T
test
n
= (y
n
l
train+1
, . . . , y
n
L
) (3)
Series-Wise Partitioning. The next strategy em-
ployed involves partitioning the dataset across indi-
vidual series. Considering the same dataset D com-
prising N time series. For effective implementation of
series-wise partitioning, a subset of these time series
is designated for training, while the remaining ones
are allocated for testing. This allocation can be ex-
pressed mathematically as:
D
train
= {T
1
, . . . , T
n
train
} (4)
D
test
= {T
n
train
+1
, . . . , T
N
} (5)
Unlike temporal partitioning, which maintains
chronological order, series-wise partitioning can be
achieved through random shuffling as it does not de-
pend on the order of the time series.
3.4 Training on Multiple Time Series
Before feeding the data into the N-HiTS model, the
data is processed into consecutive pairs of input and
output sub-series, each of which has a length defined
by the combined input chunk length and output chunk
length. The input sequences within these pairs serve
as the neural network’s inputs, while the output se-
quences are used to calculate the training loss. The
processing of this dataset can be defined using the fol-
lowing mathematical notation:
D
train
input
= {(X
train
1
, Y
train
1
), . . . , (X
train
m
, Y
train
m
)} (6)
Each element in the set, (X
train
i
, Y
train
i
), represents
a consecutive sub-series of a time series T with an
input chunk length of |X | and an output chunk length
of |Y |. Here, m is the total number of consecutive in-
put/output pairs that could be generated from all time
series T ∈ D
train
. By combining these pairs from dif-
ferent datasets, the model can effectively learn from
multiple time series, capturing diverse patterns and
dependencies in the data, which enhances its forecast-
ing capabilities and generalization across various con-
texts.
3.5 Historical Forecasting
The evaluation of time series forecasting models is
a critical aspect in assessing their predictive accu-
racy. Traditionally, studies in EV charging demand
forecasting (Koohfar et al., 2023; H
¨
uttel et al., 2021;
Kim and Kim, 2021) have predominantly utilized the
multi-step forecasting approach, a common practice
involves setting aside a fixed test set with a length cor-
responding to the forecast horizon H, following the
training data. Making predictions for the evaluation
of the forecasting model on the held-out test set can
be mathematically formulated as:
ˆ
Y
test
n
= ( ˆy
n
t+1
, ˆy
n
t+2
, . . . , ˆy
n
t+H
) = F(y
n
1
, y
n
2
, . . . , y
n
t
) (7)
Where the set (y
n
1
, y
n
2
, . . . , y
n
t
) represents the input
data up to time t,
ˆ
Y
test
n
= ( ˆy
n
t+1
, ˆy
n
t+2
, . . . , ˆy
n
t+H
) are the
predictions of the test values and F is the forecasting
model.
However, this conventional approach faces two
main challenges. Firstly, the dedicated test set is re-
stricted in size, limiting the generalizability of the
evaluation and potentially leading to overfitting. Sec-
ondly, all but the last forecasted point within this
approach fall within a timeframe less than H steps
ahead, failing to assess the model’s performance at
the full forecast horizon and biasing the evaluation to-
wards shorter-term predictions.
To overcome the constraints imposed by the eval-
uation of a restricted number of data points, historical
forecasting, commonly known as backtesting, is uti-
lized. This systematic methodology provides an in-
depth approach to assess the effectiveness of time se-
ries forecasting models. Unlike conventional single-
window forecasting, historical forecasting entails pre-
dicting past values within a time series through the
utilization of a sliding window technique. By adopt-
ing this approach, a more comprehensive evaluation
of the model’s performance can be achieved, shed-
ding light on its reliability and stability across diverse
time segments within the time series.
Secondly, to more realistically capture the accu-
racy of forecasting with a specific forecast horizon,
a distinct approach is proposed that offers enhanced
insights into the quality of predictions over extended
time periods. Forecasting H days ahead in time is
advocated. This shift from the conventional multi-
step forecasting technique to the proposed approach
provides a more comprehensive understanding of the
VEHITS 2024 - 10th International Conference on Vehicle Technology and Intelligent Transport Systems
44

model’s capability to predict specific days well in ad-
vance.
To clarify the approach, the existing mathematical
representation can be extended to account for a rolling
window of forecasting where each forecast is made
H days in advance. Let’s designate S as the sliding
window such that for every data point y
n
t
in the test
set Y
test
n
, a H-day ahead forecast is made using all the
preceding data points.
S
t
= (y
n
1
, y
n
2
, . . . , y
n
t−H
) (8)
With window S
t
, the H-day ahead forecast ˆy
n
t+H
,
can be generated.
ˆy
n
t+H
= F(S
t
) (9)
Over the test set, the collection of forecasts would
be:
T
test
n
= ( ˆy
n
H+1
, ˆy
n
H+2
, . . . , ˆy
n
L
) (10)
Where T is the end of the test set.
4 EXPERIMENTAL SETUP
We explore the impact of global training using the N-
HiTS Model and make a comparative analysis against
using local training and various well-established mod-
els frequently used in the EV charging demand fore-
casting literature. We run the experiments for four
datasets separately, to evaluate the applicability on a
wide range of datasets each with a variable number of
time series and different characteristics.
4.1 Datasets
In this study, four datasets, are employed each pro-
viding insights into EV charging station energy con-
sumption in kilowatt-hours (kWh) across different ge-
ographical locations. Three of these datasets are pub-
licly available.
London. The proprietary London dataset contains
charging session data of 113 charging stations from
in and around the greater London area in the United
Kingdom. With 476,639 records over the time span
of January 2020 to October 2022 it is the most com-
prehensive dataset out of four. It contains information
related to the session data regarding the location infor-
mation, driver information, charging fee, power type
and session duration.
Palo Alto. The Palo Alto dataset (of Palo Alto,
2021) is a public dataset containing data from electric
vehicle charging activities across 22 locations in Palo
Alto, California. This dataset provides the longest
range of EV charging data, spanning from 2011 to
2020. It also includes a range of attributes for each
charging session, such as station information, loca-
tion information (including address and postal code),
charging time, gasoline and greenhouse-gas savings,
power type, charging fee, as well as driver informa-
tion.
Perth. Another publicly available dataset is the
Perth dataset (Council, 2019), encompassing session
data originating from Perth & Kinross, a region lo-
cated in Scotland. Covering the period from January
2016 to December 2019, this dataset encompasses
data from 22 distinct charging station locations. Its
attributes include location information, charging time,
and connector type.
Boulder. The last public dataset is the Boulder
dataset (of Boulder, 2020), which contains EV charg-
ing session data from 32 distinct charging station lo-
cations from the city of Boulder in the U.S. state of
Colorado. Encompassing data from January 2018
to March 2023, this dataset enables the observation
of EV charging trends over a significant timeframe.
Similar to the Palo Alto dataset, it includes essen-
tial attributes like station information, location infor-
mation, charging time, power type, and metadata on
gasoline and greenhouse-gas savings.
In this study, one specific attribute is utilized: en-
ergy consumption (measured in kWh) per transaction.
We made this choice because it can be easily calcu-
lated across all datasets, making our study relevant
and adaptable to various scenarios.
4.2 Pre-Processing
To process the raw session data for our purposes, the
session data is aggregated to represent the total daily
energy delivered in kWh per charging station. As an
additional preprocessing step, negative values in the
data detected as outliers are removed. To balance the
trade-off between the number of charging days and
the number of time series, charging station time se-
ries that have at least 690 days of data are selected,
specifically focusing on the most recent 690 days of
data points. The series that contain over 10% miss-
ing values are discarded, and the missing daily values
for the remaining time series are filled using linear in-
terpolation. This preprocessing approach results in a
total of 34 time series for the London dataset, 8 time
Large-Scale Forecasting of Electric Vehicle Charging Demand Using Global Time Series Modeling
45

series for the Palo Alto dataset, 5 time series for the
Boulder dataset and 8 time series for the Perth dataset.
We found that the relatively small number of remain-
ing Time Series in the Palo Alto, Perth and Boulder
datasets can largely be attributed to a large number
of missing values. A description of the processed
datasets can be found in Table 1.
Table 1: Overview of Processed EV Charging Session
Datasets. This table delineates each dataset’s number of EV
station time series, total data points, and the date range of
the selected aggregated time series.
Dataset
Number of
EV Stations
Total
Data points
Start Date End Date
London 34 23460 29 July 2020 31 Oct. 2022
Palo Alto 8 5520 22 Nov. 2018 31 Dec. 2020
Perth 8 5520 11 Oct. 2017 8 Dec. 2019
Boulder 5 3450 11 May 2021 31 Mar. 2023
For training, a temporal split on each time series is
employed, allocating 600 consecutive days for train-
ing and 90 days for testing. The training data is fur-
ther split into a 70/30 ratio for training and valida-
tion, respectively, balancing data usage for effective
model learning and robust validation while consider-
ing dataset limitations.
4.3 Trend Analysis
To get a general impression of the trend and de-
mand pattern over time in each dataset, we visual-
ized the aggregated the daily average delivered en-
ergy demand across time series. The time series plot
for each dataset curve is depicted in Figure 1. The
London demand curve exhibits a clear upward tra-
jectory, indicating a steadily increasing demand for
EV charging. Also, we notice that the magnitude
of EV charging demand varies significantly between
the minimum and maximum daily delivered energy
over the dataset’s span. This indicates large variabil-
ity in demand curves over individual time series. The
aggregated time series for Palo Alto demonstrates a
slight upward trend up until early 2020, followed by
a steep decline. This decline in early 2020 are at-
tributed to the effects of the COVID-19 pandemic.
After this period, a gradual resurgence in demand can
be observed. Notably, the range of demand scale re-
mains relatively narrow throughout. The Perth dataset
showcases a trajectory that bears resemblance to Lon-
don’s, albeit with a bit more fluctuation due to the
smaller number of time series. The Boulder dataset
also exhibits considerable fluctuation. Due to its lim-
ited number of time series data, it appears especially
susceptible to noise in individual time series, leading
to this pronounced variability.
Table 2: Explored hyperparameter values for the N-HiTS
model during tuning.
Hyperparameter Values
Number of Stacks [1, 2, 4, 8, 16]
Number of Blocks [1, 2, 3, 4, 5]
Number of Layers [1, 2, 3, 4, 5]
Layer Widths [32, 64, 128, 256, 512]
Dropout Rate [0, 0.1, 0.2]
4.4 Training & Hyperparameter Tuning
We configure an N-HiTS model with an input chunk
length of 30 and and output chunk length of 7, to bal-
ance optimization for different forecasting horizons.
Furthermore, the model is configured to encode the
weekdays as covariates using a one-hot encoding.
Training is done using the train split of each time
series. Before feeding the data into the model, Min-
Max scaling is applied to each series independently,
ensuring that the unique characteristics of each series
are preserved and allowing for a fair comparison be-
tween the local and global training processes. During
training Early Stopping is employed with a patience
of 5 and minimum delta of 0.05. The N-HiTS model
is trained using the Adam optimizer with an MSE loss
function. The batch size is configured at 32, and an
initial learning rate of 1e-3 is set.
We employ a comprehensive exploration of hyper-
parameters to fine-tune the N-HiTS-architecture for
optimal performance. The hyperparameter space in-
cludes choices for the number of blocks, stacks, layer
widths, and dropout rates. The details of the hyperpa-
rameter ranges are presented in Table 2.
Using Ray Tune for Hyperparameter Tuning
(Liaw et al., 2018), performance is measured based on
MSE on the validation set. We incorporate an Asyn-
chronous Successive Halving Algorithm (ASHA)
scheduler, executing 20 iterations. The configuration
that yields the minimum validation loss is deemed op-
timal for predictions on the test set. The detailed hy-
perparameters for the N-HiTS models are presented in
Table 2.
4.5 Benchmarks
We conduct a comprehensive comparison of the
N-HiTS
global
model with the following four distinct
approaches:
• Naive. This model serves as a simple baseline
in time series forecasting, assuming that future
values will equal the mean of historical values.
Termed “naive,” this model overlooks any under-
VEHITS 2024 - 10th International Conference on Vehicle Technology and Intelligent Transport Systems
46
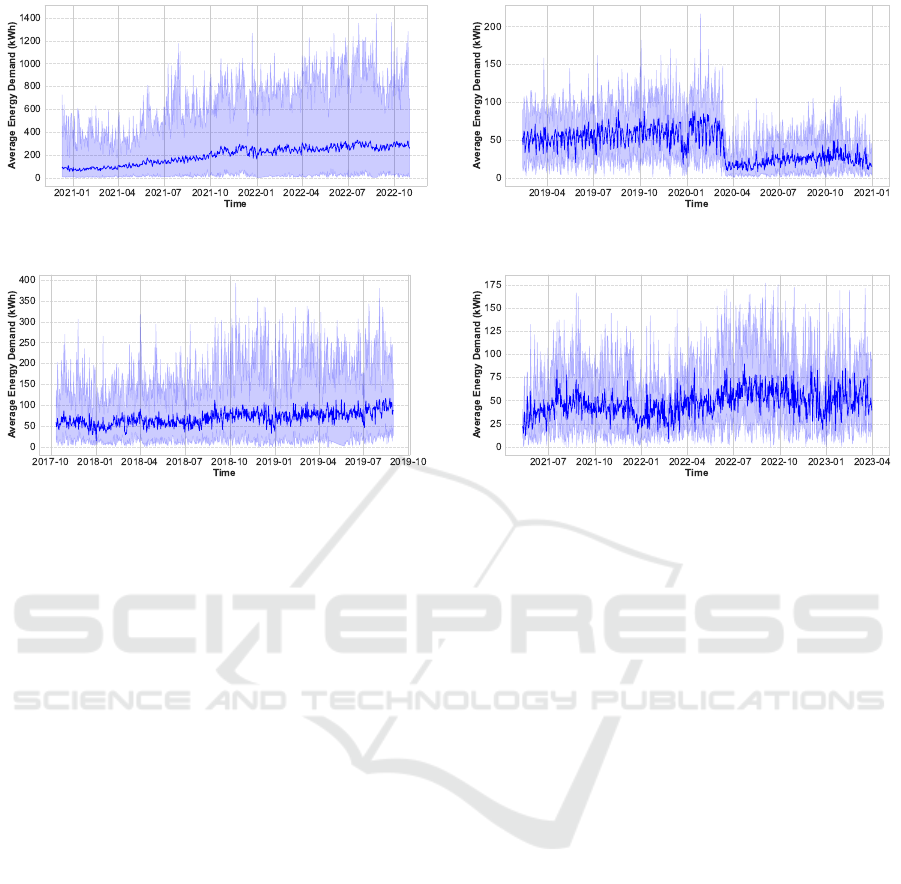
(a) London (b) Palo Alto
(c) Perth (d) Boulder
Figure 1: Overview of the Average Daily EV Charging Demand across charging stations. The dark blue line shows the
daily average delivered energy demand across time series for different datasets. The light blue area represents the minimum
and maximum values of each day. This gives insights into the general trend and demand pattern over time, as well as the
distribution of scales of the time series present in each dataset.
lying patterns, trends, or seasonality in the data.
• ARIMA. A well-established statistical method,
the ARIMA model is characterized by three pa-
rameters: p, d, and q. For this study, these are
set to p = 30, d = 0, and q = 30, aligning with
the input chunk length of 30 used in the N-HiTS
Model.
• Transformer. The Transformer model used in our
study follows the architectural setup as outlined in
(Koohfar et al., 2023). This state-of-the-art archi-
tecture offers powerful sequence modeling capa-
bilities. Details of the implementation, including
specific hyperparameters, can be found in Table 3.
• N-HiTS-Local. We employ the N-HiTS
local
model, which contrasts the N-HiTS
global
by initial-
izing and training a distinct model for each time
series. This comparison sheds light on the dif-
ferences between training the N-HiTS Model on
multiple time series simultaneously versus a sep-
arate model for each series.
4.6 Evaluation
Each model’s performance is assessed using historical
forecasting on the held-out test set of each time series,
which consists of 90 days of data for each time series.
The process of historical forecasting, as described in
subsection 3.5, uses forecast horizons of 1, 7, and
30 days, considering the various forecasting appli-
cations. The accuracy is reported for each dataset
separately using the mean average error (MAE), root
mean squared error (RMSE) and mean average per-
centage error (MAPE) metrics. Additionally, the
N-HiTS-London
global
model is employed to make pre-
dictions on the Boulder, Palo Alto, and Perth datasets,
using the same metrics and forecast horizons. This
enables a comparison of the N-HiTS-London
global
model’s performance with models specifically trained
on each individual dataset.
4.7 Implementation Details
For the implementation of all our experiments, the
Darts library (Herzen et al., 2022) is utilized. Darts
is an open-source Python library specifically tailored
for time series forecasting tasks. Darts provides a uni-
fied framework integrating statistical models from the
statsmodels library and deep learning models imple-
mented in PyTorch.
Large-Scale Forecasting of Electric Vehicle Charging Demand Using Global Time Series Modeling
47

Table 3: Table showing the optimal hyperparameters selected for the N-HiTS model across different datasets, the Transformer
model, and the N-HiTS-London
train
model.* indicates one encoder and one decoder layer.
Hyperparameter N-HiTS-Boulder N-HiTS-PaloAlto N-HiTS-London N-HiTS-Perth Transformer N-HiTS-London
train
Input Chunk Length 30 30 30 30 30 30
Output Chunk Length 7 7 7 7 7 7
Batch Size 32 32 32 32 32 32
Number of Stacks 8 4 2 2 N/A 2
Number of Blocks 2 1 3 5 N/A 2
Number of Layers 5 4 5 3 1* 2
Layer Widths 64 256 256 32 128 32
Dropout Rate 0 0.1 0.1 0 0.1 0
Learning Rate 1e-3 1e-3 1e-3 1e-3 1e-3 1e-3
Optimizer Adam Adam Adam Adam Adam Adam
Activation Function ReLU ReLU ReLU ReLU ReLU ReLU
Max Pooling True True True True True True
5 RESULTS
Comparing Model Forecasting Accuracy. The
results from Table 4 unequivocally highlight the
N-HiTS
global
model’s dominance in terms of forecast-
ing accuracy. This superiority is evident across the
majority of datasets and forecast horizons, with the
N-HiTS
global
consistently outshining its benchmark
counterparts.
In the London dataset, the accuracy difference is
most pronounced. Notably, at the 1-day forecasting
horizon, the N-HiTS
global
model significantly outper-
forms all other models. While it remains superior at
the 7 and 30-day horizons, the margin of its dom-
inance decreases, pointing to the intricacies of ex-
tended forecasts.
The Palo Alto dataset presents a tighter competi-
tion. While the N-HiTS
global
model retains its lead,
especially in metrics like MAE and RMSE, its MAPE
performance closely mirrors that of the Naive base-
line across all forecast durations.
For the Perth dataset, the scenario is more mixed.
The N-HiTS
global
model shows modest advantages at
shorter forecasting horizons. Intriguingly, at the 30-
day mark, the Naive model takes the lead, emphasiz-
ing the inherent challenges of long-range forecasts.
The Boulder dataset displays the N-HiTS
global
model’s consistent strengths in time series forecast-
ing, with it regularly outpacing the Naive model.
However, when juxtaposed with other benchmarks,
the performance differences appear to be minimal,
suggesting a balanced competitive landscape for this
dataset.
Generalization to Unseen Stations. The outcomes
from the experiment are particularly striking when ex-
amining the London-trained N-HiTS model’s perfor-
mance on the Perth dataset. Its impressive accuracy
on this external dataset indicates that the London data
harbors valuable patterns and insights, enabling en-
hanced knowledge transfer to different geographical
contexts. This underlines the model’s robust capacity
to generalize and its adaptability to varied infrastruc-
tural scenarios.
Additionally, for other external datasets, such as
Boulder and Palo Alto, the N-HiTS model, once again
trained on the London data, demonstrates commend-
able generalization capabilities. Despite some mini-
mal accuracy reductions, the consistent performance
showcases the model’s resilience and versatility.
Collectively, the evidence strongly advocates for
the utility and robustness of the N-HiTS model, es-
pecially its ability to perform reliably across diverse
charging station datasets. This solidifies the case for
the broader adoption of global deep learning models
in the realm of EV charging demand forecasting.
6 DISCUSSION
The forecasting of EV charging demand using his-
torical data at the level of individual charging sta-
tions remains challenging. The presence of substan-
tial volatility within the demand curve of single charg-
ing stations, alongside the limited availability of high-
quality time series within each dataset, as demon-
strated by our data analysis, continues to pose a hur-
dle. Despite these challenges, our study provides
a foundational framework for understanding the dy-
namics of EV charging demand forecasting and of-
fers insights into the potential of global deep learning
models in tackling this complex task.
The benchmark models did not perform as well as
expected, often falling short of even the baseline re-
sults. This highlights the challenges of achieving ac-
curate forecasting using pre-configured models, espe-
cially when applied to specific time series. It becomes
VEHITS 2024 - 10th International Conference on Vehicle Technology and Intelligent Transport Systems
48

Table 4: Comparison of forecasting accuracy of investigated models at various forecast horizons across datasets. The
N-HiTS
global
model exhibits superior performance across most metrics and datasets, showcasing its effectiveness for time
series forecasting.
Horizon=1 Horizon=7 Horizon=30
Model RMSE MAE MAPE RMSE MAE MAPE RMSE MAE MAPE
London
N-HiTS-London
global
88.79 70.91 30.16 103.52 83.56 34.86 121.20 99.90 42.86
N-HiTS-London
local
165.90 146.58 61.49 156.81 135.52 158.08 187.02 168.21 125.36
Transformer 200.72 180.94 190.82 199.18 178.72 285.39 206.32 188.44 267.16
ARIMA 113.45 93.40 75.74 134.41 112.11 239.57 155.56 134.73 323.80
Naive 139.48 119.15 66.98 140.38 120.20 67.97 140.22 120.99 69.82
Palo Alto
N-HiTS-PaloAlto
global
19.33 15.41 51.84 19.96 16.04 51.69 20.95 17.47 51.56
N-HiTS-PaloAlto
local
27.52 24.07 51.18 27.01 24.01 52.28 27.53 24.53 52.41
N-HiTS-London
global
23.67 20.29 50.48 24.22 20.70 51.56 30.89 27.23 55.00
Transformer 28.24 25.16 52.36 32.75 29.63 55.00 34.55 31.48 56.83
ARIMA 35.41 31.85 57.37 31.30 27.64 55.85 26.94 23.74 52.80
Naive 25.09 21.95 50.84 25.10 21.94 50.80 25.19 22.18 51.34
Perth
N-HiTS-Perth
global
40.21 31.97 49.76 41.99 33.17 55.28 50.71 39.65 90.78
N-HiTS-Perth
local
47.46 37.41 67.41 49.02 39.01 72.86 55.24 44.39 94.44
N-HiTS-London
global
38.84 31.77 37.79 39.94 32.23 39.37 44.84 35.88 42.41
Transformer 49.45 39.18 81.50 47.03 36.98 65.25 48.12 37.71 66.58
ARIMA 44.46 35.12 74.49 49.11 39.10 79.96 53.63 42.80 80.78
Naive 44.71 34.76 58.32 44.86 34.89 58.78 46.78 36.40 61.17
Boulder
N-HiTS-Boulder
global
24.96 20.44 42.39 24.83 19.70 49.27 23.68 18.79 47.69
N-HiTS-Boulder
local
28.01 22.13 67.26 28.64 23.11 83.71 27.04 21.31 71.15
N-HiTS-London
global
31.70 26.65 42.03 35.00 30.04 43.62 51.98 47.19 51.29
Transformer 29.56 23.74 72.69 25.86 20.82 54.54 24.48 19.49 51.92
ARIMA 34.80 28.34 208.56 35.95 30.21 324.58 25.58 20.30 61.20
Naive 25.99 20.78 53.76 25.67 20.53 53.26 24.05 19.10 49.82
apparent that fine-tuning hyperparameters for each in-
dividual model is crucial for success. For instance,
the Local N-HiTS model, although designed for a
fair comparison, emphasizes the need for customiz-
ing models to suit particular time series data. The
Transformer-based approach, despite being touted as
state-of-the-art in previous work, couldn’t be entirely
replicated in our setup, possibly due to differences in
data handling and potential overfitting. The ARIMA
model, while adjusted to align with N-HiTS parame-
ters, might have benefited from a wider range of hy-
perparameter exploration, particularly for complex,
non-stationary time series like those in the London
dataset. Conversely, the global modeling approach
stands out by simplifying the modeling process, sav-
ing valuable time and computational resources, mak-
ing it especially advantageous when dealing with a
large number of time series.
In assessing our forecasting models, RMSE,
MAE, and MAPE are used to evaluate their perfor-
mance comprehensively. The proximity between re-
ported MAE and RMSE values might be due to the
dataset’s limited outlier presence, minimizing the im-
pact of RMSE’s outlier-penalizing nature. MAPE, al-
though scale-invariant, demonstrated high sensitivity
to the low signal-to-noise ratio in our context, lead-
ing to exaggerated errors. The elevated MAPE val-
ues likely stem from the challenges posed by this low
signal-to-noise ratio, causing the models to struggle
with accurate predictions amidst noise and outliers.
7 CONCLUSION
In this study, a novel framework is presented, tailored
to tackle the complexities of forecasting EV charg-
ing demand at multiple charging stations over longer
periods of time. By considering several time series, a
clearer understanding of demand variations and trends
is gained. Moreover, by evaluating these models over
extended periods, the aim is to ensure their durability
and adaptability, reflecting the actual dynamics ob-
served on the ground and providing dependable in-
sights over different periods.
Through a series of experiments, the efficacy
of global deep learning models in enhancing the
accuracy and reliability of demand forecasting for
EV charging demand is demonstrated. The applied
framework not only assesses performance across
varied charging station sites but also leverages the
strengths of these models. Specifically, the N-HiTS
Large-Scale Forecasting of Electric Vehicle Charging Demand Using Global Time Series Modeling
49

model’s capability to discern intricate patterns via
global training distinguishes it from conventional
benchmarks, emphasizing its utility for real-world ap-
plications that necessitate precise and robust time se-
ries predictions.
In exploring the capacity of global deep learning
models to predict demand at newly established charg-
ing stations, which were previously unobserved, the
adaptability of the N-HiTS Model to unfamiliar data
from various stations is examined. The results empha-
size its consistent ability to generalize across diverse
datasets, showcasing its reliability in delivering accu-
rate forecasts for a wide range of datasets.
Lastly, additional analysis of the N-HiTS model’s
generalization performance is provided. By exploring
the effects of varying training lengths on the model, a
deeper understanding of its strengths and limitations
is gained. The experiment highlights the superior ro-
bustness of global learning while shedding light on
the intricate and sometimes unpredictable behavior of
local learning. These insights provide valuable guide-
lines for the implementation of global deep learning
models across diverse contexts and requirements.
The forecasting of EV charging demand using his-
torical data at the level of individual charging sta-
tions remains challenging. The presence of substan-
tial noise within the demand curve of single charg-
ing stations, alongside the limited availability of high-
quality time series within each dataset, as demon-
strated by the data analysis, continues to pose a hur-
dle. Despite these challenges, the study provides
a foundational framework for understanding the dy-
namics of EV charging demand forecasting and of-
fers insights into the potential of global deep learning
models in tackling this complex task.
Future Research. As previously mentioned, one of
the pivotal challenges encountered in this study is
the volatile nature of data. One potential strategy
to alleviate these concerns is to expand the forecast-
ing framework to encompass broader geographical
and temporal dimensions. This could aid in dampen-
ing the inherent noise seen within individual demand
curves, enabling more reliable analysis of cross-series
learning by global deep learning models.
Drawing from the insights provided by (Oreshkin
et al., 2020), there is growing interest surrounding the
application of zero-shot learning for time series fore-
casting. Leveraging pre-trained models across dis-
parate time series could open new horizons in terms
of forecast accuracy and model adaptability.
Lastly, inspired by the methodology presented by
(Yi et al., 2022), clustering time series based on com-
mon attributes offers an intriguing prospect. This
method holds the potential to enhance cross-learning
capabilities among models, thereby fortifying their
generalization capabilities.
REFERENCES
Amara-Ouali, Y., Goude, Y., Massart, P., Poggi, J.-M., and
Yan, H. (2021). A review of electric vehicle load open
data and models. Energies.
Andrenacci, N., Ragona, R., and Valenti, G. (2016). A
demand-side approach to the optimal deployment of
electric vehicle charging stations in metropolitan ar-
eas. Applied Energy, 182:39–46.
Buzna, L., De Falco, P., Khormali, S., Proto, D., and Straka,
M. (2019). Electric vehicle load forecasting: A com-
parison between time series and machine learning ap-
proaches. In 2019 1st International Conference on En-
ergy Transition in the Mediterranean Area (SyNERGY
MED), pages 1–5.
Challu, C., Olivares, K. G., Oreshkin, B. N., Garza,
F., Mergenthaler-Canseco, M., and Dubrawski, A.
(2022). N-hits: Neural hierarchical interpolation for
time series forecasting.
Chen, Y., Kang, Y., Chen, Y., and Wang, Z. (2020). Proba-
bilistic forecasting with temporal convolutional neural
network. Neurocomputing, 399.
Council, P. . K. (2019). Perth & kinross council ev charging
station data. Datasets for Perth & Kinross Council’s
EV charging stations under the ChargePlace Scotland
scheme. Period from 2016 to 2019.
Eddine, M. D. and Shen, Y. (2022). A deep learning based
approach for predicting the demand of electric vehicle
charge. J. Supercomput., 78(12):14072–14095.
Gerossier, A., Girard, R., and Kariniotakis, G. (2019).
Modeling and forecasting electric vehicle consump-
tion profiles. Energies, 12:1341.
Herzen, J., L
¨
assig, F., Piazzetta, S. G., Neuer, T., Tafti,
L. T., Raille, G., Pottelbergh, T. V., Pasieka, M.,
Skrodzki, A., Huguenin, N., Dumonal, M., Ko
´
scisz,
J., Bader, D., Gusset, F., Benheddi, M., Williamson,
C., Kosinski, M., Petrik, M., and Grosch, G. (2022).
Darts: User-friendly modern machine learning for
time series. Journal of Machine Learning Research,
23(124):1–6.
Hu, T., Liu, K., and Ma, H. (2021). Probabilistic electric ve-
hicle charging demand forecast based on deep learn-
ing and machine theory of mind. In 2021 IEEE Trans-
portation Electrification Conference & Expo (ITEC),
pages 795–799.
Huber, J., Dann, D., and Weinhardt, C. (2020). Probabilistic
forecasts of time and energy flexibility in battery elec-
tric vehicle charging. Applied Energy, 262:114525.
H
¨
uttel, F. B., Peled, I., Rodrigues, F., and Pereira, F. C.
(2021). Deep spatio-temporal forecasting of electrical
vehicle charging demand.
Kim, Y. and Kim, S. (2021). Forecasting charging demand
of electric vehicles using time-series models. Ener-
gies, 14(5).
VEHITS 2024 - 10th International Conference on Vehicle Technology and Intelligent Transport Systems
50

Koohfar, S., Woldemariam, W., and Kumar, A. (2023).
Prediction of electric vehicles charging demand: A
transformer-based deep learning approach. Sustain-
ability, 15(3).
Liaw, R., Liang, E., Nishihara, R., Moritz, P., Gonzalez,
J. E., and Stoica, I. (2018). Tune: A research platform
for distributed model selection and training. arXiv
preprint arXiv:1807.05118.
Louie, H. M. (2017). Time-series modeling of aggregated
electric vehicle charging station load. Electric Power
Components and Systems, 45(14):1498–1511.
Moon, H., Park, S. Y., Jeong, C., and Lee, J. (2018). Fore-
casting electricity demand of electric vehicles by ana-
lyzing consumers’ charging patterns. Transportation
Research Part D: Transport and Environment, 62:64–
79.
of Boulder, C. (2020). Electric vehicle charging station
energy consumption. Dataset containing energy con-
sumption data for electric vehicle charging stations in
Boulder, Colorado.
of Palo Alto, C. (2021). Electric vehicle charging station us-
age (july 2011 - december 2020). Open data provided
by the City of Palo Alto containing electric vehicle
charging station usage data from July 2011 to Decem-
ber 2020.
Oreshkin, B. N., Carpov, D., Chapados, N., and Bengio, Y.
(2020). Meta-learning framework with applications to
zero-shot time-series forecasting.
Ren, F., Tian, C., Zhang, G., Li, C., and Zhai, Y. (2022). A
hybrid method for power demand prediction of elec-
tric vehicles based on sarima and deep learning with
integration of periodic features. Energy, 250:123738.
Salinas, D., Flunkert, V., Gasthaus, J., and Januschowski, T.
(2020). Deepar: Probabilistic forecasting with autore-
gressive recurrent networks. International Journal of
Forecasting, 36(3):1181–1191.
Su, S., Zhao, H., Zhang, H., Lin, X., Yang, F., and Li, Z.
(2017). Forecast of electric vehicle charging demand
based on traffic flow model and optimal path planning.
In 2017 19th International Conference on Intelligent
System Application to Power Systems (ISAP), pages
1–6.
Wang, S., Xue, G., Ping, C., Wang, D., You, F., and Jiang,
T. (2018). The application of forecasting algorithms
on electric vehicle power load. In 2018 IEEE Interna-
tional Conference on Mechatronics and Automation
(ICMA), pages 1371–1375.
Xydas, E. S., Marmaras, C. E., Cipcigan, L. M., Hassan,
A. S., and Jenkins, N. (2013). Forecasting electric ve-
hicle charging demand using support vector machines.
In 2013 48th International Universities’ Power Engi-
neering Conference (UPEC), pages 1–6.
Yan, J., Zhang, J., Liu, Y., Lv, G., Han, S., and Alfonzo, I.
E. G. (2020). Ev charging load simulation and fore-
casting considering traffic jam and weather to support
the integration of renewables and evs. Renewable En-
ergy, 159:623–641.
Yi, Z., Liu, X. C., Wei, R., Chen, X., and Dai, J. (2022).
Electric vehicle charging demand forecasting using
deep learning model. Journal of Intelligent Trans-
portation Systems, 26(6):690–703.
Zhu, J., Yang, Z., Mourshed, M., Guo, Y., Zhou, Y., Chang,
Y., Wei, Y., and Feng, S. (2019). Electric vehicle
charging load forecasting: A comparative study of
deep learning approaches. Energies, 12(14).
Large-Scale Forecasting of Electric Vehicle Charging Demand Using Global Time Series Modeling
51
