
Speeding Up the Simulation Animals Diseases Spread: A Study Case
on R and Python Performance in PDSA-RS Platform
Rodrigo Schneider
a
, Felipe Machado
b
, Celio Trois
c
, Glênio Descovi
d
, Vinícius Maran
e
and Alencar Machado
f
Laboratory of Ubiquitous, Mobile and Applied Computing, Polytechnic School,
Federal University of Santa Maria (UFSM), Roraima Av. 1000, Santa Maria, Brazil
{vinicius.maran, alencar.machado}@ufsm.br
Keywords: Digital System, Disease Spreading Simulation, Intelligent System.
Abstract: The control and prevention of livestock diseases play a crucial role in safeguarding business continuity,
simulating disease prevention and control measures are vital to mitigate future epidemics. In this sense,
modelling systems can be an effective tool that allows the simulation of different ways of spreading diseases
by configuring parameters allowing testing of different prevention measures. This work investigates
enhancing a system that simulates disease spread processes in animals. The stochastic model system was
developed in R; however, given a large amount of data and intense processing of stochastic functions that
simulate spreading and control actions, it required optimization. We focused on translating and modifying it
to Python using packages focused on data analysis, aiming to speed up the system execution time. We
conducted experiments comparing high computational cost functions executed in the actual model R with the
new proposal implemented in Python. The results showed that rewriting the code in Python has advantages
such as performance in time execution, which in Python is more than four times faster than R, memory usage
consumption in R uses 460 MB and 315 MB in Python.
1 INTRODUCTION
With the advancement of technology in the current
times, the use of data for decision making has become
increasingly important. This data is generated
through various digital channels, such as mobile
devices, the Internet, social media, e-commerce sites,
among others. Using the data has proven to be of great
use since its inception, as companies began to realise
its importance for various business purposes. With
this amount of data it is possible now, with the
increase of processing power to develop intelligent
systems that can help to make decisions, create
simulation about critical situations. In this sense,
several applications are using real data to create
intelligent systems in different areas with different
a
https://orcid.org/0009-0007-9095-9475
b
https://orcid.org/0009-0005-8179-1987
c
https://orcid.org/0000-0002-7386-9749
d
https://orcid.org/0000-0002-0940-9641
e
https://orcid.org/0000-0003-1916-8893
f
https://orcid.org/0000-0002-6334-0120
applications, such as healthcare, transportation, and
sustainable ecosystems that can help to avoid
economical loss in any kind of business (Omolbanin
et al.,2017
).
An example of intelligent systems is the control
and prevention of animal diseases. It is important for
public health, and may include measures such as
vaccination of animals, vector control, good hygiene
and food handling practices, as well as monitoring of
diseases in animals. In addition, globalization and
international trade in animals and animals’ products
have increased the spread of zoonotic disease
worldwide. It is essential that effective prevention
and control measures are implemented to minimize
the risk of epidemics. The dynamics of farms pose
some risks for the spread of diseases, such as isolation
Schneider, R., Machado, F., Trois, C., Descovi, G., Maran, V. and Machado, A.
Speeding Up the Simulation Animals Diseases Spread: A Study Case on R and Python Performance in PDSA-RS Platform.
DOI: 10.5220/0012556200003690
Paper published under CC license (CC BY-NC-ND 4.0)
In Proceedings of the 26th International Conference on Enterprise Information Systems (ICEIS 2024) - Volume 2, pages 651-658
ISBN: 978-989-758-692-7; ISSN: 2184-4992
Proceedings Copyright © 2024 by SCITEPRESS – Science and Technology Publications, Lda.
651

of animal lots, human traffic, truck traffic, the useful
area of the farm or farm can influence possible
transmission of diseases (Jason et al.,2022). In this
area, one intelligent system using real data was
proposed by Descovi et al,.2022, which uses data
from farms to simulate the spread of diseases in
animals (e.g. cattle, swine, and small ruminants). The
system also allows researchers to test different actions
to control these diseases. As for livestock, it is
possible to control and isolate animals with disease,
so all animal transport is controlled. With this, it is
possible to develop a system that can simulate the
impact of a disease that spreads when an infected
animal is transported and create scenarios about the
life cycle of the disease and the impact on the farm or
production of the region (Jason et al,.2022).
This system was developed in R Language, using real
data collected from farms in Rio Grande do Sul state
(Brazil) and used in PDSA-RS platform (Descovi et
al, 2021, Perlin et al., 2023). It is noteworthy that the
R language was developed specifically for statistical
analysis and data visualization, but, when it comes to
data handling performance, it is important to consider
factors including: dataset size, data format, hardware
processing power, and the efficiency of the libraries
used to read and manipulate data (Ioannis,2020
). As
the volume of input data increases, the existing
system developed in R faces performance challenges.
To address this, we decided to reimplement some
computationally intensive functions into Python. This
shift enables us to conduct a comparative analysis of
performance and processing speed between the two
implementations (R and Python). By migrating to
Python, we aim to enhance the system’s efficiency
and efficacy, ensuring it can handle the ever-
expanding data landscape more effectively and
deliver optimal results. This transition allows us to
explore the potential benefits of Python performance
capabilities and adapt our system accordingly.
The methodology for developing the performance
improvement initiated by testing Python and R
functions used in the implementation of the system.
Firstly, we investigated different libraries to speed up
reading the dataset. After this, we analyzed the
different ways to update the dataset cells values, as
many functions include situations that are necessary
to change these values based on specific conditions.
In the second phase of the study, we will improve the
performance rewriting the code in Python
programming language, all the functions of the
model, all the functions work with update in values in
the data frame, change the information when the day
moves across the disease spread process, this needs
for update in values in the data frame has better
performance in Python.
The present paper is structured as follows. The
next section presents the related work on intelligent
systems applied to disease spread problems, showing
R and Python performance comparison studies.
Section 3 describes the disease spread and control
system, highlighting the functions targeted in this
work. Section 4 describes our evaluation and results
comparing the execution time of the original
functions implemented in R and their version in
Python. Section 5 outlines the conclusions and
research opportunities that emerged from this work.
2 MOTIVATION AND RELATED
WORK
This section presents about the digital system, that we
are working to improve performance and time execu-
tion and some related papers about the programming
language R and Python, and its primary characteristics.
2.1 Compartmental Stochastic Model
Stochastic modelling is a mathematical technique used
to model systems or processes that involve randomness
or uncertainty. The term "stochastic" refers to
randomness, and stochastic modeling involves
describing the behavior of systems or phenomena in
probabilistic terms. Common techniques in stochastic
modeling include stochastic differential equations,
Markov chains, queuing theory and Monte Carlo.
These methods provide ways to simulate, analyze, and
make predictions about complex systems affected by
randomness (Shah, 2022).
Infectious diseases are known as one of the most
critical threats to global health today. Climate change
and the accelerated growth of population are some
causes of the disease spread among humans. This
leads to increased infection at the global level; some
systems use water waste to control the level of
infection in some areas, which can be monitored in
real-time at the community level can help to avoid or
control some diseases and infections and act to
prevent the spread of the disease (Nathalie & Barbara,
2021). Several disease transmission systems were
developed and used to examine control strategies
(Rohit et al., 2020). Some systems to control the
spread were developed based on cell phone location,
using data from the geolocation of the cell phone to
understand the movement of the population and study
the spread of the disease process (Sachi et al., 2021).
ICEIS 2024 - 26th International Conference on Enterprise Information Systems
652

The system in the scope of this work is a model that
simulates the spread of disease in animals cultivated
for human consumption, so controlling the disease
and the spreading process is important because it can
have an economic impact in the region. Even if we
can isolate the animals that are infected, the animal
transport, circulation of employees in the farm, the
logistics to deliver product and material can impact
the spread process. The system created to prevent and
simulate the disease spread uses a stochastic model
developed in R, this digital system was created
considering real data collected for the transporting
process of the animals between farms located in Rio
Grande do Sul, Brazil (Manuel et al., 2021)..
2.2 R and Python Comparison
As stated before, in this work we implemented in
Python an intelligent disease spread and control
system for the spread, originally implemented in R.
Python and R are programming languages used in
data analysis, and efforts have been made to support
our research practices using these two computational
programming languages. However, an important
focus has been given to the visualization of
researchoriented studies and their comparable
efficiencies in analyzing large fragmented datasets.
While Python is a general-purpose language with an
easy-to-understand syntax, R’s functionality was
designed with statisticians in mind, providing field-
specific advantages such as great data visualization
capabilities, but R lacks performance and speed
process (Anupam et al., 2021).
The R programming language is a free, powerful,
open-source software package with extensive
statistical computing and graphics capabilities due to
its high-level expressiveness and multitude of domain
specific packages. R prioritizes ease of use and data
exploration, which can lead to less efficient memory
management compared to languages like C or Java,
which prioritize performance and memory efficiency
(Weijia, et al., 2016
).
The Python language is a general-purpose, open-
source tool for web, internet, and software
development applications; education and academia;
and numerical and scientific tasks, among others. In the
field of data analysis, some of the common packages
are: Pandas and Polars, ideal for data manipulation;
Statsmodels, for modelling and testing; scikit-learn, for
classification and machine learning tasks; NumPy
(Numerical Python), for numerical operations and
vectors; and SciPy (Scientific Python), for scientific
tasks, other libraries like Dask to huge amount of data.
One big advantage of Python language is that for data
extraction and data analysis is the possibility to use the
API Apache Spark and use Pyspark to work with big
data and with Spark Streaming that is data near real
time (S Saabith et al., 2021).
Python is favoured for data science, AI and
machine learning due to its concise code, enabling
easy testing and focusing on actual programming. It
uses significantly less code compared to other
languages, Python ranks second after Ruby in lines of
code required for projects, making it a top choice for
ML and AI. It boasts simplicity, fewer keywords, and
a clear syntax, making it accessible for students and
newcomers. Python prioritizes readability, fostering
collaboration and rapid open-source project
development (Abhinav et al., 2019).
One library used in this proposal of a new model
in this digital system is Pandas, that is used for data
extraction and analysis, which in the current version
2.0, has implementations such as the use of PyArrow,
which in turn is possible to accelerate the process and
make operations more efficient in terms of memory,
using the C++ implementation of Arrow. Arrow
allows sharing data between processes without the
need to copy them, which improves performance and
reduces memory consumption. In this sense,
PyArrow is a library that provides a bridge between
Python and Apache Arrow, offering resources to
work with data in a columnar format in an efficient
way and interoperable with other programming
languages (Pantelis et al., 2019
). For the R language,
the two libraries we use in the tests are data.table and
tidyverse, the tidyverse package is a collection of R
packages that were developed to facilitate the
manipulation, analysis and visualization of data.
Within it we will use dplyr which is one of the
packages used in tidyverse, offering a consistent and
intuitive syntax to perform data manipulation
operations. The dply package also has the advantage of
having a more readable and intuitive syntax, and its
philosophy is based on “data manipulation grammar”,
this package is used a lot in data analysis and
exploration in conjunction with ggplot. In the model
the data manipulation and data visualization process
are created using the tidyverse package. The data.table,
that is used for data reading in the digital system, is
known for its efficiency and speed in processing large
data sets, it is fast in process of filtering, grouping,
modifying data, there are several reasons why
data.table is fast, but one of the main ones is that, unlike
many other tools, it allows you to modify the
information in your table by reference, i.e. it changes
in place rather than requiring the object to be recreated
with the modifications. This means that when using
data.table you need to use the <- operator less often.
Speeding Up the Simulation Animals Diseases Spread: A Study Case on R and Python Performance in PDSA-RS Platform
653
Python at the moment is the first choice of even
the topmost companies in the world such as Amazon,
Facebook, Spotify and Instagram, that have the
challenge to deal with enormous amounts of data, for
their needs, and for their clients’ needs, for data
processing and data analysis (Sebastiaan et al., 2021).
3 DISEASES SPREAD AND
CONTROL SYSTEM
The digital system proposed by the author
(
CARDENAS
et al., 2022). It was designed to
demonstrate the potential for the spread of infectious
animals, considering transmission through animal
movements. The system also implements the
simulation of control actions. These control actions
can, for example, prevent farms from receiving or
shipping infected animals such as culling, isolation of
animals, increased hygiene measures, or vaccination.
As the present work aims at improving the most
computational intensive functions, they will be
detailed in the next subsections. For a comprehensive
understanding of the system, please refer to the
original paper (
CARDENAS
et al., 2022).
3.1 Animal Movement Representation
The system uses Social Network Analysis (SNA)
methods to characterize animal trade patterns, and the
between-farm total of animals moved is represented
in the system as a directed graph, where each farm is
represented as a “node” and the movements among
farms are represented as “edges”. Each edge connects
a specific node origin to a specific node destination,
maintaining also the type and number of animals that
are being moved. The system maintains an event
dataset with data on origin, destination, type, and
number of animals, used to construct the movement
graph. The between-farm movements among farms of
different species, therefore considering a real multi-
host contact network of movement data collected
from (
CARDENAS
et al., 2022).
3.2 Disease Spread Dynamics
The system applies a stochastic simulation algorithm
(SSA) to simulate the disease spreading, as well as,
vital dynamics (birth and deaths) of animals inside
each farm. The system incorporates within farm and
between farm dynamics through a susceptible
infectious model using the temporal animal
movement data explicitly with a higher effective
contact rate to ensure an efficient disease
transmission over the simulations.
The within-farm dynamics is represented by a
state machine composed of four states. Transition
from susceptible (S), to exposed (E), to infected (I),
to recovered (R). Every state is represented as
compartments for each farm, at a rate proportional to
a frequency dependent transmission parameter (𝛽).
3.3 Control Action Zones
After an initial silent spread where animals on some
farms became infected, control and containment of
the disease agent is essential for eradication and
recovery. Quarantine and movement control are
examples of actions to protect animal health, helping
to prevent the disease from being transmitted to non-
infected populations (James, 2007). These actions are
applied to specified control zones, which are defined
through specific user parameters.
This function defines control action zones in
geographic locations, classified or designated
according to specific disease or disease-free status
criteria. These designations help to associate specific
response activities with specific locations.
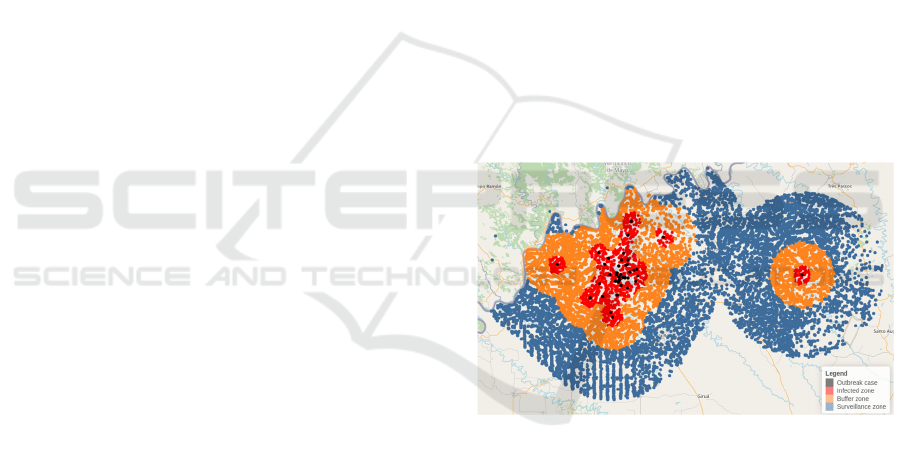
Figure 1: Control zone representation.
Figure 1 shows the control action zones defined as
outbreaks for farms containing infected animals, the
infected zone containing farms within a 3 km area
around the outbreak, the buffer comprising farms in a
region considering 7 km, and the surveillance zone
was defined as 15 km from the outbreak.
3.4 Vaccination
This function simulates the animal vaccination
process. The process occurs during the disease spread
where vaccinated animals are moved from SEIR
compartments to a V (vaccinated) compartment,
according to the vaccination efficacy and specific rate
conversion day by day, specified by the user when
ICEIS 2024 - 26th International Conference on Enterprise Information Systems
654
defining the control actions. This implies changing
values in the dataset row by row, which can be a
problem in R when the model grows in size.
4 EVALUATION AND
DISCUSSION
This section reports the experiments carried out,
showing the comparison time between the different
tested approaches and discussing the results obtained.
It is divided in two subsections, where the first shows
functions implemented in the languages libraries and
the function call itself while the second presents the
execution time of complex functions developed to
simulate different aspects of the disease spreading.
All results presented through this section were
measured in seconds.
The tests were performed on a computer with the
following specifications. CPU Intel(R) Core(TM) i7-
8650U, 8 cores, 1.90GHz, 16Gb RAM, Linux Debian
5.10.162-1 (2023-01-21) x86_64 operating system.
There are some functions that were developed in the
digital system. One is to create a simulation about
movement of animals from one farm to another farm,
that is a root of some disease spread process, this
process occurs during 15 days. The data reading of
events is using data.table, we will compare with
Pandas and Polars in Python. Using two csv files, one
with 65Mb and other with 225MB, the reading
process will test 100 times and we will use the mean.
4.1 Reading Datasets and Function
Calling
The first test was performed for reading two datasets
with sizes 65MB and 225MB. For Python, we tested
two different libraries (Pandas and Polars), while
Tidyverse and data.table were used to read the same
datasets in R. The test was repeated 100 times and the
average execution times are shown in Table 1.
Figure 2 and Figure 3 show the distribution,
through boxplots, of the time for reading the datasets.
We can see some outliers in the boxplot distribution,
but in this case, we will consider them as special
cases, and they do not change our test results.
Table 1: Mean time for reading process.
Dataset Pandas Polars Tidyverse Data.table
65MB 0.526396 0.257375 1.093194 0.20933
225MB 4.377422 0.480025 15.98519 2.59795
Figure 2: Boxplot graph distribution times for reading for
65 MB dataset.
Figure 3: Box plot graph distribution times for reading the
225 MB dataset.
It is possible to observe that in the process of reading
the small dataset, the Polars library in Python and the
Data.table in R have equivalent reading speeds, with
a slight advantage for Data.table, plus increasing the
size of the dataset to Polars stands out and becomes
the fastest in the reading process, in our case is good,
because the system can grow with more data and
bigger datasets, Polars is around 5 times faster than
Data.table, mainly due to its construction in Rust,
which is a low-level language that in turn is more
efficient, and in Polars it is possible to work in
parallel and scale the system and maintain the
performance, if the digital system grow (Ruizhu et
al.,2018).
For the R language, data.table proves to be very
efficient due primarily to being built in C, the
data.table package is more performant than the
Tidyverse package, which includes the Dplyr
package, the data.table in several operations does not
copy it, filters and selects in the object itself, which
saves memory and time in the process and can
improve the performance of the model, but in some
situations it is necessary and practical using the
tidyverse package (Matt & Joshua, 2016). As the
datasets are passed as arguments to the functions, we
compare the time just for calling the previous
function in both languages. On average, the time in
Python was 0.000001533 seconds, while calling a
function in R took 0.2811756256 seconds. In terms of
Speeding Up the Simulation Animals Diseases Spread: A Study Case on R and Python Performance in PDSA-RS Platform
655
function calls, Python code is converted to the
machine code before being executed, while R code is
interpreted line by line, thus making it more
performative in this process. When the function
grows with more parameters, the difference in
performance in both languages also grows (Yi Lin et
al., 2016).
4.2 Spreading and Control Functions
for the Digital System
This section compares the digital system's most
computationally intensive functions model
implemented in R and Python. This study uses the
three most complex computational performance
functions to improve the performance.
4.2.1 Animal Movements
The first function simulates the animal movement
across the farms. It uses an event dataset containing
farm-to-farm animal movements and number of
animals being moved. We defined 15 days for moving
animals from the dataset of 65Mb, which contains
337.600 farms. This simulation creates the disease
spread situation in the moving process.
Figure 4: Distribution for function simulating animal's
movements for 15 days.
As we can see in Figure 4, Python is around eight
times faster than R for this function. This can be
explained as the Python version using an index on the
farm’s IDs, speeding up the search procedure for
modifying the dataset's number of animals.
4.2.2 Disease Spread Dynamics
The function simulates the spatial disease spread
driven by the geographic distance between farms. It
uses statistical methods based on the initial
parameters to update the number of infected animals
near infected farms. In this simulation, there were 52
infected farms and during the execution, 48.530 farms
had their status modified from this function. The
execution times for this update process in both
languages are presented in Figure 5.
Figure 5: Graph distribution for the local transmission
dynamics.
4.3 Control Zones
In this section we will study and improve the
performance and time execution from the functions
that simulate the vaccination process and control zone
simulation, that is control and isolate farms that
the disease is already vaccinated or isolated in the
process to control the infection, this function receives
data from the vaccination function and inserts and
updates the data in the data frame. The results are
presented in Figure 6.
Figure 6: Graph distribution for function simulating the
update and data in the function that controls the infected
zone.
4.3.1 Vaccination
The next function simulates the animal vaccination
process. The results shown in Figure 7 represent a
vaccination occurring between 6 and 14 days after the
disease spreads.
ICEIS 2024 - 26th International Conference on Enterprise Information Systems
656
Figure 7: Graph distribution for function simulating the
vaccination process from day six until day 14.
In the system, when the animal is vaccinated, the
dataset is updated row by row, updating the
vaccination status of each animal. This explains why
using Python language is four times faster than R in
this application. Finally, Table 2 summarizes the
function's average results previously seen in this
section.
Table 2: Average execution time of computationally
intensive functions.
Move
Function
Animal
Vaccination
Control
Infected
Farms
Spread
disease
Python 10.12597 14.34065
0
.3209121
4
3.046755
R 83.05695 60.686126
6
.4253064
6
4.128237
In terms of memory usage, the process of the
digital system using the R language is 460 MB, and
the Python language with the same application has
315 MB of memory usage. Python has a feature called
function memorization, where you can cache the
results of a function for specific inputs, improving
performance for expensive computations, which
helps to control memory usage (Xing Cai et al.,
2005). As an overview, the Python implementation
exhibited remarkable performance and significantly
faster processing speeds, presenting a promising
avenue for enhancing the overall system, aiming to
achieve responsiveness and reducing the execution
time.
5 CONCLUSIONS
Based on the tests carried out, it is possible to verify
that in a model with many functions and a lot of data
processing, data reading, and update in dataset, the
optimized solution would be Python, because of the
advantage in functions (time execution and speed
process) and the use of Polars for data analysis. The
implementation in Python proved to be more efficient
than in R, mainly due to its constructive
characteristics and objectives, with some great
advantages in performance, speed process and
memory usage. In terms of reading speed of large
datasets, Polars is more efficient in reading than
Pandas using the Python language. Polars is built in
Rust which guarantees more speed than Pandas, the
great advantage of Polars is that it works in parallel,
so even with an increase in data volume it maintains
its performance, in addition Polars is considered a
library that has Lazy operation, that is, only perform
the function, when necessary, that is, it saves
memory, Polars can work in parallel, which can
improve speed process. Even though Python is slower
in runtime and has some design restrictions as
compared to compiled languages like C or C++.
Python is preferred by scientists and developers in the
field of data analytics, numerical computations and
almost all technical domains, like AI and Deep
Learning. The best approach for work in the model,
according with the test, is to rewrite in Python, using
Polars in data reading (files .csv) and data
manipulation files, mainly because some digital
system grow and the question about memory usage in
Python, in R all objects are stored in memory and
when the system grows, we can have a problem.
Polars, have the lay attribute to save memory and if
necessary, in long term work in parallel, which can be
an advantage in this model, because it’s possible to to
speed up the simulation work with more simulation in
parallel.
For future work it could be important to try to
implement Rust, as Rust is compiled directly to the
machine code, has high performance, works in
parallel and has better memory control management,
which is for some authors the next step in data
analysis (Bugden & Alahmar, 2022).
ACKNOWLEDGEMENTS
This research is supported by FUNDESA, project
“Application of Machine Learning Techniques to
Predict the Prevalence of Diseases in the Processes
of Certified Swine Breeding Fars and Monthly Pige
Epidemiological Sheet” (UFSM/057438). The
research by Vinícius Maran is partially supported by
CNPq grant 306356/2020-1 (DT-2).
Speeding Up the Simulation Animals Diseases Spread: A Study Case on R and Python Performance in PDSA-RS Platform
657

REFERENCES
Anupam Baliyan, Kuldeep Singh Kaswan, and Jagjit Singh
Dhatterwal. An Empirical Analysis of Python
Programming for Advance Computing. In 2022 2nd
International Conference on Advance Computing and
Innovative Technologies in Engineering (ICACITE).
IEEE, 1482–1486
Xing Cai, Hans Petter Langtangen, and Halvard Moe. 2005.
On the performance of the Python programming
language for serial and parallel scientific computations.
Scientific Programming 13, 1 (2005), 31–56.
Ioannis Charalampopoulos. The R language as a tool for
biometeorological research. Atmosphere (2020).
Jason A Galvis, Cesar A Corzo, Joaquín M Prada, and
Gustavo Machado. 2022. Modeling between-farm
transmission dynamics of porcine epidemic diarrhea
virus: characterizing the dominant transmission routes.
Preventive Veterinary Medicine 208 (2022), 105759.
Jason A Galvis, Chris M Jones, Joaquin M Prada, Cesar A
Corzo, and Gustavo Machado. 2022. The between-farm
transmission dynamics of porcine epidemic diarrhoea
virus: A short-term forecast modelling comparison and
the effectiveness of control strategies. Transboundary
and Emerging Diseases 69, 2 (2022).
Ruizhu Huang, Weijia Xu, Silvia Liverani, Dave Hiltbrand,
and Ann E Stapleton. 2018. A case study of r
performance analysis and optimization. In Proceedings
of the Practice and Experience on Advanced Research
Computing. 1–6.
Manuel Jara, Rocio Crespo, David L Roberts, Ashlyn
Chapman, Alejandro Banda, and Gustavo Machado.
2021. Development of a Dissemination Platform for
Spatiotemporal and Phylogenetic Analysis of Avian
Infectious Bronchitis Virus. Frontiers in Veterinary
Science 8 (2021), 624233.
Rohit C Khanna, Maria Vittoria Cicinelli, Suzanne S
Gilbert, Santosh G Honavar, and Gudlavalleti VS
Murthy. 2020. COVID-19 pandemic: Lessons learned
and future directions. Indian journal of ophthalmology
68, 5 (2020), 703.
Yi Lin, Stephen M Blackburn, Antony L Hosking, and
Michael Norrish. 2016. Rust as a language for high
performance GC implementation. ACM SIGPLAN
Notices 51, 11 (2016), 89–98.
Sachi Nandan Mohanty, Shailendra K Saxena, Suneeta
Satpathy, and Jyotir Moy Chatterjee. 2021.
Applications of artificial intelligence in covid-19.
Springer.
Abhinav Nagpal and Goldie Gabrani. 2019. Python for data
analytics, scientific and technical applications. In 2019
Amity international conference on artificial intelligence
(AICAI). IEEE, 140–145.
Sebastiaan Alvarez Rodriguez, Jayjeet Chackrabroty,
Aaron Chu, Ivo Jimenez, Jeff LeFevre, Carlos
Maltzahn, and Alexandru Uta. 2021. Zero-cost, arrow-
enabled data interface for apache spark. In 2021 IEEE
International Conference on Big Data (Big Data). IEEE.
James A Roth. 2007. Animal Disease Information and
Prevention Materials Developed by the Center for Food
Security and Public Health. Iowa State University
Animal Industry Report 4, 1 (2007).
S Saabith, T Vinothraj, and M Fareez. 2021. A review on
Python libraries and Ides for Data Science. Int. J. Res.
Eng. Sci 9, 11 (2021), 36–53.
Nathalie Sims and Barbara Kasprzyk-Hordern. 2020.
Future perspectives of wastewater-based epidemiology:
monitoring infectious disease spread and resistance to
the community level. Environment international. 2020.
Pantelis Sopasakis, Emil Fresk, and Panagiotis Patrinos.
2020. OpEn: Code generation for embedded nonconvex
optimization. IFAC-PapersOnLine 53, 2 (2020), 6548–
6554.
Matt Wiley and Joshua F Wiley. 2016. Advanced R: Data
Programming and the Cloud. Springer.
Weijia Xu, Ruizhu Huang, Hui Zhang, Yaakoub El-
Khamra, and David Walling. 2016. Empowering R with
high performance computing resources for big data
analytics. Conquering Big Data with High Performance
Computing (2016), 191–217.
Omolbanin Yazdanbakhsh, Yu Zhou, and Scott Dick. 2017.
An intelligent system for livestock disease surveillance.
Information Sciences 378 (2017), 26–47.
Bugden W, Alahmar A. Rust: The programming language
for safety and performance. arXiv preprint
arXiv:2206.05503. 2022 Jun 11.
Shah Hussain, Elissa Nadia Madi, Hasib Khan, Haseena
Gulzar, Sina Etemad, Shahram Rezapour, Mohammed
K. A. Kaabar, "On the Stochastic Modeling of COVID-
19 under the Environmental White Noise", Journal of
Function Spaces, vol. 2022.
Descovi, G.; Maran, V.; Ebling, D. and Machado, A.
(2021). Towards a Blockchain Architecture for Animal
Sanitary Control. In Proceedings of the 23rd
International Conference on Enterprise Information
Systems - Volume 1: ICEIS; ISBN 978-989-758-509-8
Cardenas, Nicolas C.; Lopes, Francisco PN; Machado,
Gustavo. Modeling foot-and-mouth disease
dissemination in Brazil and evaluating the effectiveness
of control measures. bioRxiv, p. 2022.06. 14.496159,
2022.
R. Perlin, D. Ebling, V. Maran, G. Descovi and A.
Machado, "An Approach to Follow Microservices
Principles in Frontend," 2023 IEEE 17th International
Conference on Application of Information and
Communication Technologies (AICT), Baku,
Azerbaijan, 2023, pp. 1-6, doi: 10.1109/AICT59525.2
023.10313208.
ICEIS 2024 - 26th International Conference on Enterprise Information Systems
658
