
Performance Evaluation of a ROS2 Based Automated Driving System
Jorin Kouril
1
, Bernd Sch
¨
aufele
1
, Ilja Radusch
2
and Bettina Schnor
3
1
Fraunhofer Institute for Open Communication Systems (FOKUS), Berlin, Germany
2
Daimler Center for Automotive Information Technology Innovations (DCAITI), Berlin, Germany
3
Department of Computer Science, University of Potsdam, Potsdam, Germany
Keywords:
Automated Driving, Intelligent Vehicles, Performance Evaluation, Intelligent Transport Systems.
Abstract:
Automated driving is currently a prominent area of scientific work. In the future, highly automated driv-
ing and new Advanced Driver Assistance Systems will become reality. While Advanced Driver Assistance
Systems and automated driving functions for certain domains are already commercially available, ubiquitous
automated driving in complex scenarios remains a subject of ongoing research. Contrarily to single-purpose
Electronic Control Units, the software for automated driving is often executed on high performance PCs. The
Robot Operating System 2 (ROS2) is commonly used to connect components in an automated driving system.
Due to the time critical nature of automated driving systems, the performance of the framework is especially
important. In this paper, a thorough performance evaluation of ROS2 is conducted, both in terms of timeliness
and error rate. The results show that ROS2 is a suitable framework for automated driving systems.
1 INTRODUCTION
Automated driving is a trending area of research,
with a lot of effort from both academia and econ-
omy. Modern vehicles are equipped with many Ad-
vanced Driver Assistance Systems (ADAS) and even
automated driving functions, such as highway pilots
(Binder et al., 2016). Despite the existence of these
systems, automated driving higher than level 3 (SAE,
2021) is still a challenge, especially in complex and
urban environments.
In most commercial cars, there are many differ-
ent Electronic Control Units (ECU), each for a spe-
cific purpose. Vehicle bus systems, most prominently
CAN and FlexRay (Reif, 2011), allow these systems
to communicate with each other. Research in auto-
mated driving shows that the tasks for this challenge
are more complex and have high computational re-
quirements. For example, the evaluation of sensor
values to detect objects, is often performed with neu-
ral networks (Spielberg et al., 2019). Also, some of
the tasks regarding automated driving are linked, e.g.,
object detection and localization.
For the development of automated driving systems
(ADS), the Robot Operating System (ROS) is widely
used (Reke et al., 2020), especially the Robot Operat-
ing System 2 (ROS2). The tasks regarding automated
driving can be more efficiently performed on one or
several central computation units, e.g., high perfor-
mance PCs. As the realization of automated driving
consists of several subtasks, a modular software archi-
tecture is suitable. An automated vehicle must sense
and detect other objects, it must localize itself, and it
must plan and control a trajectory. ROS2 facilitates
simple communication between modules through a
publish and subscribe pattern. As it was designed
for the development of robots, it also provides a rich
ecosystem of useful libraries for automated driving,
such as probabilistic filters and planning algorithms.
ROS2 abstracts middleware communication
across several levels in a high-level API. The foun-
dation for message exchange is a data distribution
service (DDS), defined by the standard of the same
name (Object Management Group, 2015). The
connection between the DDS and ROS2 is abstracted
using the ROS middleware interface (rmw). The
core functionality of ROS2 is implemented in the
ROS client library (rcl), which is based on the
rmw. Applications are normally implemented in
language-specific wrappers of the rcl.
The control of an automated vehicle imposes se-
vere temporal and reliability requirements. The de-
tection of obstacles and the planning of a path algo-
rithm must be completed within a certain time frame.
Furthermore, information must not be lost. Having
a modular architecture with a distributed framework,
52
Kouril, J., Schäufele, B., Radusch, I. and Schnor, B.
Performance Evaluation of a ROS2 Based Automated Dr iving System.
DOI: 10.5220/0012556800003702
Paper published under CC license (CC BY-NC-ND 4.0)
In Proceedings of the 10th International Conference on Vehicle Technology and Intelligent Transport Systems (VEHITS 2024), pages 52-63
ISBN: 978-989-758-703-0; ISSN: 2184-495X
Proceedings Copyright © 2024 by SCITEPRESS – Science and Technology Publications, Lda.

such as ROS2, demands that the framework itself is
performing efficiently. The high amount data that is
necessary to be processed for automated driving, e.g.,
LIDAR point clouds and camera streams, makes this
task even more challenging.
Therefore, in this paper, a performance evalua-
tion of the ROS2 framework in an automated vehi-
cle is presented. Particularly, the suitability of dif-
ferent middleware implementations for vehicular ap-
plications is investigated. These implementations are
compared in terms of latency and error susceptibility.
In this context, latency refers to the time elapsed from
message transmission to reception. Besides, the error
rate is quantified as packet loss. The scenarios for the
analysis vary in terms of the number of components
in the graph and the size and frequency of individual
data packets. All evaluations are performed on an ac-
tual on-board PC in an automated vehicle.
The paper is structured as follows: In section 2,
an overview of the related work is given. Section 3
explains the ADS used for the evaluation in detail.
The implementation of the software for evaluation is
shown in section 4. Consequently, in section 5 the re-
sults are presented and discussed, before an overview
and outlook is given in section 6.
2 RELATED WORK
Several architectures for automated driving based on
ROS or ROS2 exist. Some of the most prominent
ones are Autoware.auto (The Autoware Foundation,
2023) and Apollo (Baidu Apollo consortium, 2023).
These systems show that ROS2 is a suitable frame-
work for developing an ADS. However, due to their
complexity, for research purposes, more lightweight
approaches can lead to faster results and better per-
formance. An analysis of the performance of Auto-
ware.auto yields good results, but this is not general-
ized to ROS2 (Li et al., 2022).
In another publication, an alternative architecture
for a ROS2 based automated vehicle is presented
(Reke et al., 2020). The system is described in detail
and a performance evaluation is presented. This work
indicates that ROS2 is suitable for real time opera-
tions. However, the Data Distribution Services (DDS)
is not exchanged for analysis, and packet loss is not
examined, either.
An assessment of the performance of ROS2 took
place very early in the development stage (Maruyama
et al., 2016). Here, a comparative analysis is con-
ducted between ROS1 and ROS2 to assess the poten-
tial positive impact of the novel concepts introduced
in ROS2. At that point of time, ROS2 does not exhibit
superior performance compared to ROS1. However,
a notable improvement can be observed, particularly
regarding the equal distribution of latencies across all
subscribers.
A different study investigates the real-time capa-
bilities of ROS2 (Guti
´
errez et al., 2018). The evalu-
ation focuses on the ability of ROS2 to achieve soft
real-time capabilities, indicating its potential for ap-
plications with timing constraints. The evaluation
methodology primarily considers one-to-one commu-
nication, while more complex many-to-many scenar-
ios are substituted with artificially generated work-
loads external to the ROS2 applications. This ap-
proach allows for an assessment of the performance
of ROS2 in a controlled environment.
In a more recent work, the performance of the
three official DDS implementations (FastDDS, Cy-
cloneDDS, and RTI Connext) is compared, varying
sending frequencies, packet sizes, and participants
(Kronauer et al., 2021). Consistent with (Maruyama
et al., 2016), it is observed that latency exhibits a
sharp increase beyond the UDP fragment size of
64kB. Furthermore, the authors conclude that DDS
is the primary contributor to latency.
3 AUTOMATED DRIVING
SYSTEM
For automated driving, Fraunhofer FOKUS uses a hy-
brid Mercedes E-Class, which is able to plan and drive
paths in an automated way. The vehicle is used to de-
veloped different ADS, such as automated valet park-
ing (Sch
¨
aufele et al., 2017). It is equipped with com-
munication hardware for cooperative maneuvers as
well (Schaeufele et al., 2017; Eiermann et al., 2020).
Due to its complexity, the overall system is di-
vided in subsystems. As a result of the modular ar-
chitecture, ROS2 was selected, because it allows for
simple communication between components through
a publish and subscribe mechanism. Besides, ROS2
(Macenski et al., 2022) offers many robotic libraries
that can be applied for an ADS. ROS2 is used to im-
plement the components of the architecture.
The design of the system follows the pattern of
Sense, Plan, Act (During and Lemmer, 2016). First,
a representation of the environment of the vehicle is
created with sensing. The sensors are evaluated in the
Perception Unit (PU), which is an on-board PC with
high performance graphics hardware. In the planning
stage, the environment model and other constraints,
such as vehicle parameters, are used for the calcula-
tion of a drivable trajectory for the vehicle. In acting,
the planned trajectory is controlled and executed.
Performance Evaluation of a ROS2 Based Automated Driving System
53
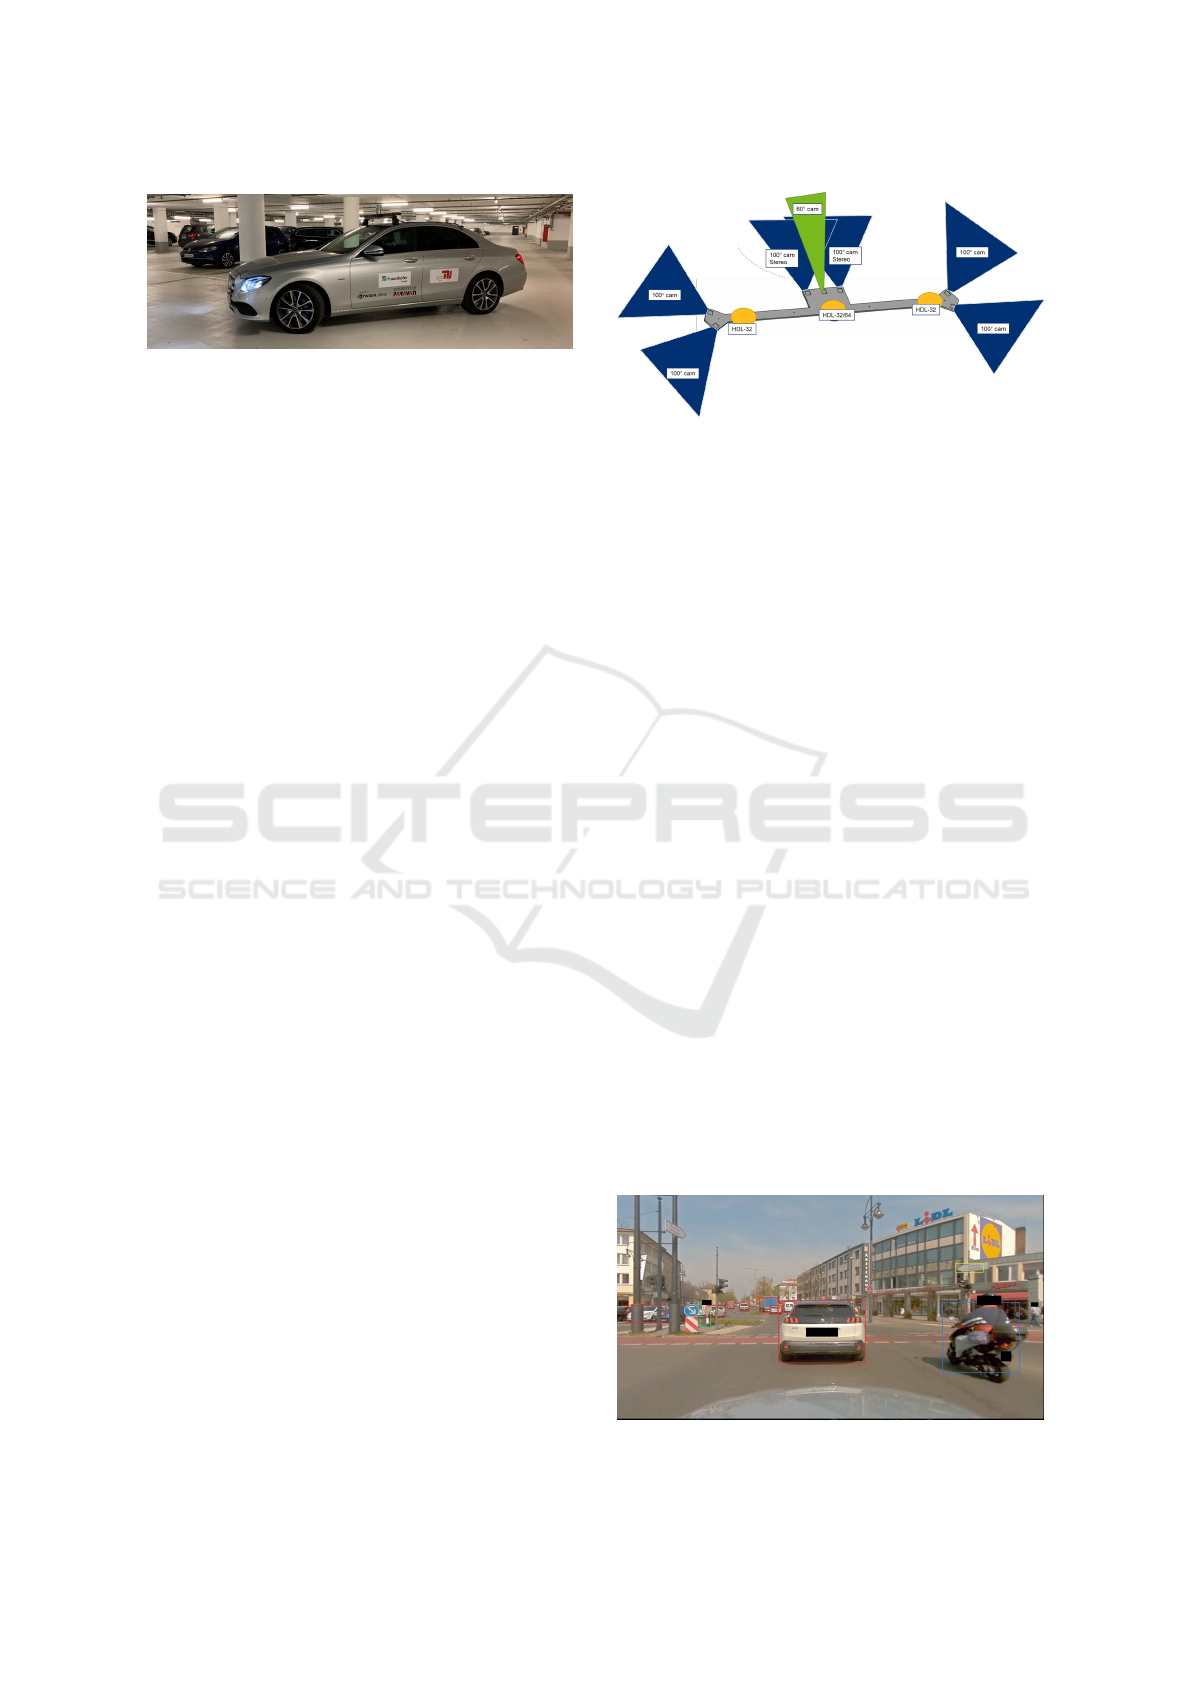
Figure 1: The automated vehicle of Fraunhofer FOKUS.
The perception system of the automated vehicle,
called 3D Vision, allows full understanding of the sur-
roundings. The test vehicle can be seen in Figure 1.
For the 3D Vision, the car is equipped with a sen-
sor rig that can hold various sensors. A schematic
overview of the sensor rig is shown in Figure 2.
The sensor setup consists of three LIDAR scan-
ners, which create a 3D point cloud of the vehicle sur-
roundings. For a full view in camera images, seven
cameras are mounted on the sensor rig, one camera
with a 60 degrees aperture to the front, four cameras
with 100 degrees aperture on the corners, and addi-
tionally two front cameras with 100 degrees aperture,
which provide stereo images.
The sensor evaluation is performed with neural
networks at the PU. In an early fusion, LIDAR points
are projected onto the 2D camera images, which
are processed with Convolutional Neural Networks
(CNN). Due to the projection, the 3D coordinates of
the object detections from the camera images can be
determined. Figure 3 shows the results from the im-
age processing. The network detects various traffic
objects, such as cars, scooters, and traffic signs. For
lane detection, a novel early fusion approach is imple-
mented (Wulff et al., 2018).
For LIDAR perception, the points are grouped in
bins and various features are calculated for each bin
with neural networks, such as Pointpillars (Lang et al.,
2019) and SECOND (Yan et al., 2018). These net-
works can process data more efficiently compared to
raw point clouds. This efficiency stems from the uti-
lization of an internal representations in the form of
bins, enabling faster processing while still yielding
valuable outcomes.
The perception results are shown in Figure 4. The
top left, bottom left, and bottom center show the 2D
bounding boxes in camera images. The top center
shows an internal representation of the LIDAR pro-
cessing, in which each LIDAR point is assigned to a
specific bin. The 3D bounding boxes are shown in the
top right. The hardware setup can be seen in Figure 5
with the PU rack in the center and devices for sensor
connection and vehicular communication.
The objects derived from camera and LIDAR are
collected in an environment model. It takes care of
Figure 2: Overview of the sensor rig.
tracking objects, i.e., assigning a unique identifier
over consecutive time frames. Thereby, the environ-
ment model fuses the object detections from the dif-
ferent sensors to a single internal object representa-
tion. The output of the environment model is passed
to the planning and acting stages.
The path planning builds upon the environment
model and an existing route, which defines the vehi-
cle’s path at the road segment level, determining the
segments to traverse and the turns to take at intersec-
tions. The route is map-based, but during path plan-
ning, it is enriched with real-time information from
the perception and refined at lane level. The resulting
path includes lane changes and avoids obstacles.
To further refine the path, a drivable trajectory is
generated. This trajectory defines the desired posi-
tion and time of the vehicle using a 2D spline, which
is transmitted to the control system. The spline is
continuous and adheres to vehicle constraints. It con-
siders detected dynamic objects, such as vehicles and
pedestrians, to ensure collision avoidance. Addition-
ally, the trajectory is optimized to achieve efficient
and comfortable driving.
For control, the vehicle is equipped with the Scha-
effler Paravan Drive-by-Wire system (Unseld, 2020),
which allows to actuate the steering wheel, and the
throttle and brake controls. The control loop to fol-
low the calculated spline is based on the pure pursuit
algorithm (Samuel et al., 2016). The required steering
wheel angles and forces are applied by the Drive-by-
Wire system.
Figure 3: Results from camera perception.
VEHITS 2024 - 10th International Conference on Vehicle Technology and Intelligent Transport Systems
54
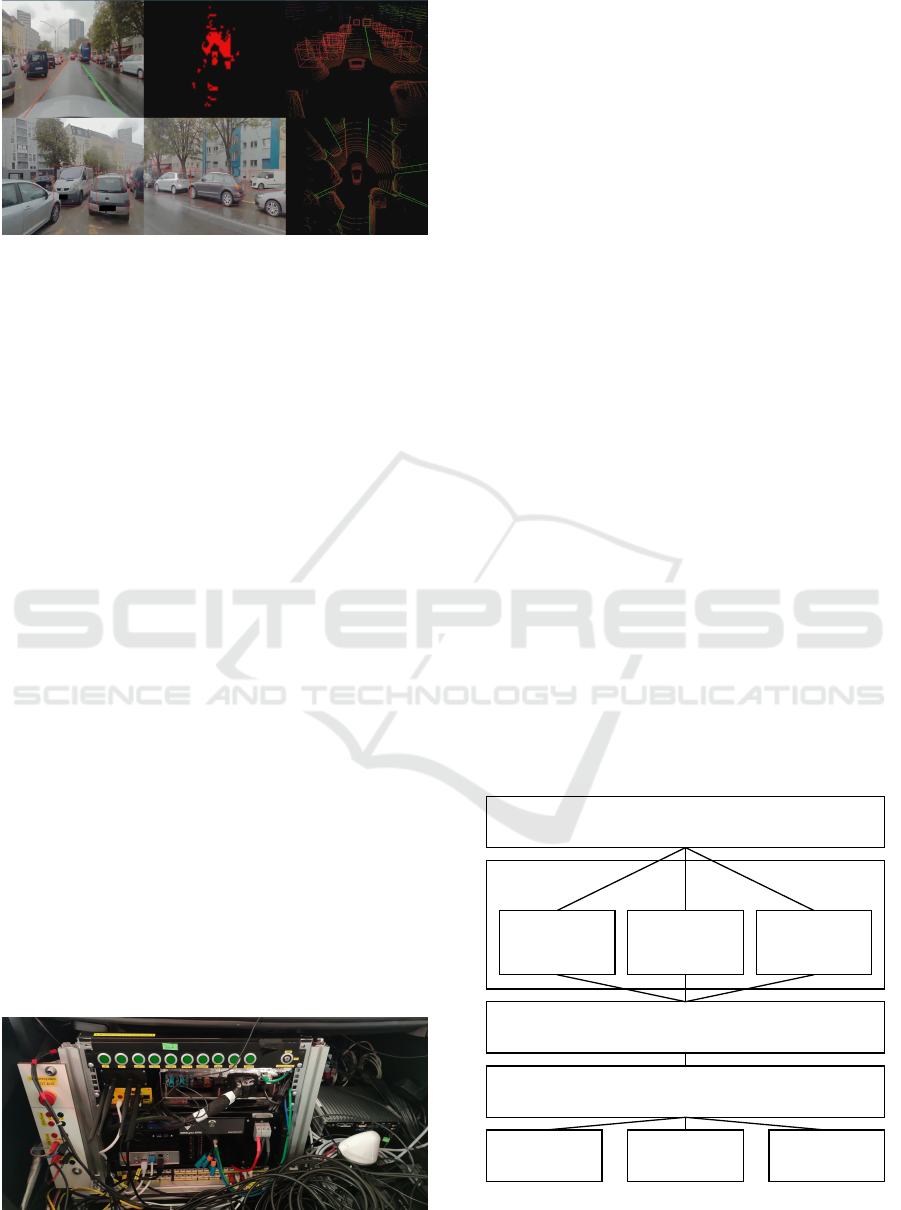
Figure 4: Results from LIDAR perception.
4 EVALUATION SYSTEM
To be able to correctly assess the performance of
ROS2, the entire software stack must be taken into
account, and influencing factors must be considered
as isolated as possible. The aim of the measurements
is to evaluate the performance of ROS2 regarding the
requirements in an automated driving system. Two as-
pects are particularly essential for this. Is ROS2 fast
enough to function as the backbone of interprocess
communication in a real-time system? This condition
can be measured very well with the latency, which
for this work is defined as the elapsed time between
sending the message and receiving the message in the
user application. Another aspect to consider is the er-
ror rate in the system. Reliable delivery of messages
is essential for an automated system, as the loss of in-
formation can lead to potentially dangerous wrong de-
cisions. To estimate this metric, the occurring packet
loss is measured as a percentage. Only local measure-
ments are carried out for the measurement scenario,
which corresponds to the current setup of the test ve-
hicles used. The participants, nodes, and topics are
also predefined; fluctuating behavior is not evaluated.
The full functional scope of ROS2 is realized via
four different abstraction levels. Applications are
written with the help of client libraries. These map the
API in a specific programming language, officially
supported here are C++ (rclcpp) and Python (rclpy).
Most of the functionality is implemented in C and
Figure 5: Hardware setup of the vehicle.
available as ROS client library. Communication with
the specific DDS implementation, which manages the
sending of messages and the discovery of other par-
ticipants, is handled by the ROS middleware interface
(rmw). Figure 6 summarizes the internal structure of
ROS2. Each of the layers influences the overall per-
formance.
The first elementary influencing factor that comes
into play is the DDS. Each DDS is used in its stan-
dard configuration to ensure basic comparability. The
ROS2 stack with the rmw and rcl layer then follows,
based on the DDS. The same version is used for each
measurement to rule out possible deviations due to
changes to these layers. rclcpp is used to implement
the user applications for the measurement. In addi-
tion to the hardware and software stack, the way in
which the system is used is also important. Parame-
ters that have a major influence on the possible perfor-
mance here are the data size per message, the number
of messages sent per time unit, the number of nodes
in the entire network, the number of topics used, and
the number of publishers and subscribers per topic.
These parameters in particular are of great inter-
est for the measurements, as they demand the central
aspects of the DDS and ROS2 implementation with
regard to their efficiency. Only the publish / sub-
scribe pattern is considered for the measurements, as
both services and actions are based on this method-
ology. Furthermore, the following assumptions are
made for the measurements: A node is either a pub-
lisher or a subscriber, never both at the same time;
each measurement is performed with one DDS; this
is not exchanged during a measurement; and all nodes
involved in the measurement are started beforehand;
ROS2 application
ROS client
libraries
rclcpp (C++) rclpy (Python) rcljava (Java)
rcl (C API)
• High level functionalities
rmw (C API)
• Low level communication
Cyclone DDS Fast DDS Connext DDS
Figure 6: ROS2 internal architecture (Open Robotics,
2022a).
Performance Evaluation of a ROS2 Based Automated Driving System
55

there are no late-joining components.
In a first iteration, the different DDS implementa-
tions are compared with each other. For this purpose,
the performance test framework from Apex.AI (Pem-
maiah et al., 2022) is used. Each DDS is tested in dif-
ferent scenarios with varying data sizes and numbers
of participants. Based on the results, a selected DDS
is then evaluated in detail to gain a deeper understand-
ing of the performance of ROS2. For this purpose, a
much larger number of factors are permuted and ana-
lyzed using tracing (B
´
edard et al., 2022) to track the
path of the message through the software stack in or-
der to precisely localize possible performance losses.
ROS2 works on the basis of workspaces (Open
Robotics, 2022b). A workspace comprises a collec-
tion of ROS2 packages, i.e., ROS2-based software
projects, which are built with the help of the ROS2-
specific build tool Colcon (Open Robotics, 2022c).
These workspaces can in turn build on each other so
that the hierarchically higher workspace has access to
all packages of the underlying workspace. This en-
ables a structured and clean setup of all necessary
packages without having to install packages that are
not required for the specific measurement.
As first step of the implementation, the lowest
common denominator of required packages is in-
stalled in a workspace. Here, this is the ROS2 library
itself with the basic functionalities in the Rolling ver-
sion. This workspace is built using the build tools,
and all external dependencies are installed.
For the initial comparison testing a new
workspace is created, and the Apex.AI Perfor-
mance Test Project (Pemmaiah et al., 2022) is built.
With the help of a Python script, a bash script is
created from the benchmark configuration for the
parameters. As part of the benchmark, the workspace
is rebuilt once for each DDS so that the performance
test uses it accordingly. All subscribers are started for
each configuration and each DDS; the executable pro-
vided by Apex.AI is called up configured accordingly
for this purpose. After a short wait to ensure that
all subscribers have been initialized, the publishers
are also started; the Apex.AI executable is also used
here. After the configured time, the processes end
automatically, and all open log files are closed. The
process is repeated for each of the configurations.
Only the layers below the rmw layer are used here.
This allows to consider only the influence of the
specific DDS implementation and to exclude any
influences from higher layers.
Table 1 lists the permutations of the parameters;
each of the DDS implementations is tested once for
each of the specified configurations over a runtime of
60 seconds. The aim of the configurations is to ob-
Table 1: Parameters of the comparative benchmark.
Parameters Values
Nodes
2 32
Publisher
Nodes
1 1
Subscriber
Nodes
1 31
Size Struct16, Array64k, PointCloud1m
Frequency 10Hz
tain a comprehensive overview of the performance in
order to be able to compare the various DDSs as ac-
curately possible. The first three configurations serve
as a basis for this. The simple 1 - 1 communication
reduces the possible interference to a minimum. The
1 - 31 communication is already more demanding, as
the DDS must now distribute the message to 31 sub-
scribers, which leads to a considerably larger required
bandwidth, especially with larger data packets. 32
nodes in a network comes much closer to an appli-
cation in the field of automated driving in terms of
the number of participants and can therefore provide
initial indications of performance under load. The fre-
quency set for all tests is 10Hz, which corresponds to
the frequency most commonly used by sensors and
computing components in automated driving systems
and therefore serves as a sensible clock rate for gen-
erating the load. The different data sizes represent
different scenarios. Struct16 is the smallest message
and can, for example, be equated with a message from
a simple sensor in the vehicle, such as acceleration.
Array64k represents more complex data, such as a
trajectory or recognized objects. Pointcloud1m is the
largest message and is used to represent LIDAR scans
or camera streams. This message size usually forms
the upper limit of the messages used in the automated
vehicle in terms of size per message. Overall, the pa-
rameters thus cover a good range from the actual ap-
plication and provide initial indications of the perfor-
mance of the various DDS implementations.
Several ROS2 packages are required for more de-
tailed measurements of a selected DDS. ROS2 tracing
is elementary here (B
´
edard et al., 2022), as well as a
special version of the DDS, to provide the necessary
insight at this level. With the help of the ROS2 trac-
ing package (B
´
edard et al., 2022) the message can be
traced through the entire stack (B
´
edard et al., 2023) to
understand how the latency arises, and where message
losses occur. It is demonstrated that the additional
overhead caused by tracing is minimal and therefore
does not distort the results (B
´
edard et al., 2022).
For measurements, a package is required to gener-
ate the load in the system according to the configura-
tion. For this purpose, a simple but fully configurable
VEHITS 2024 - 10th International Conference on Vehicle Technology and Intelligent Transport Systems
56
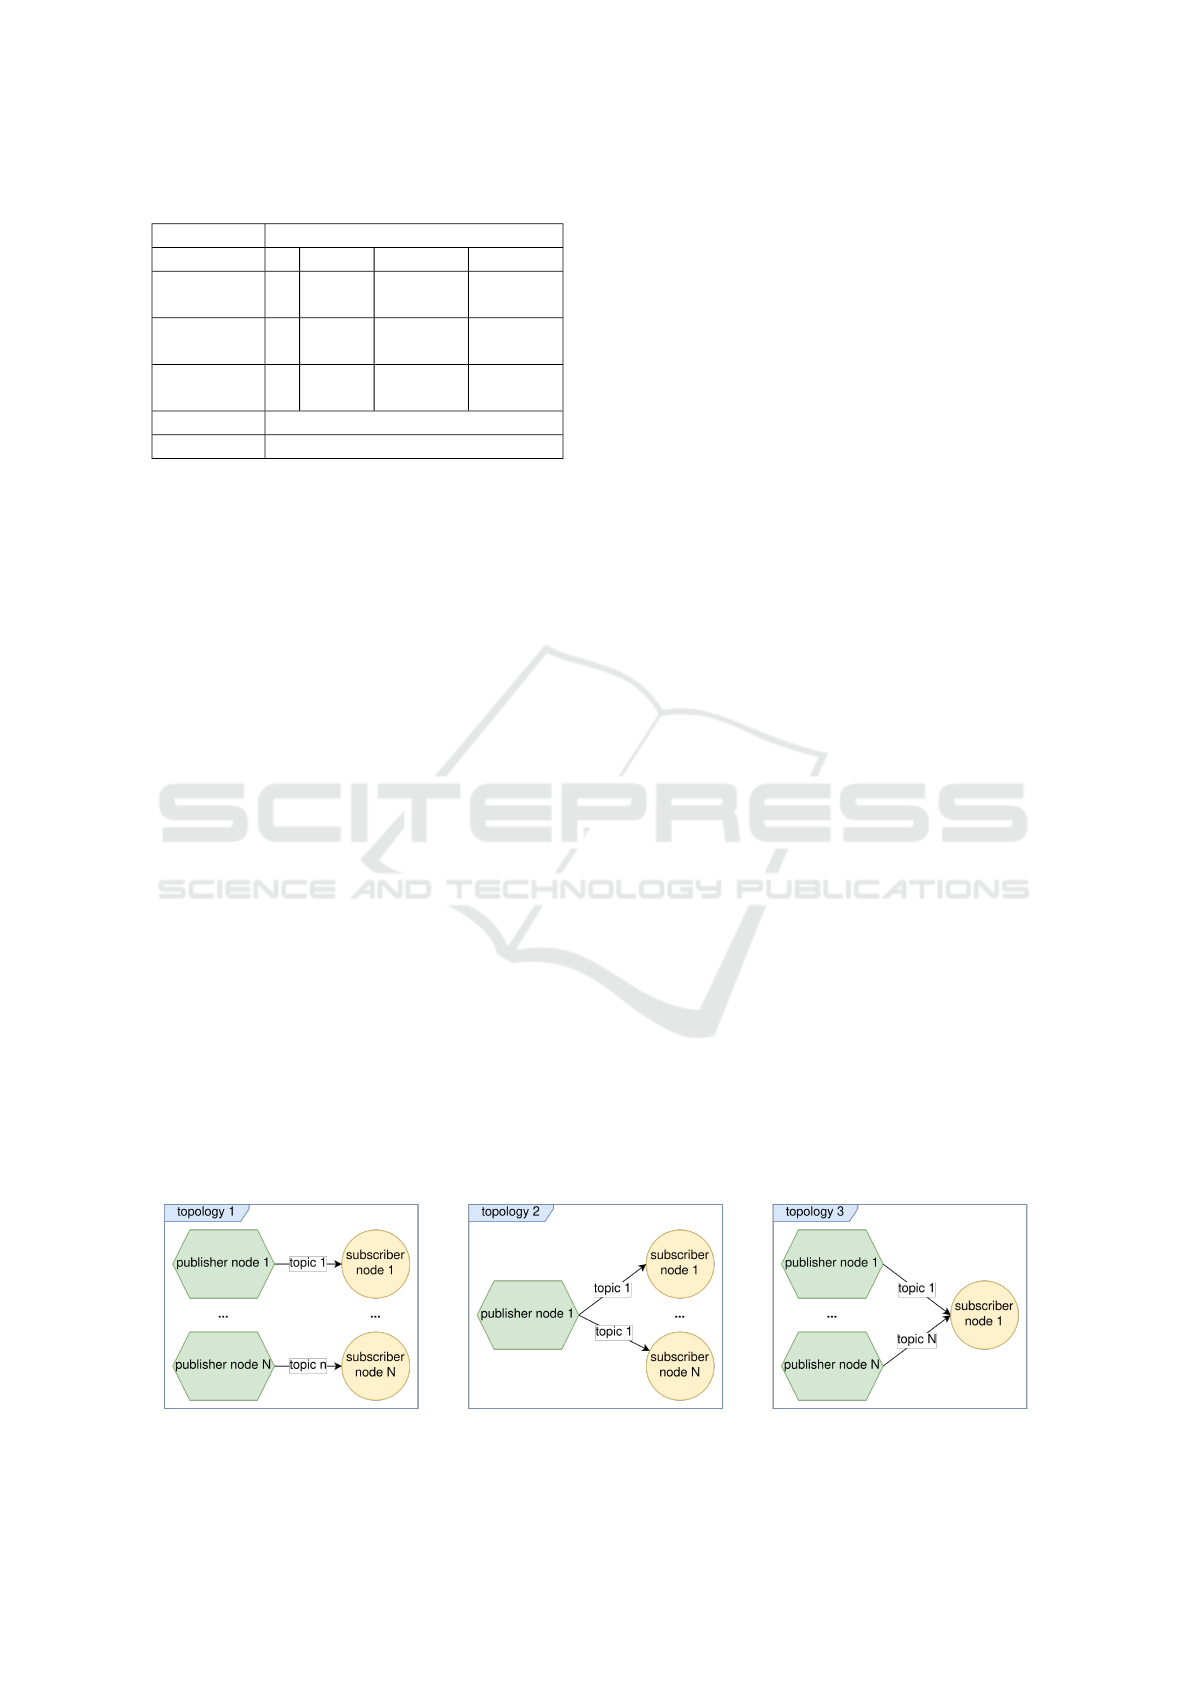
Table 2: Parameters of the detailed benchmark.
Parameters Values
Nodes 2 8 32 64
Publisher
Nodes
1 1, 4, 7 1, 16, 31 1, 32, 63
Subscriber
Nodes
1 1, 4, 7 1, 16, 31 1, 32, 63
Subscriber
per node
1 1, 7 1, 31 1, 63
Size 0B, 64kB, 512kB, 1Mb, 2Mb
Frequency 10Hz, 100Hz
node is implemented as a publisher and subscriber.
When the process is started, the publisher receives the
frequency in milliseconds at which the message is to
be sent, the size of the message in bytes, the length of
the measurement in seconds and the topic on which
it is to send. Based on this information, it then starts
a ROS2 timer to periodically publish a packet on the
topic according to the frequency. The message sent
consists of a header, containing a timestamp and an
ID in the form of an integer number, and a byte array
of the defined size, which is filled with random values.
The timestamp is entered in the message immediately
before the actual transmission.
The structure of the subscriber nodes is similar.
They receive a list of topics for which correspond-
ing subscriptions are created. A timestamp is also
taken directly in the associated callback, which is then
compared with the timestamp from the received mes-
sage, and the difference is saved. The actual measure-
ment of the latency then follows using the recorded
traces. The measurement is started with a Python
script, which parses the various configurations and in-
stantiates a corresponding number of publishers and
subscribers, starts the tracing, and activates the cor-
responding DDS using an environment variable. The
aim of these benchmarks is to gain a more detailed,
in-depth insight into the performance of ROS2. For
this purpose, the parameter space is significantly en-
larged to obtain a higher resolution of the test results.
The aim is also to go beyond the current requirements
to be able to assess the performance limits of ROS2.
Table 2 shows the possible configurations of the
parameters for the detailed benchmark. Based on
the number of nodes, three topologies are created for
the publisher-subscriber-subscriber-per-node ratio, as
shown in Figure 7. The first topology has exactly as
many publishers as subscribers, each with their own
topic and one subscriber per node. The second topol-
ogy changes the ratio, with only one publisher serv-
ing all the remaining nodes as a subscriber; here, too,
there is only one subscriber per node. Finally, this
relationship is reversed, and a node with many sub-
scribers is served by the remaining nodes as a pub-
lisher. Topology 1 makes it possible to evaluate the in-
fluence of the number of topics on the overall perfor-
mance and thus to test the scalability of topics. Topol-
ogy 2 makes it possible to check how efficiently the
distribution of messages on a topic works and how
great the influence of the number of subscribers per
topic is on the overall performance. Topology 3 al-
lows to check how well the executor of a single node
scales under load with more callbacks and how many
subscribers per node can be effectively implemented
before the SingleThreadedExecutor is overloaded. In
practical applications, a mixture of all three topolo-
gies can be found. Each of the topologies is measured
for each combination of frequency and data size over
a runtime of 60 seconds.
For the detailed benchmarks, additional data sizes
were added to the three data packets from the previ-
ous benchmarks. First, 512kB was added as the mid-
dle value of the previous value range to achieve better
coverage in this area. Secondly, in order to test the
limits, twice the previous maximum was added again
with the aim of demanding the maximum bandwidth.
Measurements at 100Hz were also added to the pre-
viously used frequency of 10Hz in order to gain an
insight into the extent to which there is still potential
for improvement here.
All benchmarks are run on the PU with an In-
tel® Xeon® E5-2667 v4 CPU and 8x 32GB RDIMM
DDR4-2400+ reg ECC. An Intel X550-T2 network
card handles communication with the connected sen-
sors. The system is running Ubuntu 20.04 LTS.
Figure 7: Overview of the different benchmark topologies.
Performance Evaluation of a ROS2 Based Automated Driving System
57
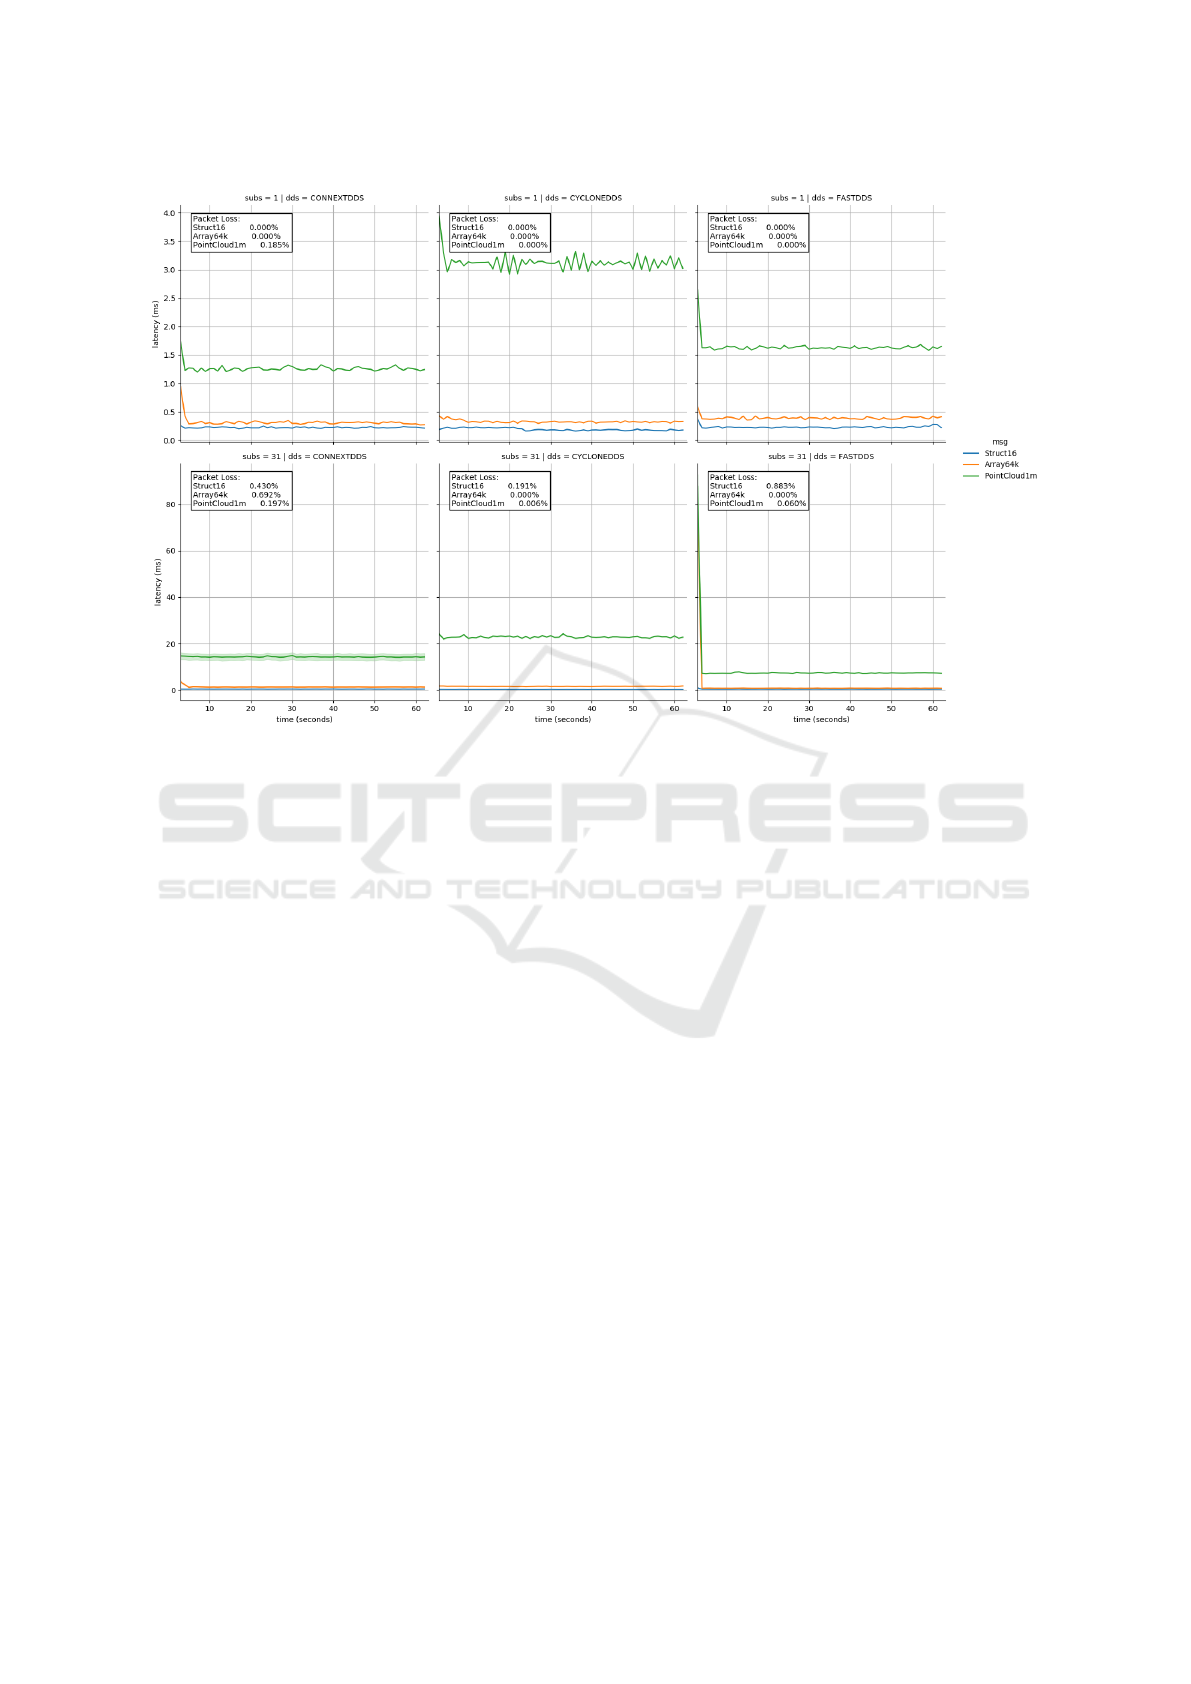
Figure 8: Comparison of latencies of DDS implementations over time.
5 EVALUATION RESULTS
A direct comparison of the three officially supported
DDS implementations reveals differences but also
similarities in performance behavior. Figure 8 shows
the course of the latency in milliseconds over the mea-
surement period of 60 seconds, with Struct16 in blue,
Array64k in orange, and PointCloud1m in green as in-
troduced in section 4. Each column represents one of
the three DDS implementations. The top row shows
the results for a publisher communicating with a sub-
scriber. The bottom row shows the results for a pub-
lisher communicating with 31 subscribers. The first
scenario here serves as a basic assessment, while the
second scenario is more of an application scenario
from the field of automated driving regarding the sub-
scribers. The individual measurement lines represent
the different packet sizes.
The measurement results are generally very good.
For most scenarios, the latency remains below 2 ms,
leaving a clear margin up to a frequency of 10 Hz.
Only the latency for PointCloud1m is higher, which
is particularly clear for the higher number of sub-
scribers. In this case, the latency increases to at least
8ms (FastDDS) and on average to 15-20 ms. It is
worth noting that the variance for each combination
is below 1 ms, apart from ConnextDDS for 31 sub-
scribers / PointCloud1m, where the variance is around
18 ms. This low variance indicates stable message
transmission behavior, as does the almost constant la-
tency over the course of the measurement.
The packet loss is also fairly limited. In the maxi-
mum case it is 0.88%, in most cases it is 0%. It is no-
ticeable, however, that ConnextDDS is the only one
with a packet loss of 0.18% in the 1-1 communica-
tion for the PointCloud1m messages, while all other
1-1 communication scenarios each have 0%. Con-
nextDDS also performs worse in the 1-31 scenario,
losing a small number of packets for each message
size. CycloneDDS and FastDDS predominantly lose
packets for Struct16 in this case, which is presumably
due to the fact that this packet is not fragmented. This
means that the loss of a single UDP packet is not no-
ticeable, whereas with fragmented messages there is
a higher chance that at least one fragment will arrive
and thus trigger a resend (Granados, 2017).
Overall, both latency and packet loss are satisfac-
tory, even for more subscribers and larger data pack-
ets. This is illustrated again in Figure 9. The boxplot
shows the latency per packet size for each of the three
DDS. The box includes the upper and lower quartiles,
the line within the box shows the median latency. The
whiskers show the 1.5-fold quartile distance. Nei-
ther the quartile distances nor the whiskers are sig-
VEHITS 2024 - 10th International Conference on Vehicle Technology and Intelligent Transport Systems
58
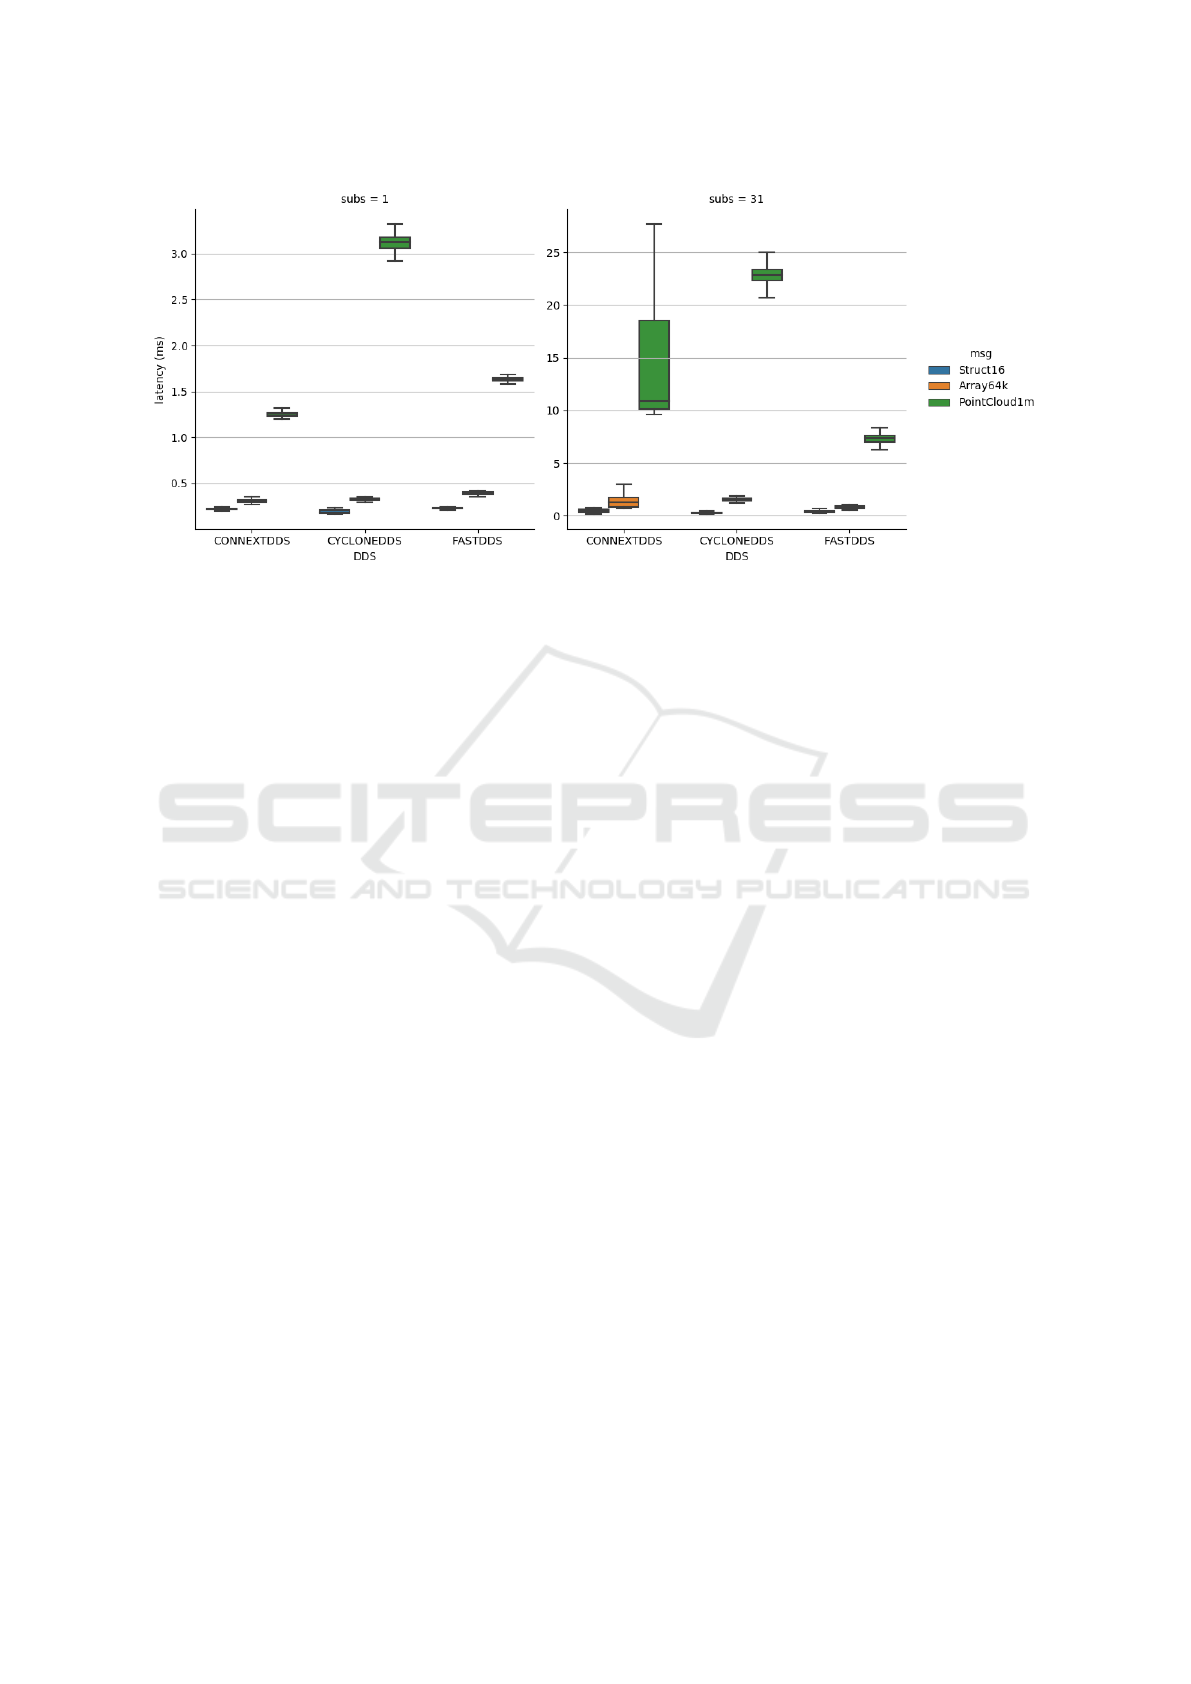
Figure 9: Comparison of the variance of the latency of the different DDS.
nificantly wide in most cases.
After an initial comparative measurement, Cy-
cloneDDS is evaluated again using tracing and an
enlarged parameter space as an example, as Cy-
cloneDDS appears to be the most reliable, particu-
larly in terms of low packet loss and low latency vari-
ance. Figure 10 again shows the performance of Cy-
cloneDDS for 1-N communication. The left-hand plot
shows the measurement data for a frequency of 10Hz,
while the right-hand plot shows the same measure-
ments with a frequency of 100Hz. The x-axis shows
the subscriber distribution (1, 7, 31, and 63), which
is further divided according to packet size. For the
frequency of 10 Hz, the latencies are still below the
frequency limit on average, even if the whiskers ex-
ceed it, especially for the 2Mb packet. For the higher
frequency of 100 Hz, the frequency limit of 10 ms is
already exceeded for the 1 - 1 communication for the
largest packet, and, as the number of subscribers in-
creases, the 512kB and 1Mb packets also exceed this
limit. It is also noticeable in this case that the quar-
tile distance for these measurements is in most cases
significantly larger than in the comparative measure-
ments before. The increased frequency and the larger
number of subscribers therefore show a strong influ-
ence on this.
It is also worth noting that the latency for 100 Hz,
especially for 63 subscribers, shows a lower latency
and lower variance. One reason for this behavior is
due to the following correlation. Figure 11 shows the
categorized latency of all received messages per num-
ber of subscribers and data size. The lower plot shows
the view of the subscribers. As can be seen in the
previous figure, almost every message arrives below
the frequency limit of 100ms. These are categorized
as ”in time” in the plot. Only for the more complex
configurations messages are occasionally lost or ar-
rive too late.
However, the view of the publishers in the upper
plot is conspicuous. Even for the simplest configura-
tion, the publisher does not manage to send all mes-
sages in the given frequency time. This explains why
the packet loss on the subscriber side remains so low
despite the high load and large packet size. The ma-
jority of messages are not sent within the measure-
ment window and therefore cannot be received on the
subscriber side. As this behavior increases for higher
frequencies, it is obvious that this is the reason for the
better latencies in comparison. According to the fre-
quency used and the measurement period, 600 mes-
sages should be sent in each configuration, but this
is only possible for the two smallest packets in most
cases. From 512kB upwards, the messages are in-
creasingly delayed so that the total number of 600 is
no longer reached in the measurement period.
Tracing can be used to determine where these de-
lays occur. Figure 12 shows this broken down by the
various layers of the ROS2 architecture on side of the
publisher, again categorized by subscriber and data
size. It is clear here that by far the most time is re-
quired at the DDS level, since the message is serial-
ized and prepared for transmission at this level. It is
already established that the serialization process takes
a significant amount of time (Wang et al., 2018), espe-
cially as the message format of ROS2 and DDS is not
uniform and therefore each requires its own process-
ing. The figure also shows that the effect increases
primarily with the data size, which also points to the
serialization step.
The comparison between topologies 2 and 3 is
also relevant: on the one hand, a publisher serves a
larger number of subscribers, and, conversely, a large
Performance Evaluation of a ROS2 Based Automated Driving System
59
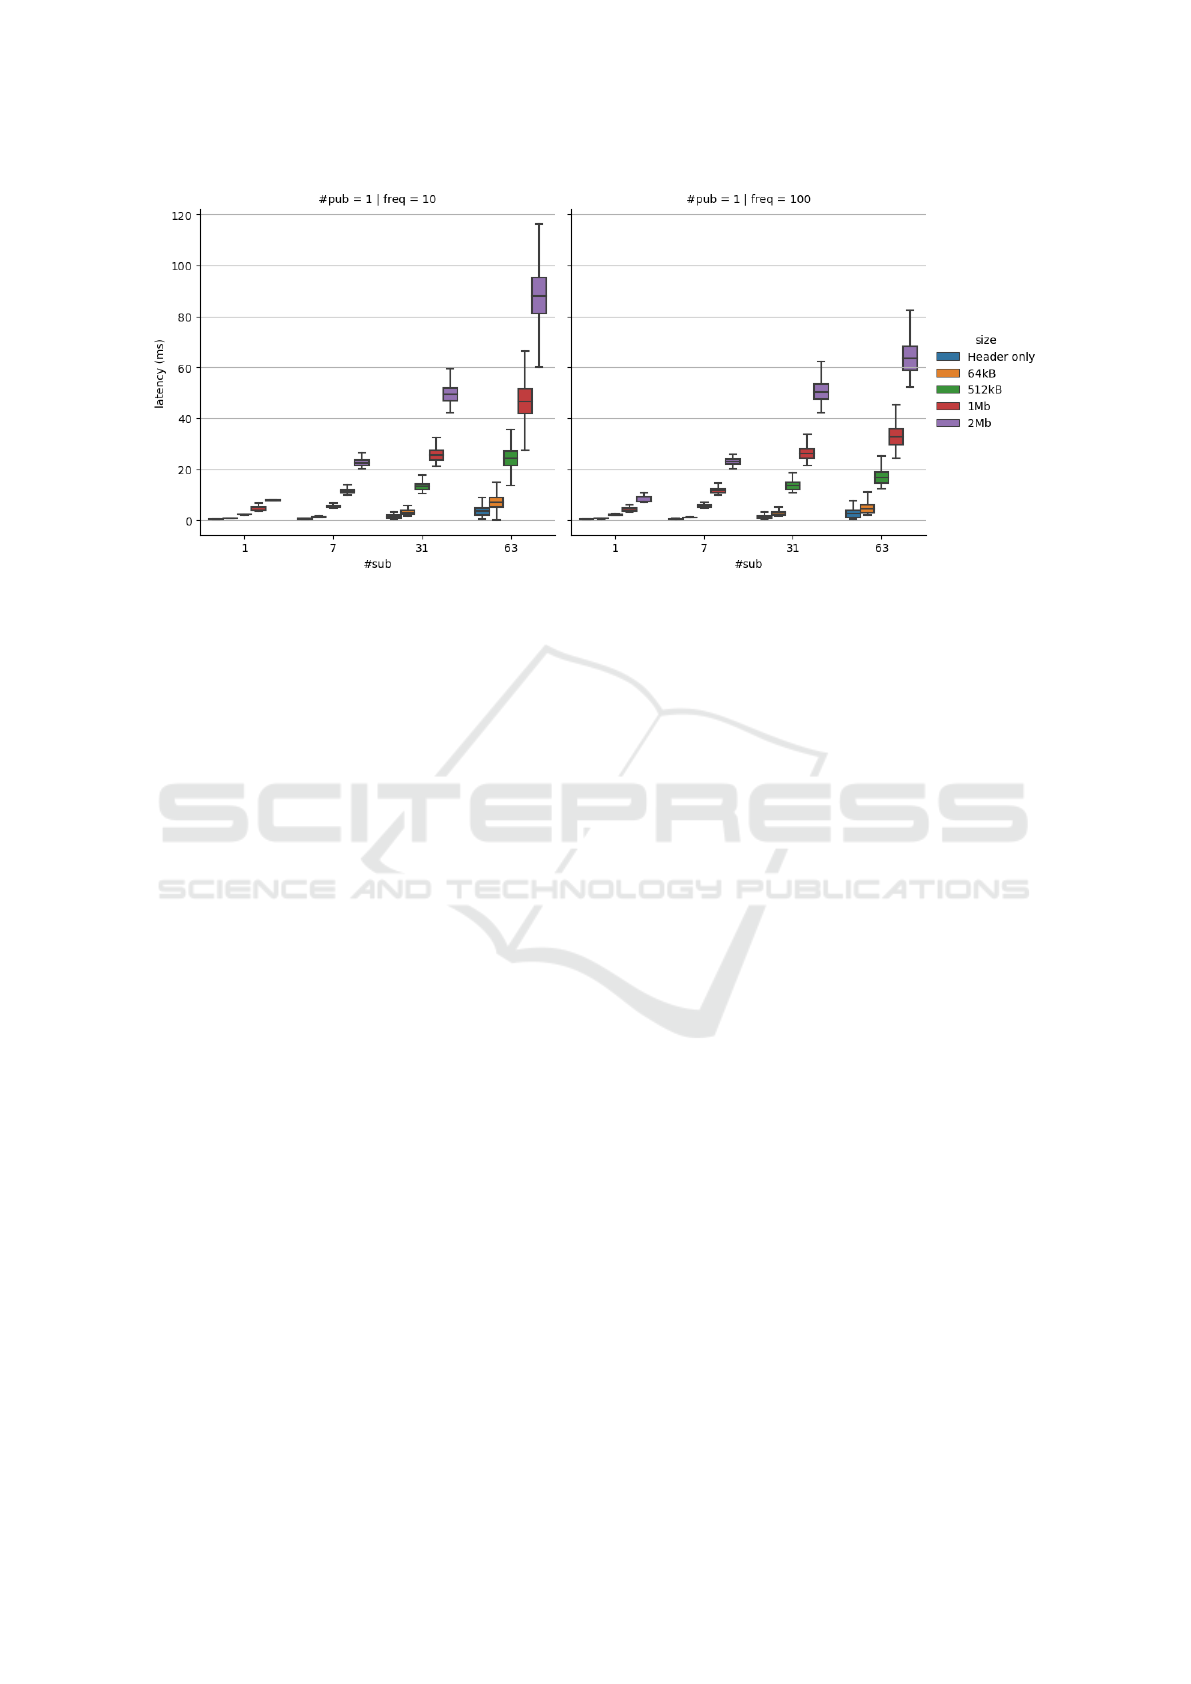
Figure 10: Latency per message size and number of subscribers.
number of publishers serve a single node with many
subscribers. This evaluates the efficiency of the ex-
ecutor in particular, in this case the SingleThread-
edExecutor. Figure 13 shows this comparison: The
left-hand side shows the latencies for 1-N communi-
cation, while the right-hand side shows the N-1 sce-
nario. Both scenarios are almost identical, especially
for 7 and 31 subscribers. For 63 subscribers, how-
ever, the difference is noticeably greater. Though, the
influence of the ratio of publishers and subscribers on
latency does not have a significant impact in general.
The significantly greater variance for the N-1 scenario
is due to the executor, as it processes all callbacks
sequentially and therefore cannot process the open
events quickly enough, especially under high load.
Finally, it is checked whether the subscriber fair-
ness described in (Maruyama et al., 2016), which is
one essential change compared to ROS1, can also
withstand more complex scenarios. Figure 14 shows
this case as an example for a 1-N scenario, a packet
size of 64kB, and a frequency of 10 Hz. Even if the
latency for each subscriber differs slightly, they are on
average max. 2 ms apart. There is also no staircase
like increase for the subscribers, all have a latency of
around 7 ms. The variance for this scenario is greater
than for smaller scenarios, but here too none of the
subscribers are significantly further apart than the oth-
ers. This plot is comparable for all other combinations
of parameters evaluated. This leads to the assumption
that other influencing factors, such as frequency and
size, have a stronger negative influence earlier, and
therefore the performance collapses before the sub-
scriber fair behavior can no longer be maintained.
6 SUMMARY
As the development of automated vehicles is an on-
going research task, this paper presents an evalua-
tion of a ROS2 based ADS. The automated Mercedes
E-Class of Fraunhofer FOKUS comprises both hard-
ware and software components. The hardware setup
consists of the sensor installation, the on-board PU
for processing and planning, and the actuation hard-
ware to control the vehicle. With a sensor rig, several
cameras and LIDAR sensors are mounted on the roof
of the vehicle. For vehicle control, a Drive-by-Wire
system by Schaeffler Paravan is installed. The soft-
ware components of the architecture are split in three
segments: sensing, planning, and acting.
The complexity of the distributed nature of the
ADS leads to the research question, if ROS2 fulfills
the performance requirements for automated driving.
Thus, a thorough analysis of ROS2 is performed for
this paper. Two important aspects to consider are
the latency, which measures the elapsed time between
sending and receiving a message, and the packet loss,
which measures the percentage of lost messages. The
data size per message, number of messages sent per
time unit, number of nodes, number of topics, and
number of publishers and subscribers per topic are pa-
rameters of interest for the measurements.
Different DDS implementations are compared us-
ing a performance test framework, and one selected
DDS is further evaluated using tracing to identify
performance losses. The subscribers and publishers
are started accordingly for of the three official DDS
systems, FastDDS, CycloneDDS, and RTI Connext.
Only the layers below the rmw layer are inspected for
VEHITS 2024 - 10th International Conference on Vehicle Technology and Intelligent Transport Systems
60
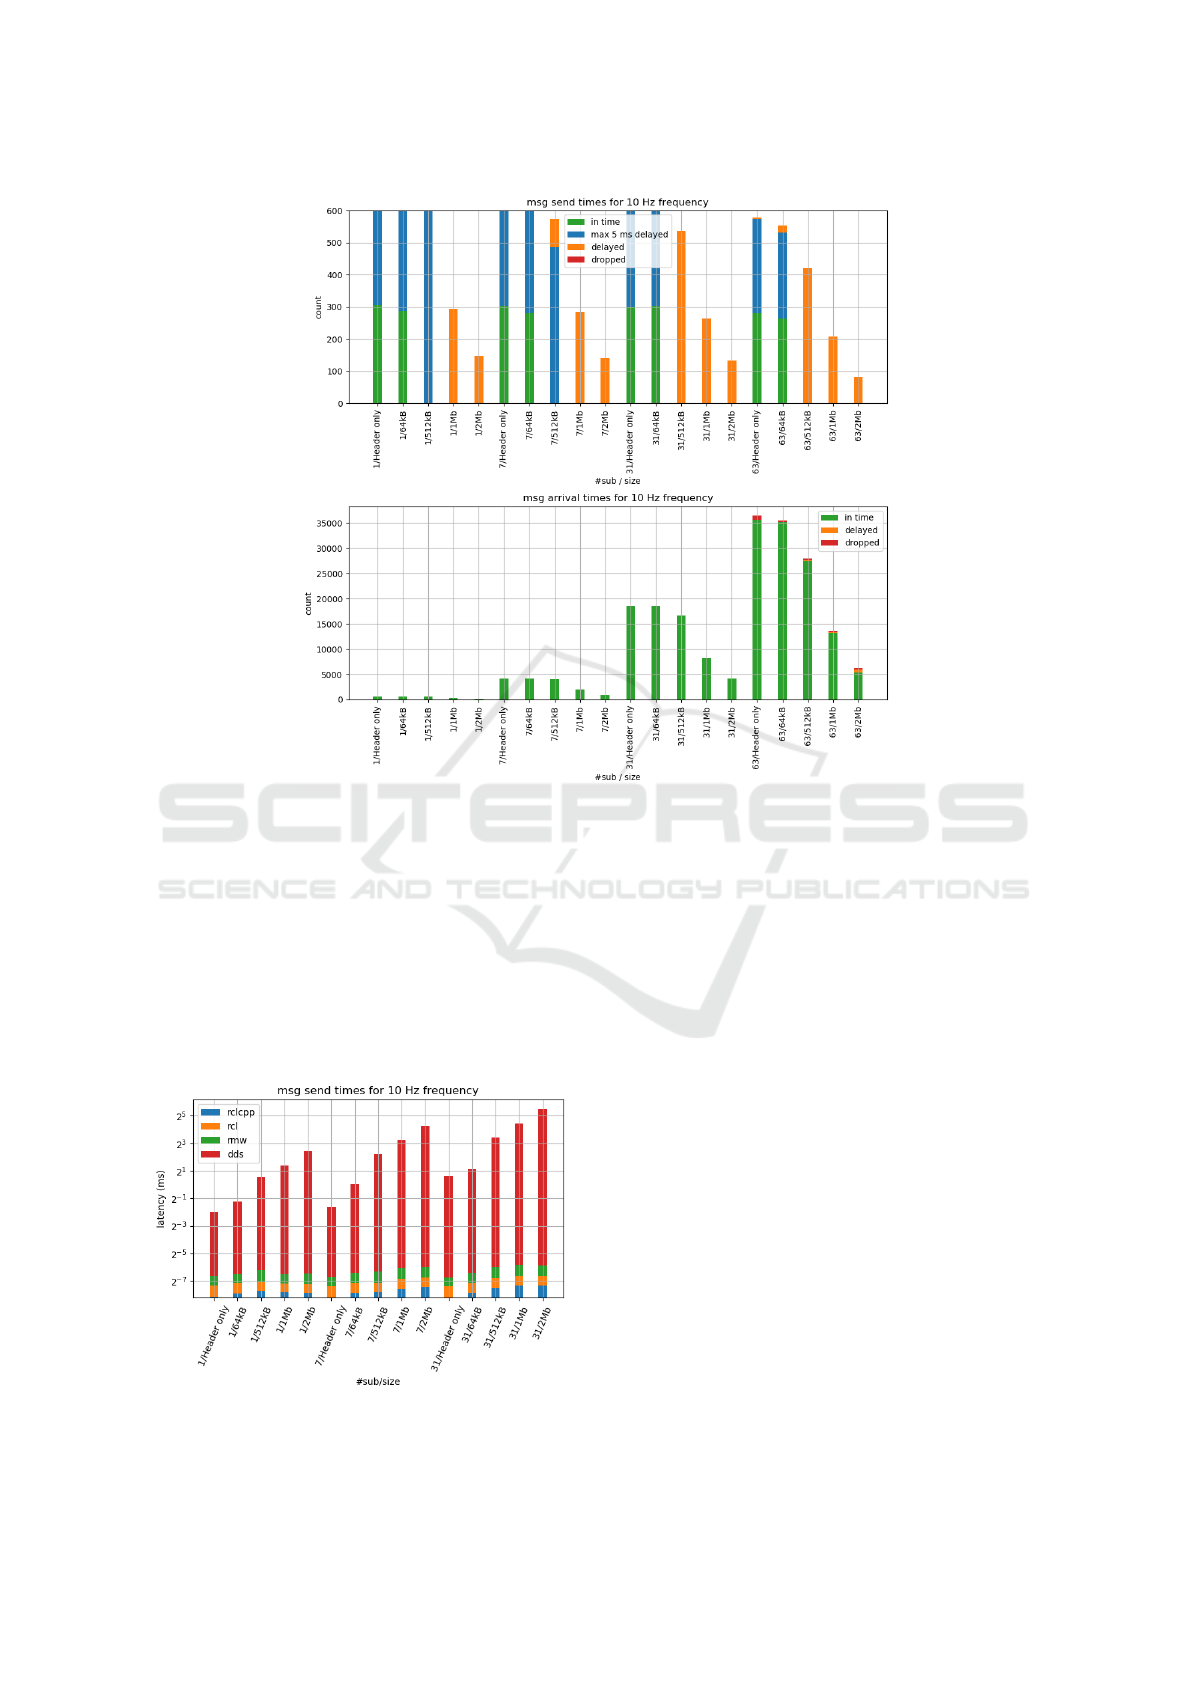
Figure 11: Overview of the messages sent and the associated arrival times.
the comparative benchmark to isolate the influence of
the DDS implementation. In the detailed benchmark
tracing is used to track the message progress through
the complete stack and to understand latency and mes-
sage losses.
Three different publish/subscriber topologies are
assessed. The first one has a 1-1 relation between
publishers and subscribers and topics, respectively.
The next one has a 1-N publisher-subscriber relation,
while the last one reverses this relation. They show
Figure 12: Overview of the messages sent and the associ-
ated arrival times.
comparable results for latency, error rate, and band-
width. Latency depends mainly on packet size and
number of nodes in the system. With high load, frag-
mentation of messages can lead to a lower packet loss.
In general, packet loss is very low in the tested con-
figurations.
A large part of the latency is generated on the
publisher side before the actual sending and does not
count into the transmission time. However, this af-
fects the performance of the system, especially for
high frequencies and large packet sizes. Latency re-
mains very similar, comparing different topologies.
Only in the n:1 scenario, the average latency is not
changing much, while the variance increases signif-
icantly, due to the single threaded execution. In the
1:n scenario it can be observed that subscribers are
served in a fair manner, and all have similar latency
results. As overall both latency and packet loss are
low in all tested setups, ROS2 proves as an efficient
and reliable communication framework for an ADS.
It should of course be noted that ROS2 does not sup-
port hard real time rigor. However, for the majority of
communication, where low latency but no strict real-
time capability is mandatory, it is a flexible commu-
nication framework that can be used to connect the
components within an ADS. However, hard real time
Performance Evaluation of a ROS2 Based Automated Driving System
61
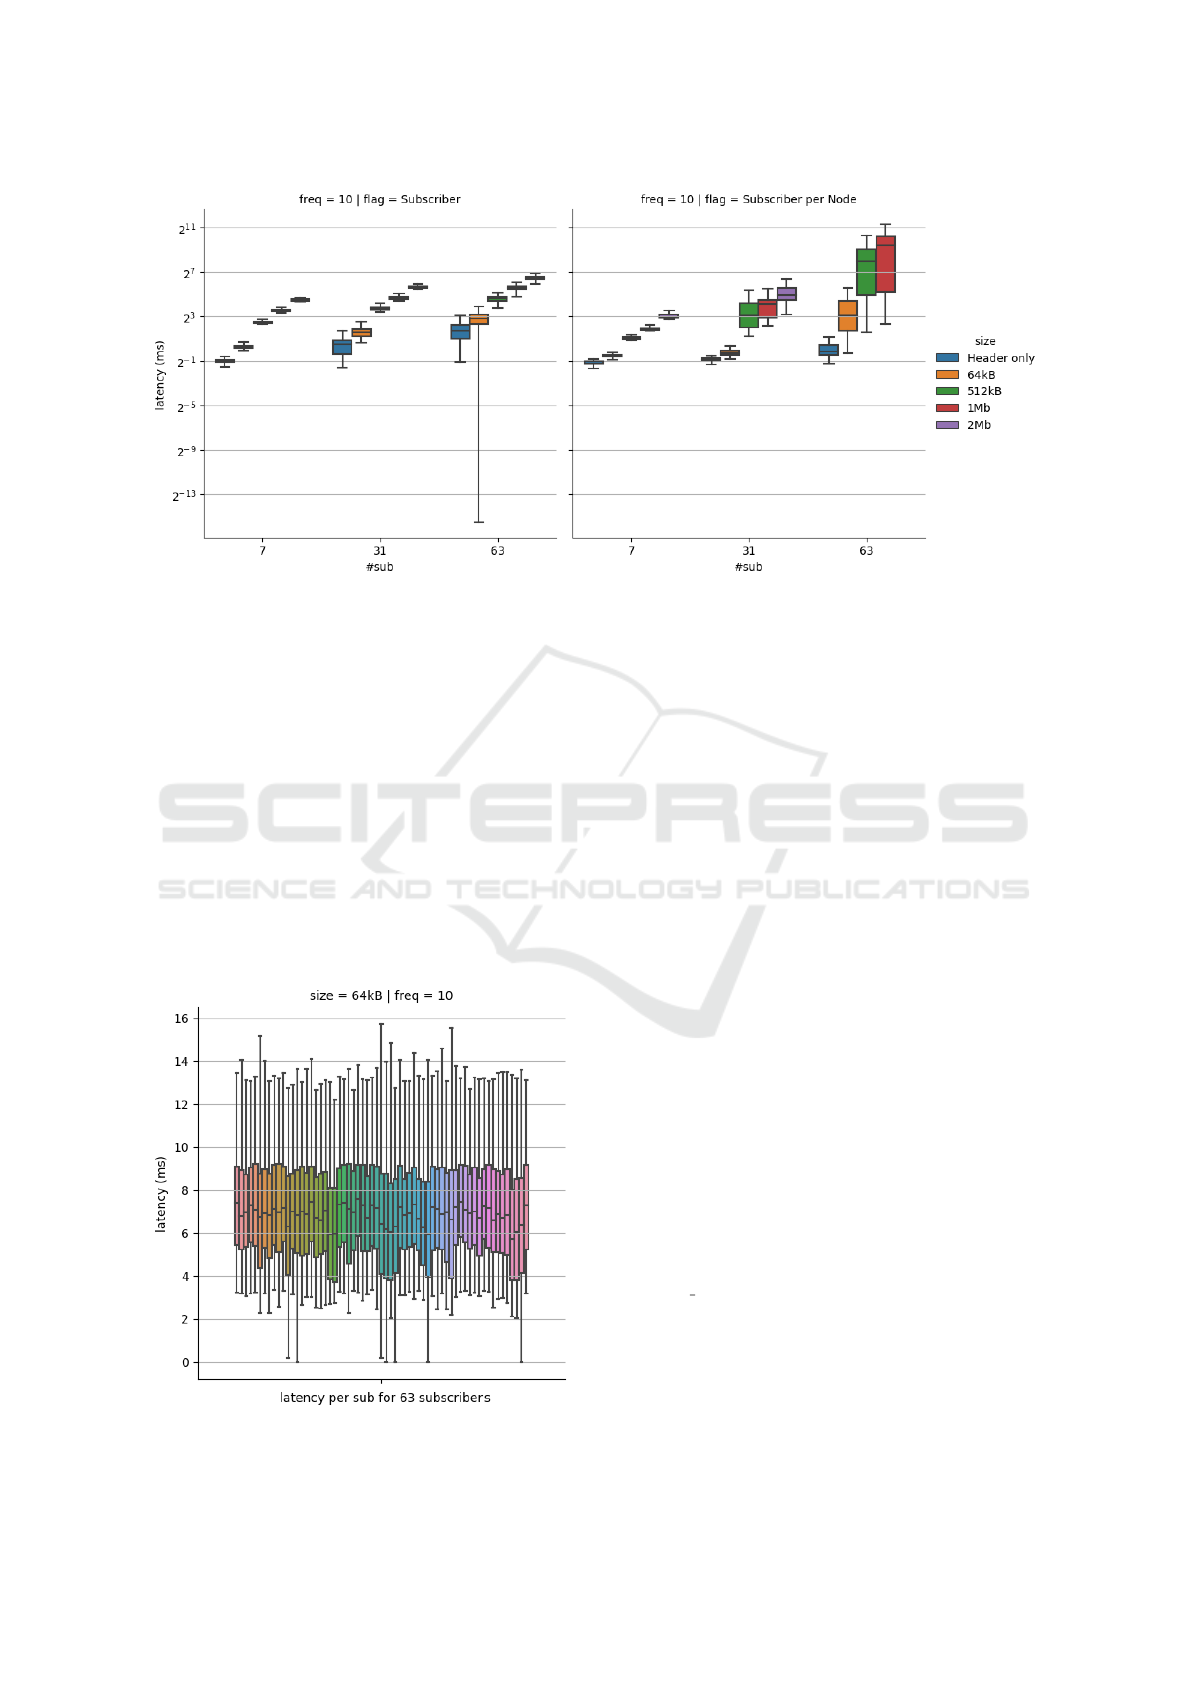
Figure 13: Comparison of latency for subscribers per node.
rigor should be implemented at least for the actuators.
Many other interesting measurements could be
considered due to the various customization options
available for ROS2 and the underlying DDS. This in-
cludes the influence of Quality of Service (QoS) pro-
files and their reliability with the coverage of various
bandwidths, which is relevant for automated driving
systems. Additionally, there are different execution
models from single thread to multi threaded. This
may require higher hardware requirements but can
lead to significant performance improvements.
Another leverage point for performance is the spe-
cific configuration of the DDS used. All three imple-
mentations offer extensive options to adapt behavior
for the scenario. For example, using Shared Memory
Figure 14: Comparison of latency for subscribers per node.
(SHMEM) instead of UDP can avoid fragmentation
of large messages and can reduce overall load. The
Towards Zero Copy (TZC) technique presented in a
study (Wang et al., 2018) eventually eliminates the
overhead of serializing and copying messages.
ACKNOWLEDGEMENTS
The work presented in this paper was conducted in the
KIS’M project, funded by the German Federal Min-
istry for Digital and Transport (BMDV).
REFERENCES
Baidu Apollo consortium (2023). Apollo Auto,
an open autonomous driving platform.
https://github.com/ApolloAuto/apollo/. Accessed:
Dec. 01, 2023.
B
´
edard, C., Lajoie, P.-Y., Beltrame, G., and Dagenais, M.
(2023). Message flow analysis with complex causal
links for distributed ROS 2 systems. Robotics and Au-
tonomous Systems, 161:104361.
Binder, T., Wedel, A., B
¨
uhren, M., Herget, C., Studer, S.,
Maier, H., Breu, J., Hafner, M., Hug, T., H
¨
ammerling,
C., et al. (2016). Assistenzsysteme in neuer Dimen-
sion. Sonderprojekte ATZ/MTZ, 21(Suppl 1):70–81.
B
´
edard, C., Lutkebohle, I., and Dagenais, M. (2022).
ros2 tracing: Multipurpose low-overhead framework
for real-time tracing of ROS 2. IEEE Robotics and
Automation Letters, 7:6511–6518.
During, M. and Lemmer, K. (2016). Cooperative maneu-
ver planning for cooperative driving. IEEE Intelligent
Transportation Systems Magazine, 8(3):8–22.
Eiermann, L., Sawade, O., Bunk, S., Breuel, G., and
Radusch, I. (2020). Cooperative automated lane
VEHITS 2024 - 10th International Conference on Vehicle Technology and Intelligent Transport Systems
62

merge with role-based negotiation. In 2020 IEEE In-
telligent Vehicles Symposium (IV), pages 495–501.
Granados, S. (2017). Who is chopping my
application data and why should I care?
https://www.rti.com/blog/2017/07/27/who-is-
chopping-my-application-data-and-why-should-i-
care/. Accessed: Dec. 04, 2023.
Guti
´
errez, C. S. V., Juan, L. U. S., Ugarte, I. Z., and Vilches,
V. M. (2018). Towards a distributed and real-time
framework for robots: Evaluation of ROS 2.0 com-
munications for real-time robotic applications. arXiv
preprint arXiv:1809.02595.
Kronauer, T., Pohlmann, J., Matthe, M., Smejkal, T.,
and Fettweis, G. (2021). Latency analysis of ROS2
multi-node systems. IEEE International Conference
on Multisensor Fusion and Integration for Intelligent
Systems.
Lang, A. H., Vora, S., Caesar, H., Zhou, L., Yang, J., and
Beijbom, O. (2019). Pointpillars: Fast encoders for
object detection from point clouds. In Proceedings
of the IEEE/CVF conference on computer vision and
pattern recognition, pages 12697–12705.
Li, Z., Hasegawa, A., and Azumi, T. (2022). Autoware
perf:
A tracing and performance analysis framework for
ROS 2 applications. Journal of Systems Architecture,
123:102341.
Macenski, S., Foote, T., Gerkey, B., Lalancette, C., and
Woodall, W. (2022). Robot operating system 2: De-
sign, architecture, and uses in the wild. Science
Robotics, 7.
Maruyama, Y., Kato, S., and Azumi, T. (2016). Explor-
ing the performance of ROS2. In Proceedings of
the 13th International Conference on Embedded Soft-
ware, pages 1–10.
Object Management Group (2015). OMG Data
Distribution Service (DDS) Version 1.4.
https://www.omg.org/spec/DDS/1.4/PDF. Accessed:
Dec. 04, 2023.
Open Robotics (2022a). About internal ROS 2 inter-
faces — ros 2 documentation: Rolling documenta-
tion. https://docs.ros.org/en/rolling/Concepts/About-
Internal-Interfaces.html. Accessed: Dec. 11, 2023.
Open Robotics (2022b). Creating a workspace —
ROS 2 documentation: Rolling documentation.
https://docs.ros.org/en/rolling/Tutorials/Beginner-
Client-Libraries/Creating-A-Workspace/Creating-A-
Workspace.html. Accessed: Nov. 27, 2023.
Open Robotics (2022c). Using colcon to build packages
— ROS 2 documentation: Rolling documentation.
https://docs.ros.org/en/rolling/Tutorials/Beginner-
Client-Libraries/Colcon-Tutorial.html. Accessed:
Dec. 04, 2023.
Pemmaiah, A., Pangercic, D., Aggarwal, D., Neumann, K.,
and Marcey, K. (2022). Performance testing in ROS
2. https://www.apex.ai/post/performance-testing-in-
ros-2. Accessed: Nov. 24, 2023.
Reif, K. (2011). Bosch Autoelektrik und Autoelektronik.
Springer.
Reke, M., Peter, D., Schulte-Tigges, J., Schiffer, S., Fer-
rein, A., Walter, T., and Matheis, D. (2020). A
self-driving car architecture in ROS2. 2020 In-
ternational SAUPEC/RobMech/PRASA Conference,
SAUPEC/RobMech/PRASA 2020.
SAE (2021). J3016b: Taxonomy and definitions for terms
related to driving automation systems for on-road mo-
tor vehicles—SAE International.
Samuel, M., Hussein, M., and Mohamad, M. B. (2016). A
review of some pure-pursuit based path tracking tech-
niques for control of autonomous vehicle. Interna-
tional Journal of Computer Applications, 135(1):35–
38.
Schaeufele, B., Sawade, O., Pfahl, D., Massow, K.,
Bunk, S., Henke, B., and Radusch, I. (2017).
Forward-looking automated cooperative longitudinal
control: Extending cooperative adaptive cruise con-
trol (CACC) with column-wide reach and automated
network quality assessment. In 2017 IEEE 20th In-
ternational Conference on Intelligent Transportation
Systems (ITSC), pages 1–6.
Sch
¨
aufele, B., Sawade, O., Becker, D., and Radusch, I.
(2017). A transmission protocol for fully automated
valet parking using DSRC. In 2017 14th IEEE An-
nual Consumer Communications & Networking Con-
ference (CCNC), pages 636–637.
Spielberg, N. A., Brown, M., Kapania, N. R., Kegelman,
J. C., and Gerdes, J. C. (2019). Neural network vehi-
cle models for high-performance automated driving.
Science robotics, 4(28):eaaw1975.
The Autoware Foundation (2023). Autoware.auto.
https://www.autoware.auto/. Accessed: Nov. 29,
2023.
Unseld, R. (2020). The next generation of vehicles will
no longer have mechanical steering. ATZelectronics
worldwide, 15(9):14–17.
Wang, Y.-P., Tan, W., Hu, X.-Q., Manocha, D., and Hu, S.-
M. (2018). Tzc: Efficient inter-process communica-
tion for robotics middleware with partial serialization.
IEEE International Conference on Intelligent Robots
and Systems, pages 7805–7812.
Wulff, F., Sch
¨
aufele, B., Sawade, O., Becker, D., Henke,
B., and Radusch, I. (2018). Early fusion of camera and
lidar for robust road detection based on U-Net FCN. In
2018 IEEE Intelligent Vehicles Symposium (IV), pages
1426–1431.
Yan, Y., Mao, Y., and Li, B. (2018). SECOND:
Sparsely embedded convolutional detection. Sensors,
18(10):3337.
Performance Evaluation of a ROS2 Based Automated Driving System
63
