
A Water-Energy-Food Nexus Approach to Assess Land Use Trade-Offs in
Small Islands
Romain Authier
1 a
, Benjamin Pillot
1 b
, Guillaume Guimbreti
`
ere
2 c
, Pablo-Corral Broto
3 d
and
Carmen Gervet
1 e
1
ESPACE-DEV, Univ. Montpellier, IRD, Univ. Antilles, Univ. Guyane, Univ. R
´
eunion, Montpellier, France
2
LACY, CNRS, Univ. R
´
eunion, Saint-Denis, France
3
ESPACE-DEV, Univ. R
´
eunion, IRD, Univ. Antilles, Univ. Guyane, Univ. Montpellier, Saint-Pierre, France
Keywords:
Geographic Information System, Land Use Trade-Offs, Thresholds Identification, Optimization.
Abstract:
Due to their isolation, limited resources and high population density, small islands are particularly vulnerable
to multi-sectoral crises. The study of the sustainability of small island social and environmental development
raises among others the challenge of balanced uses of local resources, including water, food and energy.
Aspects of this are currently investigated through so called models of the Water-Energy-Food (WEF) nexus. In
this paper we propose a novel approach of the WEF nexus through the optimization of scenarios that make use
of Geographical Information Systems (GIS) integrated with robust optimization models coined in Operations
Research. Our contribution allows the identification of trade-offs between future land use potentials and
thresholds by maximizing a food Self-Sufficiency Ratio (SSR) by 2035. We show a case study of our approach
on Reunion island, based on real data. Our results show through different scenarii of land use dynamics, the
potential of this model as a decision-support tool.
1 INTRODUCTION
Small islands are characterized by significant eco-
nomic, climatic and demographic vulnerabilities
(Briguglio and Nurse, 2001) as well as food and en-
ergy vulnerabilities, through the dependence of these
islands on fossil fuels (Genave et al., 2020) and food
imports (Teng, 2020). Additional land vulnerabili-
ties emerge from a combination of biophysical, socio-
economic and demographic factors (Birch-Thomsen
et al., 2010). To cope with the various vulnerabili-
ties they face, small islands need to adopt a posture of
resilience through water management improvement
(Holding et al., 2016) and through greater empower-
ment, harnessing local resources (Kim et al., 2015) by
the development of renewable energies and local food
systems to support energy self-sufficiency process
(Weir and Kumar, 2020) and food self-sufficiency
process (Guell et al., 2022). Nevertheless, land-use is
a
https://orcid.org/0009-0009-5595-7516
b
https://orcid.org/0000-0003-3797-1356
c
https://orcid.org/0000-0003-1716-8638
d
https://orcid.org/0000-0001-9270-5849
e
https://orcid.org/0000-0002-8062-2808
a core issue to tackle multiple resource management
and planning, especially if an objective is to maxi-
mize local resources usage in a highly spatially con-
strained territory (Samara et al., 2015). A suitable and
promising approach to address the multiple and inter-
dependent challenges is the integrated WEF (Water-
Energy-Food) nexus. This approach explores the con-
nections between water, energy and food resources to
better understand their interdependence in the context
of sustainable development (Lotfi et al., 2020).
To the best of our knowledge, few studies have
combined different approaches to explore the inter-
dependencies between multiple resources through the
WEF nexus at a small island scale. (Rodr
´
ıguez-
Urrego et al., 2022) provide a decision support-tool
through scenarios production to analyze future trends
in energy consumption and greenhouse gases emis-
sions on the island of Tenerife (Spain), based on pro-
jections of demand for water and energy resources.
The approach developed by (Chen et al., 2020), for
its part, consists in a material flow analysis to assess
the risks associated with the WEF nexus and gives
us important information on the impact of popula-
tion growth and industrial development on securing
26
Authier, R., Pillot, B., Guimbretière, G., Broto, P. and Gervet, C.
A Water-Energy-Food Nexus Approach to Assess Land Use Trade-Offs in Small Islands.
DOI: 10.5220/0012556900003696
Paper published under CC license (CC BY-NC-ND 4.0)
In Proceedings of the 10th International Conference on Geographical Information Systems Theory, Applications and Management (GISTAM 2024), pages 26-38
ISBN: 978-989-758-694-1; ISSN: 2184-500X
Proceedings Copyright © 2024 by SCITEPRESS – Science and Technology Publications, Lda.

WEF resources in an island environment. These stud-
ies provide a systemic vision of the issues linked to
the WEF nexus and the levers to be taken into ac-
count to improve the WEF nexus sustainability from
an economic and environmental point of view. How-
ever, they do not aim at addressing land use chal-
lenges linked to the use of local resources. Land use
challenges are depicted by (Lin et al., 2019) through
a decision support tool based on a user-friendly nexus
platform with GIS in Taiwan: GREAT for FEW. This
tool, based on a life cycle assessment, aims at inves-
tigating the influences of food security on land-use
change dynamics and to study the trade-offs between
bioenergy production, food supply and environmen-
tal benefits. Finally, (Russeil et al., 2023) proposed a
spatio-temporal modelling of drivers of change that
influence food and energy self-sufficiency through
semi-directive interviews in Reunion (French over-
seas department). Land use maps are generated fol-
lowing different land use scenarios for 2035. If these
studies illustrate land use competition, land use sce-
narios do not search for thresholds linked to resource
self-sufficiency process.
In summary, existing WEF nexus approaches do
not explore thresholds to resource self-sufficiency
process when investigating land-use trade-offs.
In this paper, we address land uses issues through
the specific framework of thresholds to food self-
sufficiency process, that is to say, to what extent can
local production meet food demand in a small is-
land subject to multiple constraints ? The key chal-
lenges we identified to analyse food self-sufficiency
process through the WEF nexus are threefold: 1) a
need to integrate multi-source and spatial data, 2) the
definition and specification of heterogeneous spatio-
temporal constraints reflecting the WEF nexus, and
3) a comprehensive model to derive insightful deci-
sion support scenarios. From a systemic modelling
point of view, these challenges require innovative ap-
proaches that bring together the collection of data, the
specification of the constraints at hand, and an opti-
misation module to derive insightful scenarios. Our
main goal is to derive a generic methodology, that
contributes a cartography of existing land use for each
cadastral parcel based on real data, the specification
of geographical constraints (land use, topography...),
to extract potential alternative land usages of these
parcels to be determined in the optimization process.
Another element to be accounted for when optimizing
cost functions in the context of spatial assignments,
is the need to digitalize the contextual data (popula-
tion, resource demand). The optimization approach
will aim at deriving scenarios that seek the optimal fu-
ture land uses per parcel on a 10 years time projection
(by 2035) while satisfying the various spatio-temporal
constraints linked to the WEF nexus. In this paper, we
present our integrated Geographical Information Sys-
tem (GIS) and robust optimization methodology as a
comprehensive decision-support tool that models the
WEF nexus to assess land use trade-offs and identify
thresholds for small islands territories.
Summary of Contributions. Our main contribu-
tions can be summarized as follows: 1) the identifi-
cation of land use trade-offs to determine thresholds
to food self-sufficiency process in small island territo-
ries within a WEF nexus approach and 2) through the
combination of a GIS and optimization model that in-
tegrates a wide range of data and constraints specific
to the nexus in small islands such as constraints on
urban sprawl, energy and food production/demand so
that the food self-sufficiency ratio is maximized. Our
integrated approach enables the modelling of land use
competition in order to determine the thresholds to
food self-sufficiency process. Quantifying land use
impacts linked to the WEF nexus is one of the key
aspect of our approach.
The paper is structured as follows. In Section 2
we present the overall methodology, including the ex-
traction of GIS data to characterize the specific fea-
tures of the territory (topography, land use, cadas-
tral parcels) and also the WEF resources (energy re-
source, rainfall, irrigated perimeters, crop yields); the
optimization module that consists in maximizing a
food self-sufficiency ratio under different geograph-
ical and supply/demand balance constraints related to
the nexus. Section 3 illustrates our approach by ap-
plying our model to the case of the French Reunion
island. It shows how our model can provide a frame-
work for land-use pathways policies respecting local
resource limits. This integrated model is thought as
a simple decision-support tool to policy makers con-
cerned by the objective of land use management to
enhance food self-sufficiency process.
2 OUR NEXUS MODEL
2.1 Overall Methodology
The integrated modelling approach is depicted in Fig-
ure 1. It allows to model both the spatial land use,
and its optimization paying particular attention to (1)
the consideration of land use competition to enable
trade-offs identification and (2) the search for thresh-
olds linked to food self-sufficiency process. Our
modelling framework is divided into two steps. Ge-
ographical data layers input the step 1 which con-
sists in land use potential(s) allocation for each parcel
A Water-Energy-Food Nexus Approach to Assess Land Use Trade-Offs in Small Islands
27

based on values taken by the constraints specified up-
stream. These geographical data layers are in ESRI
shapefile format (cadastral parcels layer, land use
layer, irrigated perimeters layer, and crop yields layer)
and raster format (topography layer, energy resource
layer, and rainfall layer). The land use potential allo-
cation model generates a map of land use potentials.
We undertake a generic pre-processing step to trans-
form the map into a set of lists of attributes corre-
sponding to parcels (such as surfaces, crop yields...)
to feed the optimization module. Quantitative tem-
poral data also input the optimization module. At the
end, the optimization module returns a map of optimal
land uses for each time step. Each step is described in
the subsections below.
2.2 Step 1: Land Use Potential
Allocation
In our approach, the identification of land use trade-
offs requires to divide the territory into cadastral
parcels, and specified the land use constraints to al-
locate land use potentials for each parcel. The land
use potential for a parcel corresponds to the parcel’s
potential for transitioning from its current land use to
another; it reflects the evolution of land use within
the framework of the WEF nexus. In the current ver-
sion of the model, three specific land use potentials
are defined: (i) crop production potential, (ii) urban
development potential, and (iii) electricity production
potential. Land use potential allocation relies on sev-
eral geographical and resource constraints, as spec-
ified in Figure 1, including (i) topographic land use
restrictions, (ii) surface area, (iii) land use type, (iv)
neighborhood distance between parcels, and (v) wa-
ter requirements. The constraint processing will fil-
ter out inconsistent potentials, leading to those that
satisfy all constraints for each parcel. The nexus ap-
proach in small islands implies that some parcels are
open to many uses, while others are not, depending on
their current land use. The constraints specify that (i)
natural and protected parcels do not change their land
use, (ii) agricultural parcels can remain agricultural,
become urban, or become energy-producing parcels,
and (iii) urban parcels cannot change their land use
but can be opened up for energy use (through solar
self-consumption).
Land Use Potential Allocation Model: The
Contribution of the OCELET Language
With all land-use potentials defined, and the associ-
ated constraints specified, we allocate one (or several)
potential(s) for each parcel. The specification of con-
straints and the necessity for spatialization require the
collection of the corresponding set of geographical
data (refer to Figure 1). The initial step consists in as-
signing an average value of each layer feature to each
parcel. Average values of slope (in %), altitude (in m),
energy resource (in kWh/m
2
) and monthly rainfall (in
mm) are calculated for each parcel by spatially over-
lapping pixels (in raster format) with cadastral parcels
(in ESRI shapefile format). Average values for crop
yields (in ton/ha) are also assigned for each parcel.
Given the sufficiently small average surface area of
the parcels (with an average value of 5586 m
2
and a
standard deviation of 91239 m
2
), this method of as-
signing average values is deemed realistic. Note that
the allocated actual land use for each parcel is the one
with the largest area within that parcel. Subsequently,
this step enables the comparison of the computed av-
erage values with predefined constraints values ob-
tained from literature and field data for potential al-
location.
The main challenge of potential allocation lies in
allocating urban development potential to character-
ize urban sprawl. Indeed, it is considered that urban
sprawl takes place close to urbanized parcels (Lajoie
and Hagen-Zanker, 2007). Neighborhood relations
between parcels must, therefore, be defined. These
relationships can be modeled through an interaction
graph linking neighboring parcels. A powerful lan-
guage for processing land-use dynamics using inter-
action graphs is the domain-specific language Ocelet
(Degenne and Lo Seen, 2016). We generate an in-
teraction graph between urbanizable parcels and ur-
ban parcels. Urbanizable parcels must comply with
maximum slope and distance thresholds from urban
parcels as well as specific land use criteria. We then
apply an interaction function to the graph that assigns
a urban development potential to each urbanizable
parcel on the graph. Finally, the assignment of other
land use potentials must satisfy constraints linked
to minimal surface area, maximal altitude, maximal
slope, and specific land use for the allocation of elec-
tricity production potential, and additional constraints
such as water requirements for the allocation of crop
production potential. To satisfy the water require-
ments constraint, the parcel must be located within
irrigated perimeters or receive an adequate amount of
rainfall to support crop production.
A map of land use potentials is then generated
by the land use potential allocation model and trans-
formed into a set of parcel attribute lists to feed the
optimization model.
GISTAM 2024 - 10th International Conference on Geographical Information Systems Theory, Applications and Management
28
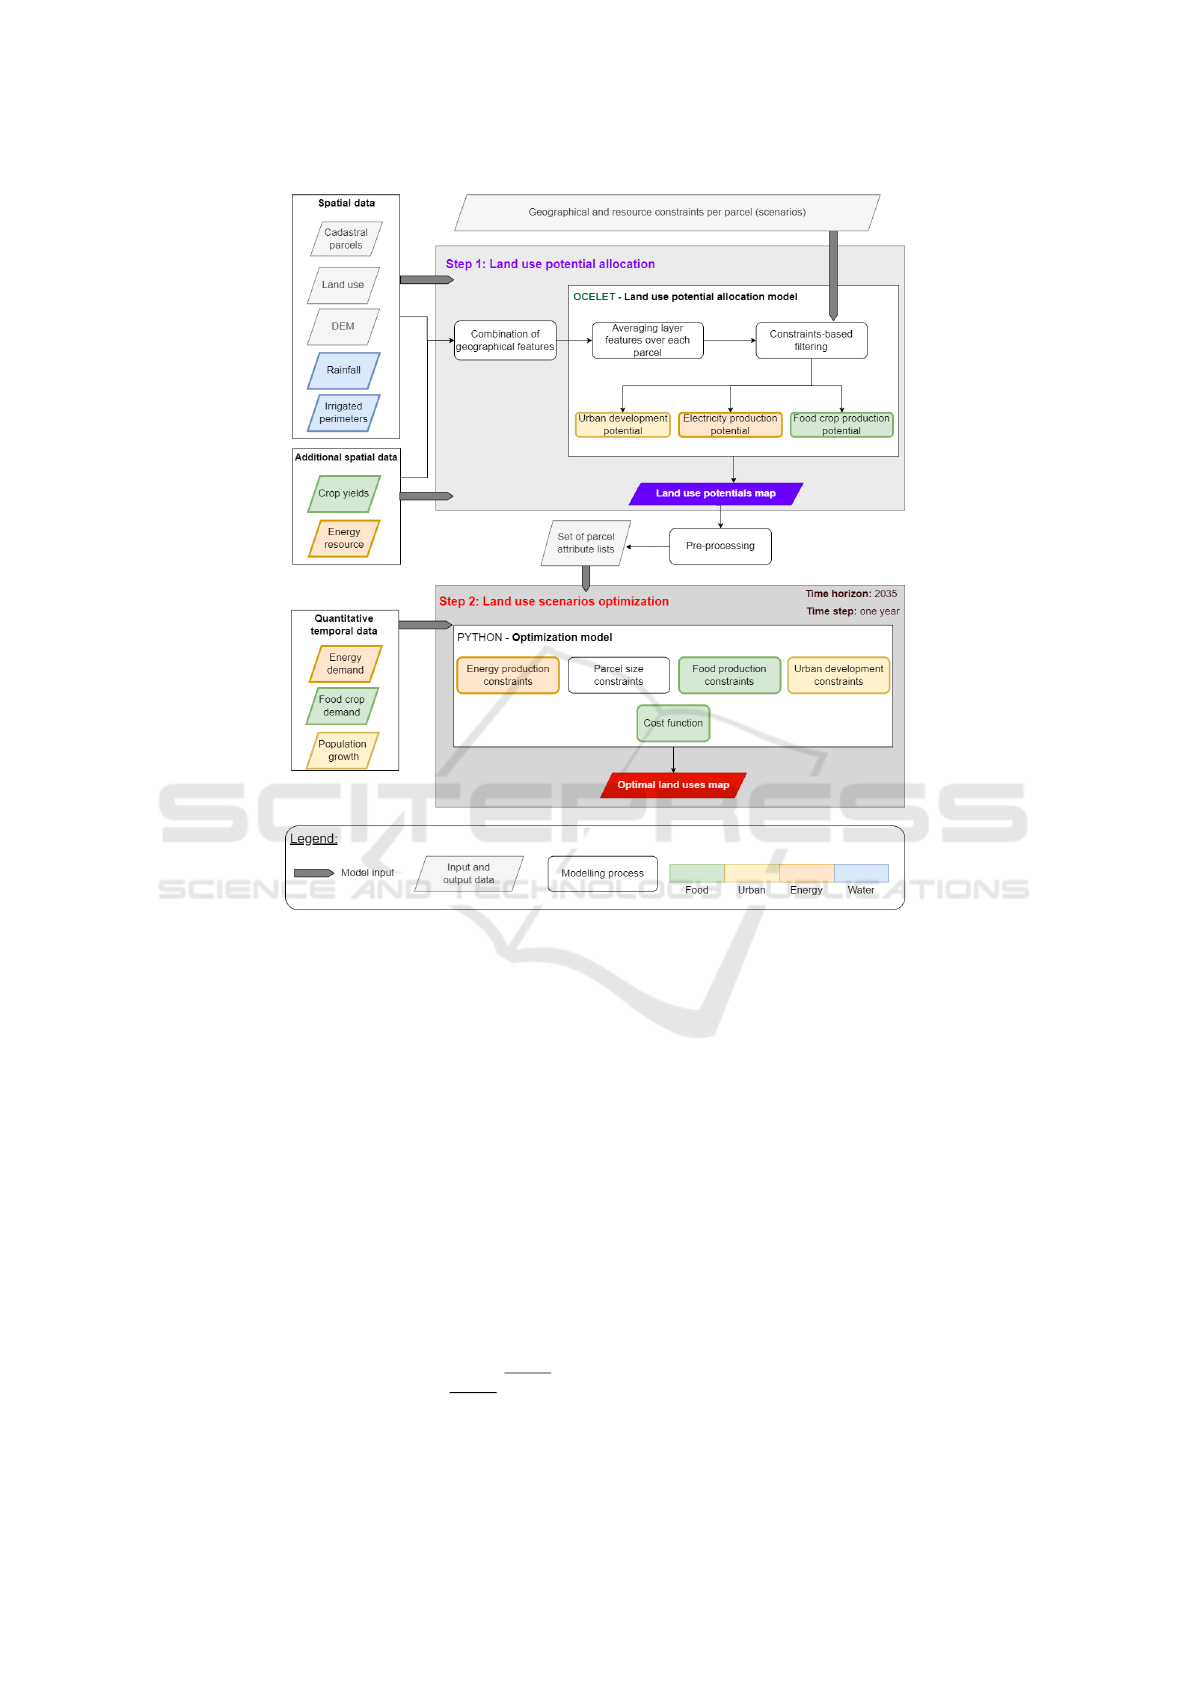
Figure 1: Integrated modelling framework.
2.3 Step 2: Land Optimization
As shown in Figure 1, the optimization model takes
as input a set of parcel attribute lists and temporal
data such as projected population growth, electric-
ity and food crop demand by 2035. These projec-
tions are derived from estimates provided by insti-
tutes and companies. For each time step, it selects
optimal land use(s) for each parcel from among all
its potential land uses, considering WEF-related con-
straints and the objective function for the time horizon
2035. At the end of the optimization process, a parcel
can therefore have several concomitant land uses. The
goal of the optimization, here, is to maximize a food
Self-Sufficiency Ratio (SSR), expressed in kcal. The
robust modelling approach relies on the creation of
deterministic intervals to enclose uncertainties within
robust extreme values, specified by a low and high
robust limit values (ex: Value = [ Value,Value ])
as mentioned in (Chinneck and Ramadan, 2000) and
(Ben-Tal and Nemirovski, 1999). This approach al-
lows the planning of best and worst case scenarios.
The specifications of the optimization problem are
given in Table 1.
Variables. The decision variables are designed to
highlight land use competition among all the defined
land use potentials, i.e. electricity production, food
crop production, and urban development. Hence, the
area variables depicts the surfaces allocated to (1) ur-
ban development, (2) food crop production and (3)
electricity production from a specific energy source
within each parcel and for each time step. These vari-
ables range across a real interval and are increasing
over time.
(1) ∀t ∈ T, ∀p ∈ P
u
, s
t,p
∈ [0, S
p
]
(2) ∀t ∈ T, ∀p ∈ P
c
, s
t,p
∈ [0, S
p
]
(3) ∀t ∈ T, ∀p ∈ P
e
, s
t,p
∈ [0, S
p
]
Food Production Constraint. The initial set of
constraints pertains to annual crop production, ensur-
ing that it does not exceed the projected annual de-
A Water-Energy-Food Nexus Approach to Assess Land Use Trade-Offs in Small Islands
29

Table 1: Optimization problem specifications.
Given:
Unit: Year t ∈ T = {2023...2035}
Unit: Parcel p ∈ P = {set o f parcels}
Unit: Crop c ∈ C = {set o f crops}
Unit: Energy source e ∈ E = {set o f primary energy sources}
Set of parcels with a potential of production of crop c P
c
Set of parcels with a potential of production of electricity from source e P
e
Set of parcels with urban development potential P
u
Total electricity demand for a year t (GW h) d
elec
t
= [d
elec
t
,d
elec
t
]
Existing electricity production (GW h) P
elec
Surface of parcel p (ha) S
p
Number of households for a year t h
t
= [h
t
,h
t
]
Urban extension area per new household for a year t (ha/household) Su
h
t
Surface energy density from a primary source e for a parcel p (GW h/ha) p
e
p
Total demand for crop c for a year t (ton) d
c
t
= [d
c
t
,d
c
t
]
Calories per kg of crop c (kcal/ton) kcal
c
Yield of crop c for a parcel p (ton/ha) Yield
c
p
Find:
The optimal land use(s) for a parcel among all its potential land uses
The surface areas allocated to urban development, food crop and electricity production
Objective function:
Maximize food self-sufficiency ratio
Such that the following constraints hold:
Local food crop production is less than or equal to the food crop demand
Total annual electricity production meets demand
Fossil fuels imports are decreasing
Limit on intermittent Renewable Energies (RE) existing and new production
Limit on urban sprawl
mand regarding food crop for both the best case sce-
nario (lowest projected demand) and the worst case
scenario (highest projected demand) for each time
step. The objective is to fulfill local population re-
quirements, while simultaneously preventing surplus
food exports for the considered food crops, in order to
delineate the thresholds to food self-sufficiency pro-
cess.
Best case scenario: ∀t ∈ T,∀c ∈ C,
∑
p∈P
c
s
t,p
∗Yield
c
p
≤ d
c
t
(1)
Worst case scenario: ∀t ∈ T,∀c ∈ C,
∑
p∈P
c
s
t,p
∗Yield
c
p
≤ d
c
t
(2)
Electricity Production Constraint. The second set
of constraints relates to additional and existing elec-
tricity production matching the projected electricity
demand for both the best case scenario (lowest pro-
jected demand) and the worst case scenario (highest
projected demand) for each time step. It demonstrates
the impact of electricity generation on land use based
on the primary energy source used.
Best case scenario: ∀t ∈ T,
∑
e∈E
∑
p∈P
e
s
t,p
∗ p
e
p
+ P
elec
= d
elec
t
(3)
Worst case scenario: ∀t ∈ T,
∑
e∈E
∑
p∈P
e
s
t,p
∗ p
e
p
+ P
elec
= d
elec
t
(4)
Energy Imports Constraints. The nexus approach
developed here involves increasing the use of local re-
newable energy resources. Hence, the third set of con-
straints refers to energy imports and is built in such a
way that electricity generation from imported fossil
fuels is gradually decreasing to zero throughout the
planning horizon.
Intermittent RE Production Constraint. The max-
imum share of intermittent renewable energies (wind
and photovoltaic without storage) that can be injected
GISTAM 2024 - 10th International Conference on Geographical Information Systems Theory, Applications and Management
30

into the grid at a given time has to be limited in is-
land systems due to high variability of these energy
sources that may affect the stability of the power grid
(EDF-SEI, 2023). Thus, a maximal threshold is set
for ground-mounted PV and wind power production.
Solar Self-Consumption Constraint. This set of
constraints depicts the will to preserve land surfaces
and to limit the development of ground-mounted PV
due to the low power density of solar energy (Trainor
et al., 2016). It is assumed that some urban parcels
are equipped with photovoltaic panels on their roofs
for solar self-consumption. This enables industrial or
domestic consumers to utilize their own electricity di-
rectly without relying on the power grid, constituting
a decentralized system.
Urban Sprawl Constraints. This set of constraints
pertains to the extent of urbanization, which is influ-
enced by economic development and expected popu-
lation growth for both the best case scenario (lowest
population projections) and the worst case scenario
(highest population projections).
Best case scenario: ∀t ∈ T,
∑
p∈P
u
s
t,p
= Su
h
t
∗ (h
t
− h
0
) (5)
Worst case scenario: ∀t ∈ T,
∑
p∈P
u
s
t,p
= Su
h
t
∗ (h
t
− h
0
) (6)
Land Use Conversion of Potential Areas. At each
time step, a maximum surface area is established for
the conversion of potential food crop areas into effec-
tive food crop production areas, preventing the con-
version of all potential surfaces from the initial time
steps. The specified surface limit depends on the food
crop.
Maximize Food SSR. The objective function is the
food SSR (where d
c
t
can take the best or worst case
value). What we call food SSR corresponds to the
specific SSR for the crops considered in the mod-
elling. Then, the function to maximize is:
∑
c∈C
∑
p∈P
c
s
t,p
∗Yield
c
p
∗ kcal
c
∑
c∈C
d
c
t
∗ kcal
c
∗ 100 (7)
Finally, an optimal land uses map is generated for
each time step under different land use scenarios.
3 CASE STUDY: AGRICULTURAL
PRACTICES SCENARIOS FOR
REUNION ISLAND
The proposed framework illustrated in Figure 1 is ap-
plied to Reunion island. Reunion Island is an over-
seas french department located in the Indian Ocean,
around 200 km southwest of Mauritius and 900 km
east of Madagascar. Small in size and particularly
vulnerable to natural hazards, to land pressure linked
to urban sprawl (INSEE, 2018) and to any disturbance
linked to imports (fossils fuels and foodstuffs), Re-
union Island is a relevant laboratory to study the is-
sues related to land use trade-offs within the frame-
work of WEF nexus. These issues are reinforced by
the will of the French government to move towards
food and energy self-sufficiency by 2030 (CIRAD-
AFD, 2021). In Figure 2 is represented the land-use
map for Reunion, delineated by cadastral parcels ac-
cording to three main areas: agricultural areas, arti-
ficial areas, and natural areas and forest plantations.
What is referred to as ’Excluded areas’ in the leg-
end corresponds to areas between parcels, such as
roads or waterways, as well as the volcano. At first
glance, most of the natural areas and forest plantations
are contained within the national park, covering 42
% of the territory, while agricultural and artificial ar-
eas tend to coexist predominantly near the coast. The
Utilised Agricultural Area (UAA), totaling 42 000 ha,
is composed of sugarcane (54.4 %), livestock breed-
ing (29 %) and other crops, mainly fruits and vegeta-
bles (16.6 %) in 2018 (CIRAD, 2021).
Geographical Data Collection. As input for step
1 (refer to Figure 1), we gathered geographical data
from diverse sources. Monthly rainfall data (in mm)
are sourced from Meteo France. The irrigated perime-
ters layer is from Department of Reunion. The land
use layer for 2021 is extracted from (Le M
´
ezo et al.,
2022). The altitude map and the slope map were ob-
tained from (CGIAR-CSI, 2008), while the cadastral
parcels layer is sourced from (Etalab, 2023). Yearly
data of practical photovoltaic power potential (ex-
pressed in kWh/m
2
) are obtained from (World Bank
Group, 2020). Crop yields (in ton/ha) were estimated
based on a map produced by (Russeil, 2023). The na-
tional park layer is derived from the data provided in
(PEIGEO, 2021).
Land Use Potential Assessment. In this paper, we
considered all the energy sources contributing to elec-
tricity production in Reunion island (OER, 2023a):
coal, oil, wind, PV, hydro, local and imported biomass
but we only consider the future direct land-use impact
A Water-Energy-Food Nexus Approach to Assess Land Use Trade-Offs in Small Islands
31

Figure 2: Land use map delineated by cadastral parcels.
of ground-mounted solar PV (DEAL, 2020). We fo-
cus on three key food items which are part of the lo-
cal creole diet: fruits, vegetables and rice. We exam-
ine the future direct land-use impact associated with
these food items. The future direct land use impact
of water resource and facilities is considered negligi-
ble (CESER, 2017). Finally, the future direct land use
impact of urban development is taken into account.
Hence, four land use potentials are defined within
the framework of the WEF nexus in Reunion island:
(1) potential for electricity generation from ground-
mounted PV systems, (2) rice production potential,
(3) fruit and vegetable production potential and (4)
urban development potential.
Scenarios. We explore two different agricultural
practices scenarios:
• Scenario A (Sugarcane Conservation): current
surface areas dedicated to each crop are main-
tained, constraining future crop production (rice,
fruits, vegetables), ground-mounted PV produc-
tion and urban development in agricultural waste-
lands or in rotation with vegetable crops in the
case of rice cultivation (Association Riz R
´
eunion).
• Scenario B (Subsistence Farming): agriculture
intended for the local population is preserved to
the detriment of sugarcane, which is the primary
crop for exports. It illustrates the commitment to
support food self-sufficiency process through the
promotion of subsistence farming.
The specifications of constraints for each land use
potential (scenario A and B) are summarized in Table
3 in the appendix. The scenarios differ in the con-
straint specifications for land use types. The differ-
ent constraints make use of data collected from differ-
ent sources: (1) communication with Association Riz
R
´
eunion and (Makungwe et al., 2021) for slope val-
ues related to rice production potential areas (we con-
sider only one production cycle per year, lasting four
months between November and February), (2) (Lajoie
and Hagen-Zanker, 2007) for slope values related to
urban development potential areas, (3) (Nebey et al.,
2020) for slope values related to ground-mounted PV
potential areas, (4) (Le M
´
ezo et al., 2022) for the max-
imal altitude value and (DAAF, 2017) for the max-
imal slope and water requirements values regarding
fruit and vegetable production potential areas. We de-
fine a maximum neighborhood distance for urban de-
velopment based on the width of a road, as well as
a minimal surface area value for ground-mounted PV
potential areas.
Input Data and Constraints for Optimization. As
input for step 2, temporal data refers to population
growth as well as electricity and food crop demand
(refer to Figure 1). We assume that the increase in
electricity demand in the future will depend on pop-
ulation growth (number of households on the island)
according to INSEE’s low population projection sce-
nario (best case scenario) and high population projec-
tion scenario (worst case scenario) (INSEE, 2018) as
well as the development of the electric vehicle fleet
(DEAL, 2020). The increase in food demand will be
exclusively linked to population growth, in line with
INSEE’s low and high population projection scenar-
ios (best and worst cases)(INSEE, 2018). Some con-
straints implemented in the optimization model (re-
fer to Figure 1) need to be specified in the case of
Reunion. Regarding the electricity production con-
straint (refer to Equation 3 and Equation 4): we con-
sider that electricity production from wind power is
set to increase until 53 GWh by 2035 (OER, 2023c);
GISTAM 2024 - 10th International Conference on Geographical Information Systems Theory, Applications and Management
32

the electricity production from hydro is considered to
be stochastic, following a uniform distribution within
a specified range, which is determined based on hy-
dropower data spanning from 2000 to 2021 (OER,
2023c); the electricity production thanks to local
biomass depends on the amount of sugarcane residues
(bagasse) collected (OER, 2023c) and the electricity
production is reduced to zero for coal and projected
to be reduced to zero by the end of 2030 for oil. Con-
cerning the urban development constraints (refer to
Equation 5 and Equation 6), we take a constant ur-
ban extension area per new household based on rec-
ommendations from Reunion Regional Development
Plan throughout the time horizon. Values for the time-
related maximum surface area of conversion from po-
tential to effective food crop production areas (refer
to Land use conversion of potential areas constraint
defined in subsection 2.3) have been assessed by the
author due to the absence of existing data.
Data related to the static parameters of the opti-
mization model are summarized in Table 4 in the ap-
pendix.
3.1 Results and Analysis
The main output results presented here to support fu-
ture decision-making are (1) the identification of po-
tential areas on the island for two agricultural prac-
tices scenarios and (2) the determination of thresh-
olds to food self-sufficiency process for both scenar-
ios, considering various electricity mixes. These find-
ings can serve as guidance for policymakers in mak-
ing informed decisions regarding land use manage-
ment.
3.1.1 Land Use Potential Areas
Land use potential areas are depicted on land use po-
tential maps at the output of step 1 (refer to Figure 1).
Land use potential maps are shown for rice produc-
tion potential areas (Figure 3a), ground-mounted PV
potential areas (Figure 3b), fruit and vegetable pro-
duction potential areas (Figure 3c) and urban devel-
opment potential areas (Figure 3d) for both scenario
A (sugarcane conservation) and scenario B (subsis-
tence farming). Firstly, we can see that the potential
surface areas in Figures 3a, 3b and 3c are significantly
greater for scenario B compared to scenario A due to
the conversion of some sugarcane areas for alternative
purposes (in this case energy and agriculture).
Secondly, we observe that the potential areas for
rice production and ground-mounted PV (Figure 3a
and Figure 3b) are concentrated around the same
sites: mainly in the north-east of the island with a
smaller portion in the south-west for scenario B, and
mainly in the south-west for the scenario A. This il-
lustrates the potential future land use competition be-
tween agriculture and energy. Note that, for sce-
nario B, the absence of rice production and ground-
mounted PV potential areas in the west is explained
by the fact that many surgarcane parcels have exces-
sively steep slopes (> 10 %). Conversely, as depicted
on Figure 3c, fruit and vegetable production poten-
tial areas are more scattered along the coast for sce-
nario B. In the eastern region, we identify areas that
directly compete with rice and ground-mounted PV,
unlike those in the western region. The presence of
potential areas for fruit and vegetable production in
the west can be attributed to the inclusion of parcels
with steep slopes (< 30 %) within these areas. For
scenario A, we identify the same locations for fruit
and vegetable, rice and ground-mounted PV potential
areas (mainly in the south west).
Finally, Figure 3d illustrates artificial areas as well
as potential areas for urban development for scenario
A (same map for scenario B). We can see here that
urban development potential areas are located in the
north-west, very close to the coast (where the agri-
cultural wastelands adjacent to urban parcels are lo-
cated). Therefore, we can assume that the locations
of these potential areas do not directly compete with
the other defined land use potential areas.
3.1.2 Identifying Thresholds to Food
Self-Sufficiency Process
Among its various potential outputs, the optimization
model provides a maximum food SSR (as expressed
in Equation 7) for each time step. Here, thresholds
to food self-sufficiency will be studied in the light of
Reunion’s electricity mix. Specifically, we will em-
phasize the impact of electricity production on food
production in terms of land use. Three distinct elec-
tricity mixes are analyzed for the 2035 time horizon
and specified in Table 2.
For scenario B (subsistence farming), none of
the electrical mixes has an impact on the food SSR.
Indeed, if potential areas for rice production and
ground-mounted PV appear to be in the same loca-
tions (refer to Figure 3a and Figure 3b), some ar-
eas only have the potential for ground-mounted PV,
and these areas are sufficient to host ground-mounted
PV systems regardless of the mix. As a result, areas
with both potentials will not be converted. In the ab-
sence of land use trade-offs, decision makers can ori-
ent policies towards what they identify as an optimal
electricity mix. If the criteria for selecting an opti-
mal mix prioritize the reduction of the energy land use
footprint and minimizing energy imports, an electric-
ity mix with a high share of solar self-consumption,
A Water-Energy-Food Nexus Approach to Assess Land Use Trade-Offs in Small Islands
33
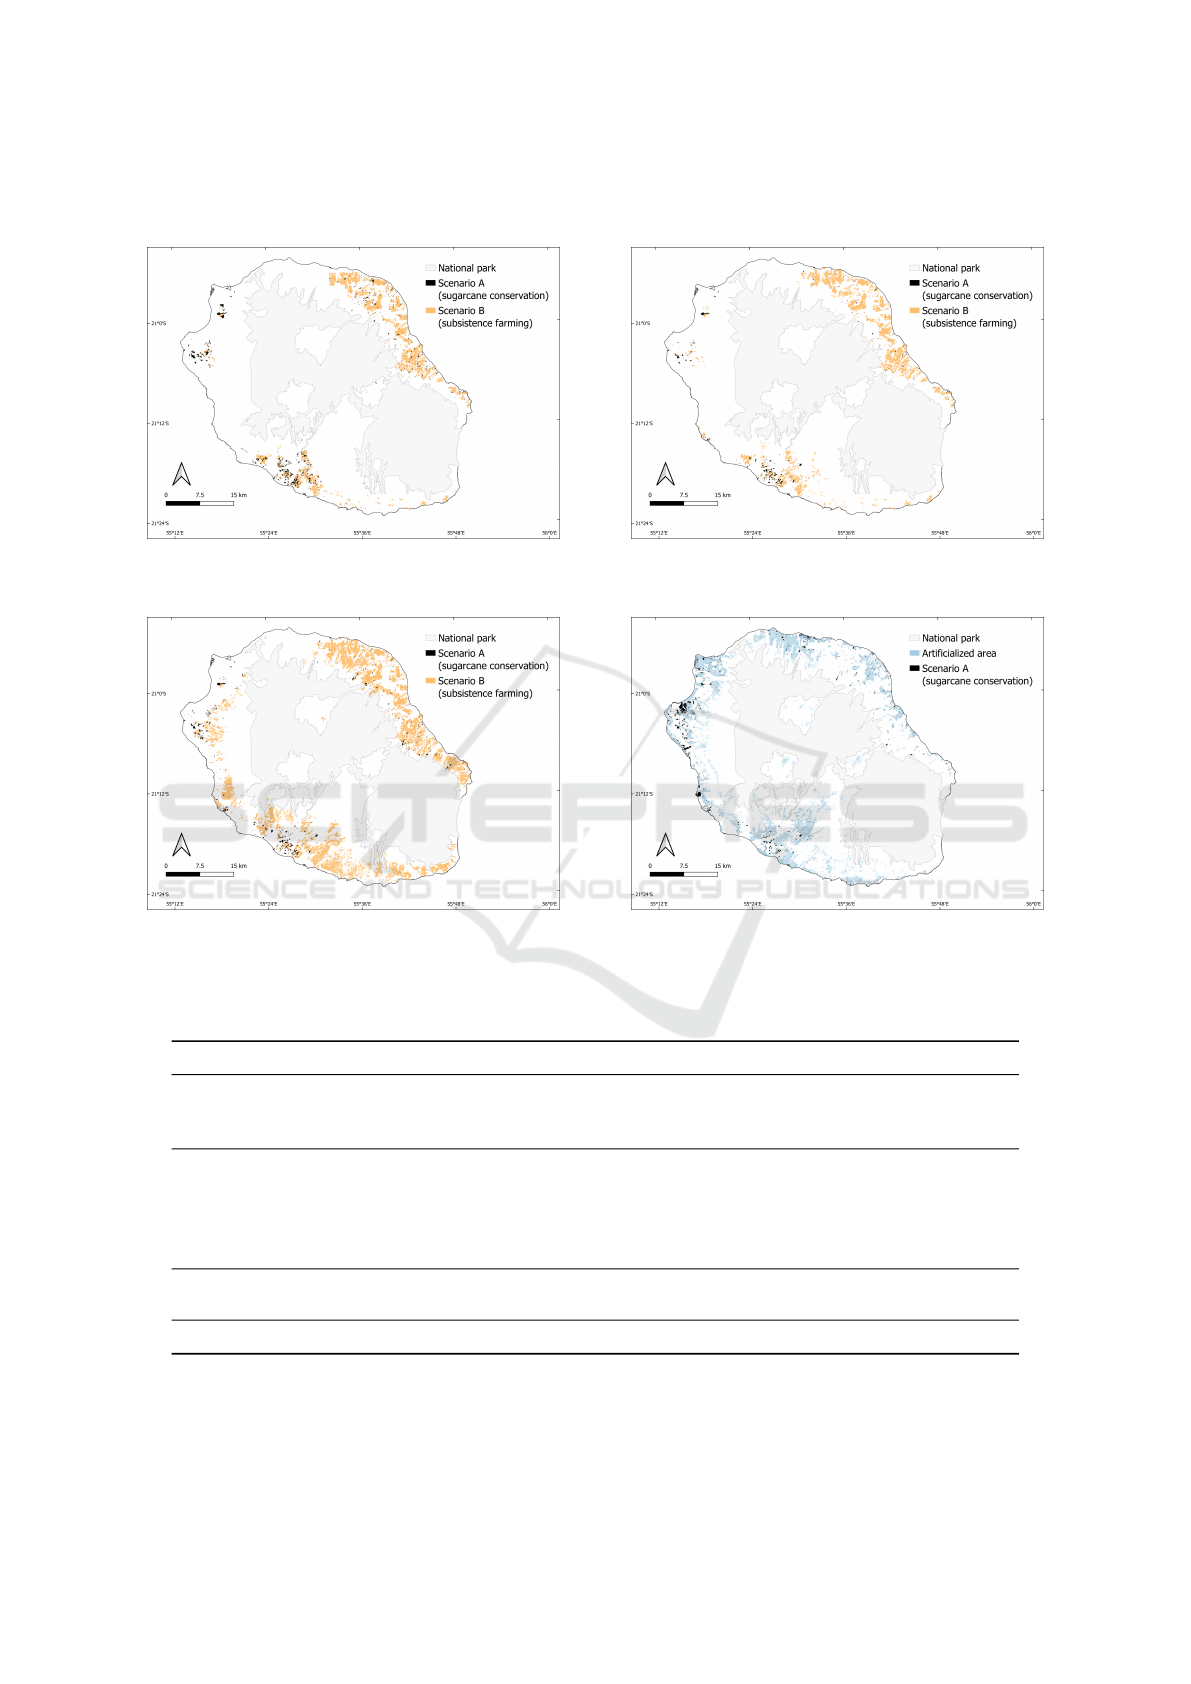
(a) Rice production potential areas. (b) Ground-mounted PV potential areas.
(c) Fruit and vegetable production potential areas. (d) Artificial and potential areas for urban development.
Figure 3: Land use potential maps.
Table 2: Characteristics of potential future electricity mixes.
Electricity mix Specifications
Mix 1
The RE intermittent energy threshold is set to 32 % (EDF-SEI, 2023). Substantial
biomass imports limit ground-mounted PV deployment, with up to 77 % of future
electricity production relying on biomass during the planning horizon.
Mix 2a
The RE intermittent threshold is set to 50 %. Imported biomass serves as a backup
energy source, contributing up to 30 % of total electricity production. Electricity
generation from ground-mounted solar PV is on the rise during the planning horizon,
with considerations for solar self-consumption in urban parcels less than 100 m
2
(from
11.1 % to 12.3 % of total electricity production).
Mix 2b
Same as mix 2a but solar self-consumption considered for urban parcels less than 70
m
2
(from 5.9 % to 6.6 % of total electricity production).
Mix 3
Same as mix 2a but solar self-consumption is not considered.
GISTAM 2024 - 10th International Conference on Geographical Information Systems Theory, Applications and Management
34
such as mix 2, appears to be the most preferable.
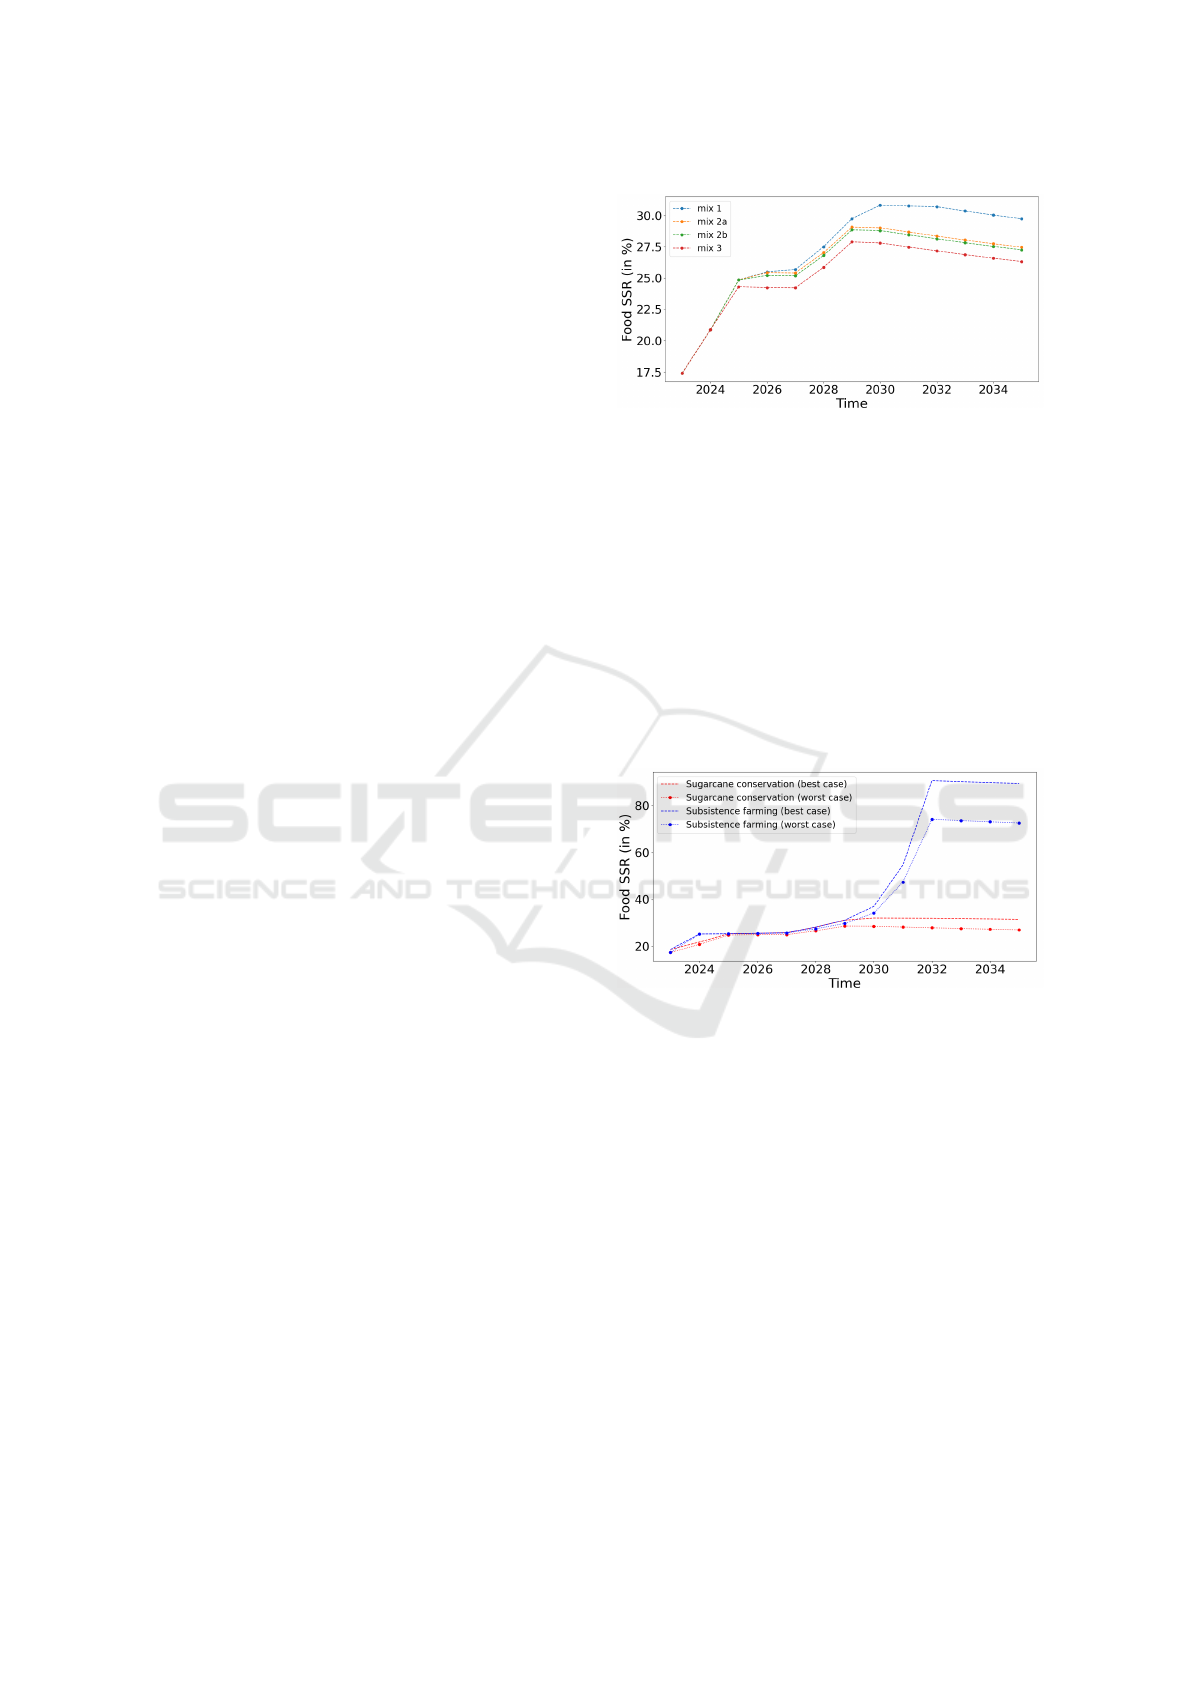
However, electricity mixes influence the food SSR
for scenario A (sugarcane conservation) as illustrated
in Figure 4 up to 2035 for mixes 1, 2a, 2b and 3.
These curves can be segmented into four phases. The
initial phase, characterized by a sharp increase, is at-
tributed to the attainment of 100 % SSR for fruits
and vegetables with few additional surfaces converted
due to high yields per hectare and existing produc-
tion. After reaching this 100 %, we enter the second
phase marked by a slight increase due to the time-
dependent rate of conversion (refer to Land use con-
version of potential areas constraint defined in section
2.3) from parcels with rice crop production potential
to rice crop-producing parcels. With a low conver-
sion rate of potential areas for rice production early
in the simulation, the food SSR only marginally in-
crease. It’s worth noting that for mix 3 (with a high
share of ground-mounted PV), the curve remains flat
due to the conversion of rice and ground-mounted PV
potential areas into ground-mounted PV areas. The
third phase, characterized by an increase, corresponds
to the multiplication of converted parcels into rice-
producing parcels and the impact of the rising con-
version rate. A threshold is then reached at different
time steps depending on the mix. Note that the more
we develop ground-mounted PV, the faster we reach
a threshold. After reaching this threshold, a declin-
ing phase is observed. This is attributed to the impact
of population growth on the demand for food crops.
This phase follow a linear trend as dictated by the lin-
ear projections provided by (INSEE, 2018).
It can be noted that mix 1 (refer to the specifica-
tions in Table 2) has a more favorable impact on food
SSR due to the limited expansion of ground-mounted
PV (threshold set to 32 %) and the extensive use of
imported biomass. Therefore, there is no land use
competition between agricultural and energy produc-
tion. Conversely, mix 3 (refer to the specifications in
Table 2) appears to have the most detrimental impact
on food SSR due to the substantial surface areas re-
quired by ground-mounted solar PV projects, creating
competition with agricultural lands. Finally, increas-
ing solar self consumption looks to contribute posi-
tively to the food SSR thanks to space savings (re-
fer to the specifications of mix 2a and 2b in Table 2).
These differences demonstrate the model’s capability
to depict conflicts of use between agriculture and en-
ergy.
As the differences between the curves are quite
small between mix 1 and 2a (maximum 2.38 % food
SSR loss for each time step), it may be valuable to
identify thresholds to food SSR for scenarios A and B
with mix 2a, which appears more preferable than mix
Figure 4: Influence of the electricity mix on the food SSR
for scenario A for the worst case.
1 in terms of biomass imports (refer to the specifica-
tions in Table 2).
Thresholds to food self-sufficiency process are
then depicted for each scenario with mix 2a in Figure
5. The intervals formed by the best and worst cases
are proof of the robustness of our results for each sce-
nario. By 2035, it is observed that the food SSR varies
from 72 % to 90 % for scenario B (subsistence farm-
ing) and from 27 % to 32 % for scenario A (sugarcane
conservation). These differences arise from replacing
some sugarcane parcels with rice, vegetables, or fruit
crops in scenario B.
Figure 5: Evolution of the food SSR for both scenarios with
mix 2a.
Finally, to understand how the food SSR reaches a
peak, we plot the surfaces areas occupied by the three
considered food crops at t = 2030 in Figure 6a for
scenario A (sugarcane conservation) for the best case.
We can see that the maximum threshold at t = 2030 is
due to the conversion of all rice production potential
areas into rice production areas. Then, rice becomes
the limiting crop due to low yields per hectare (be-
tween 2.8 ton/ha and 3.3 ton/ha) and no current pro-
duction. Conversely, local fruit and vegetable produc-
tion can meet the population’s total food requirements
until 2030.
Few differences exist between the two diagrams
(Figure 6a and Figure 6b) due to rice production
on multiple potential surfaces (for example vegeta-
bles and rice production potential surfaces). Conse-
A Water-Energy-Food Nexus Approach to Assess Land Use Trade-Offs in Small Islands
35

quently, there are fewer surfaces available for fruit
and vegetable production. However, the reduction in
food self-sufficiency for fruits and vegetables is only
1 % between 2030 and 2035, decreasing from 100 %
to 99 %.
For scenario B (subsistence farming), the same
analysis is conducted, with the distinction that all rice
production potential areas have been converted by t =
2032 due to a larger number of potential surfaces.
Land reserves for fruit and vegetable production
can therefore fulfill a significant portion of the pop-
ulation’s needs in scenario A. Thus, for scenario B
(subsistence farming), sugarcane areas having only a
fruit and vegetable production potential (13 473 ha)
are globally preserved.
(a) t = 2030.
(b) t = 2035.
Figure 6: Potential surfaces converted vs potential surfaces
for scenario A for the best case.
4 CONCLUSION
In this paper, we have presented an innovative inte-
grated approach which consists in identifying land
use trade-offs to determine thresholds to food self-
sufficiency process in small island territories within
a WEF nexus approach. The modelling approach
allowed the integration of energy, food, water and
population into a systemic approach based on GIS
and robust optimization to deal with the challenges
linked to food self sufficiency process. The Ocelet
GIS model allowed us to model existing land use at
the parcel level and extract various land use potentials
within a single parcel. The link with the optimization
model enables the identification of thresholds through
the extraction of optimal land uses. Through this
case study, we showed the importance of consider-
ing land use management for both energy and agri-
cultural planning, and the need for an integrated ap-
proach in addressing issues related to the use of lo-
cal resources. Current and future work involve fine-
tuning food consumption by considering different di-
etary profiles (high rice consumption vs high fruit and
vegetable consumption). A second aspect of future
work would consist in exploring various urban growth
scenarios to observe additional effects on land use
competition.
REFERENCES
AGORAH (2016). Prospective t
ˆ
ache urbaine 2030. Techni-
cal report, Agence pour l’observation de la R
´
eunion,
l’Am
´
enagement et l’Habitat.
AGRESTE (2023). Bilan des importations 2013 - 2022.
Technical report.
Ben-Tal, A. and Nemirovski, A. (1999). Robust solutions of
uncertain linear programs. Operations Research Let-
ters, 25(1):1–13.
Birch-Thomsen, T., Reenberg, A., Mertz, O., and Fog, B.
(2010). Continuity and change: Spatiotemporal land
use dynamics on bellona island, solomon islands. Sin-
gapore Journal of Tropical Geography, 31(1):27–40.
Briguglio, L. and Nurse, L. (2001). Small island states.
Climate Change 2001.
CESER (2017). Mieux conna
ˆ
ıtre et mieux g
´
erer l’eau
`
a la
r
´
eunion. Technical report, Conseil
´
Economique, So-
cial et Environnemental R
´
egional.
CGIAR-CSI (2008). SRTM data. https://srtm.csi.cgiar.org
/srtmdata/.
Chambre d’agriculture (2023). Les productions v
´
eg
´
etales.
https://reunion.chambre-agriculture.fr/productions-v
egetales/les-productions-vegetales/.
Chen, I.-C., Wang, Y.-H., Lin, W., and Ma, H.-w. (2020).
Assessing the risk of the food-energy-water nexus of
urban metabolism: A case study of kinmen island, tai-
wan. Ecological Indicators, 110:105861.
Chinneck, J. W. and Ramadan, K. (2000). Linear Program-
ming with Interval Coefficients. The Journal of the
Operational Research Society, 51(2):209–220.
CIRAD (2021). L’agriculture de La R
´
eunion : Chiffres cl
´
es
et d
´
efis. Technical report, Plateforme r
´
egionale en
recherche agronomique pour le d
´
eveloppement dans
l’oc
´
ean Indien.
GISTAM 2024 - 10th International Conference on Geographical Information Systems Theory, Applications and Management
36

CIRAD-AFD (2021).
´
Etude sur les freins et leviers
`
a l’autosuffisance alimentaire : vers de nouveaux
mod
`
eles agricoles dans les d
´
epartements et r
´
egions
d’outre-mer. Technical report.
DAAF (2017). Chapitre 4: Gestion de l’eau et irriga-
tion. Technical report, Direction de l’Alimentation,
de l’Agriculture et de la For
ˆ
et.
DEAL (2020). Programmation pluriannuelle de l’
´
energie de
la r
´
eunion 2019-2028. Technical report, DEAL RE-
UNION.
Degenne, P. and Lo Seen, D. (2016). Ocelet: Simulat-
ing processes of landscape changes using interaction
graphs. SoftwareX, 5:89–95.
EDF-SEI (2023). Limitations de production au titre de la
s
ˆ
uret
´
e syst
`
eme. https://opendata-reunion.edf.fr/page
s/home0/.
Etalab (2023). Cadastre Etalab. https://cadastre.data.gouv.f
r/datasets/cadastre-etalab.
FAO (2001). FOOD BALANCE SHEETS - A Handbook.
Food and Agriculture Organization of the United Na-
tions.
Genave, A., Blancard, S., and Garabedian, S. (2020). An
assessment of energy vulnerability in small island de-
veloping states. Ecological Economics, 171:106595.
Guell, C., Brown, C. R., Navunicagi, O. W., Iese, V.,
Badrie, N., Wairiu, M., Saint Ville, A., and Unwin,
N. (2022). Perspectives on strengthening local food
systems in small island developing states. Food Secu-
rity, 14(5):1227–1240.
Holding, S., Allen, D. M., Foster, S., Hsieh, A., Larocque,
I., Klassen, J., and Van Pelt, S. C. (2016). Ground-
water vulnerability on small islands. Nature Climate
Change, 6(12):1100–1103.
INSEE (2018). Les besoins en logements
`
a la r
´
eunion
`
a
l’horizon 2035. Technical report, INSEE La R
´
eunion-
Mayotte.
Kim, K., Burnett, K., and Ghimire, J. (2015). Assessing the
potential for food and energy self-sufficiency on the
island of kauai, hawaii. Food Policy, 54:44–51.
Lajoie, G. and Hagen-Zanker, A. (2007). La simulation de
l’
´
etalement urbain
`
a la r
´
eunion : apport de l’automate
cellulaire metronamica® pour la prospective territori-
ale. Cybergeo: European Journal of Geography.
Le M
´
ezo, L., Dupuy, S., and Gaetano, R. (2022). La
R
´
eunion - occupation du sol - carte 2021 (Spot6/7)
- 1.5m. CIRAD.
Lin, Y.-C., Lin, C.-C., Lee, M., Chiueh, P.-T., Lo, S.-L., and
Liou, M.-L. (2019). Comprehensive assessment of re-
gional food-energy-water nexus with GIS-based tool.
Resources, Conservation and Recycling, 151:104457.
Lotfi, A., Mohammadi-Ivatloo, B., and Asadi, S. (2020).
Introduction to FEW Nexus. In Asadi, S. and
Mohammadi-Ivatloo, B., editors, Food-Energy-Water
Nexus Resilience and Sustainable Development:
Decision-Making Methods, Planning, and Trade-Off
Analysis, pages 29–56. Springer International Pub-
lishing, Cham.
Makungwe, M., Chabala, L. M., Van Dijk, M., Chishala,
B. H., and Lark, R. M. (2021). Assessing land suit-
ability for rainfed paddy rice production in zambia.
Geoderma Regional, 27:e00438.
Nebey, A. H., Taye, B. Z., and Workineh, T. G. (2020). Site
Suitability Analysis of Solar PV Power Generation in
South Gondar, Amhara Region. Journal of Energy,
2020:1–15.
OER (2023a). Bilan
´
energ
´
etique de la r
´
eunion - chiffres cl
´
es
2022. Technical report, SPL Energies R
´
eunion.
OER (2023b). Consommation d’
´
electricit
´
e. Technical re-
port, SPL Energies R
´
eunion.
OER (2023c).
´
Energies renouvelables la r
´
eunion. Technical
report, SPL Energies R
´
eunion.
PEIGEO (2021). Parc national de la r
´
eunion 2021. http:
//41.213.202.31:8080/geonetwork/srv/api/records/PN
Run.
Rodr
´
ıguez-Urrego, D., Ca
˜
nadillas-Ramallo, D., Gonz
´
alez-
D
´
ıaz, B., and Guerrero-Lemus, R. (2022). Analysis of
the water-energy nexus applied to an insular system:
Case study of tenerife. Sustainability, 14(3):1653.
Russeil, V. (2023). Perspectives d’autonomisation
alimentaire-
´
electrique de l’
ˆ
ıle de La R
´
eunion : en-
seignements de la mod
´
elisation spatiale dynamique et
de l’anticipation participative. PhD thesis,
´
Ecole doc-
torale Sciences, Technologies et Sant
´
e (Saint-Denis,
La R
´
eunion).
Russeil, V., Lo Seen, D., Broust, F., Bonin, M., and
Praene, J.-P. (2023). Food and electricity self-
sufficiency trade-offs in reunion island: Modelling
land-use change scenarios with stakeholders. Land
Use Policy, 132:106784.
Samara, F., Tampekis, S., Sakellariou, S., and
Christopoulou, O. (2015). Sustainable indica-
tors for land use planning evaluation: The case of a
small greek island. Fresenius Environmental Bulletin,
24:652–655.
Teng, P. (2020). Assuring food security in singapore, a
small island state facing COVID-19. Food Security,
12(4):801–804.
Trainor, A. M., McDonald, R. I., and Fargione, J. (2016).
Energy sprawl is the largest driver of land use change
in united states. PLOS ONE, 11(9):e0162269.
Weir, T. and Kumar, M. (2020). Renewable energy can en-
hance resilience of small islands. Natural Hazards,
104(3):2719–2725.
World Bank Group (2020). Solar resource maps
of Reunion. https://solargis.com/maps-and-gis-
data/download/reunion.
A Water-Energy-Food Nexus Approach to Assess Land Use Trade-Offs in Small Islands
37

APPENDIX
Table 3: Constraints specifications for land use potential allocation per parcel in the Ocelet model.
Constraints Rice Urban PV Vegetables and fruits
Land use type
Scenario B
(Subsistence farming)
Agricultural
wastelands,
vegetable crops,
sugarcane
Agricultural
wastelands
Agricultural
wastelands,
sugarcane
Agricultural
wastelands,
sugarcane
Land use type
Scenario A
(Sugarcane conservation)
Agricultural
wastelands,
vegetable crops
Agricultural
wastelands
Agricultural
wastelands
Agricultural
wastelands
Minimal surface area
240 m
2
/ 3000 m
2
/
Maximal altitude
1200 m
/ / 1800 m
Maximal slope 10 % 30 % 10 % 30 %
Minimum water
requirements
300 mm / cycle
/ / 300 mm / year
Neighborhood distance
with urban parcels
/ 20 m / /
Table 4: Static optimization parameters.
Parameter Value References
Electricity production from hydropower in 2022 (GWh) 634.2 (OER, 2023a)
Electricity production from oil in 2022 (GWh) 1327 (OER, 2023a)
Electricity production from coal in 2022 (GWh) 581.1 (OER, 2023a)
Electricity production from PV in 2022 (GWh) 266.3 (OER, 2023a)
Electricity production from wind in 2022 (GWh) 3.489 (OER, 2023a)
Electricity production from local biomass in 2022 (GWh) 181.4 (OER, 2023a)
Electricity production from imported biomass in 2022 (GWh) 50.6 (OER, 2023a)
Domestic electricity production in 2022 (GWh) 1313 (OER, 2023b)
Non domestic electricity production in 2022 (GWh) 1507 (OER, 2023b)
Rice calories (kcal/kg) 2800 (FAO, 2001)
Vegetables calories (kcal/kg) 248.6 (CIRAD, 2021)
Fruits calories (kcal/kg) 570.9 (CIRAD, 2021)
Rice consumption (kg/household) 113 (AGRESTE, 2023)
Fruits consumption (kg/household) 120 (Chambre d’agriculture, 2023)
Vegetables consumption (kg/household) 153 (Chambre d’agriculture, 2023)
Urban extension area per new household (m
2
/household) 247 (AGORAH, 2016)
Ratio of tons of bagasse per ton of sugarcane (%) 0.30 (OER, 2023c)
Ratio of electricity production per ton of bagasse (GWh/t) 0.00047 (OER, 2023c)
Rice yield (ton/ha) [2.8, 3.3] Association Riz R
´
eunion
GISTAM 2024 - 10th International Conference on Geographical Information Systems Theory, Applications and Management
38
