
Revitalizing Walkability Scores: A New Assessment Based on
Accessibility
J. Bracquart
a
, T. Leduc
b
, V. Tourre
c
and M. Servi
`
eres
d
Nantes Universit
´
e, ENSA Nantes,
´
Ecole Centrale Nantes, CNRS, AAU-CRENAU, UMR 1563, F-44000 Nantes, France
Keywords:
Walkability, GIS, Accessibility.
Abstract:
Context/Purpose. With the motivation to evaluate the suitability of a urban environment for pedestrian mo-
bility, we revisit walkability scores from the scientific literature whose one of the most representative figure is
the Walk Score, which is also commercially exploited through an eponymous website. Methods. This study
refines the purpose of the foundations of walkability scores as a “pedestrian level of accessibility” score and
mobilizes works on accessibility to simplify the computations of the score. The parameter “importance of an
amenity” gains a more generic estimation method. Lastly, the scoring is proposed for different trip categories
before being aggregated into a global score. Results. We obtain a new scoring, which we apply to a small
town with a simple urban layout for illustration purposes before computing scores for a larger and more di-
verse area. The scores allow us to identify different urban fabrics associated with different opportunities within
walking distance. Conclusions. In the end, we provided walkability scores with a more scalable, explainable
and readable methodology which led to improve their usefulness.
1 INTRODUCTION
1.1 Context
We are experiencing an acceleration of global warm-
ing, the consequences of which are becoming life-
threatening for a growing part of the world’s popula-
tion (GIEC, 2023). Therefore, there is a growing in-
terest in rethinking our current car-oriented mobility
in favor of active forms of mobility such as walking
and cycling in order to meet Sustainable Development
Goal 11 of the United Nations
1
. Active mobility also
has great benefits for public health (Giles-Corti et al.,
2016), the economy (Santos et al., 2023) and the gen-
eral quality of life (Rosso et al., 2011).
We consider that the will to satisfy a need is the
first determinant of the adoption of a mobility, and a
necessary condition for the choice of pedestrian mo-
bility is access to a suitable offer within a “walking
distance”.
a
https://orcid.org/0009-0000-1633-6447
b
https://orcid.org/0000-0002-5728-9787
c
https://orcid.org/0000-0003-4401-9267
d
https://orcid.org/0000-0001-5749-1590
1
https://www.un.org/sustainabledevelopment/cities/
(accessed 11/2023)
Here, urbanism plays a key role in the distribution
of modes of transportation for mobility with the idea
that the “best mobility is no mobility”, as expressed
in concepts such as “15-minute cities” (Moreno et al.,
2021), where everyone has access to services they
need to live, within a 15-minute walk or bike ride
from their home. Additional mobility is then used for
leisure and not out of necessity.
1.2 Problematic
This “15-minute cities” concept hence relies on a di-
versity of amenities (places of employment, leisure,
shopping. . . ) accessible (in this article, we under-
stand this term to mean “reachable”) within a “walk-
ing distance” (a distance that people are willing to
walk such as in (Yang and Diez-Roux, 2012)) which
we therefore consider as the basis of a walkable envi-
ronment.
The study of walkable environments is what drives
our research. In the literature, works about walkabil-
ity try mainly to find out where people would actually
walk as exposed by the review (Hall and Ram, 2018).
And if the latter answer a key question about the suit-
ability of the urban environment for walking, the im-
pact of their conclusions would benefit from a more
scalable, explainable and readable methodology.
Bracquart, J., Leduc, T., Tourre, V. and Servières, M.
Revitalizing Walkability Scores: A New Assessment Based on Accessibility.
DOI: 10.5220/0012557500003696
Paper published under CC license (CC BY-NC-ND 4.0)
In Proceedings of the 10th International Conference on Geographical Information Systems Theory, Applications and Management (GISTAM 2024), pages 39-50
ISBN: 978-989-758-694-1; ISSN: 2184-500X
Proceedings Copyright © 2024 by SCITEPRESS – Science and Technology Publications, Lda.
39

Elements for this improved methodology can be
found in the field of research on “accessibility” to
amenities. Some studies such as (Gastner and New-
man, 2006) or (Xu et al., 2020), for example, attempt
to optimize the positioning and quantity of ameni-
ties in a geographic area to suit as many people as
possible, while other summarize the variety of ser-
vices available to everyone in an “accessibility score”
(Nicoletti et al., 2023).
Therefore, we are motivated to develop a tool to
assess the efficiency of the urban layout in terms of
the available amenities so as to promote pedestrian
mobility. In this study, we will answer the follow-
ing question: “How can we evaluate, at the level of a
whole city and with street segments as spatial units,
the degree of pedestrian accessibility achieved by the
Points of Interest (POIs), according to the opportuni-
ties they offer and their location in the urban plan?”.
1.3 Content of this Work
This work aims to revisit the foundations of walkabil-
ity scores by focusing on the degree of accessibility
offered by amenities, assuming that the decision to
make a journey on foot begins with the ability to meet
one’s needs within a walkable distance.
Building on accessibility studies, we will refor-
mulate the purpose of the Walk Score as “Pedestrian
Level of Accessibility Score” and simplify the calcu-
lation by keeping only two parameters: the distance
to the surrounding “amenities” and their relative “im-
portance” within the mix of amenities. This second
parameter, the “importance of an amenity”, will ben-
efit from a more general estimation method. Finally,
we will categorize the trips to calculate a score per
category of trips as a complement to a global walka-
bility score.
2 STATE OF THE ART
2.1 Brief History of the Walk Score
(Hall and Ram, 2018) shows that the Walk Score is
a reference tool to summarize the available amenities
and city layout. From its original publication as the
Walkability Index, what is now known as the Walk
Score has evolved through various iterations, which
we report on here.
2.1.1 Walkability Index
Among the tools to assess the walkability of cities,
“Walkability Index” is a reference developed by
(Frank et al., 2005). It is based on the recognized
framework of the 5Ds (density, diversity, design, dis-
tance to transit and destination accessibility), which
provides a methodology to assess the characteristics
of a built environment that promote walking (Ewing
and Cervero, 2010).
The index is calculated as a combination of four
geographic variables: net residential density, intersec-
tion density, land use mix, and the ratio of retail space
to floor area (as a later addition).
Each of the variables is weighted based on soci-
ological and demographic studies. Originally devel-
oped to estimate where people actually walk, the sys-
tem has since been widely used and studied (Hall and
Ram, 2018).
2.1.2 Walk Score
This index was later transformed into a “Walk Score”
used on a commercial website
2
with some variations
to inform the public about the attractiveness of a
neighborhood in terms of available amenities.
(Frank et al., 2021) reports some parts of the
methodology used (some details are protected by
copyright and are withheld from the public): the Walk
Score is calculated by evaluating the straight-line dis-
tance from a starting point to the nearest destinations
in nine different categories, including grocery stores,
restaurants, general stores, coffee shops, banks, parks,
schools, bookstores, and entertainment venues. For
all categories except restaurants (where ten are con-
sidered), cafes (where two are considered) and stores
(where five are considered), only the closest destina-
tion is considered. This adjustment takes into account
the increased attractiveness of several nearby comple-
mentary amenities. The distances are then converted
into amenity scores on a scale of 0-100 using a poly-
nomial distance decay function. These amenity scores
are weighted based on research findings and then ag-
gregated to obtain the final walk score, which is also
on a 0-100 scale. Finally, a 0-5% deduction is made
that takes into account the average block length and
intersection density within a 1.5 mile radius of the
starting point.
2.1.3 Street Smart Walk Score
The methodology of the “Walk Score” was later re-
vised into a “Street Smart Walk Score” by the origi-
nal authors of the “Walkability Index” (Frank et al.,
2021), whereby the Walk Score was assessed from an
address primarily using distances based on the street
2
https://www.walkscore.com/methodology.shtml
(accessed 11/2023)
GISTAM 2024 - 10th International Conference on Geographical Information Systems Theory, Applications and Management
40

network and the function of decay with distance was
adapted to different categories of amenity.
2.2 Other Works of Interest
2.2.1 Accessibility
Originally, (Hansen, 1959) defined accessibility as
a distance-weighted property of a Point of Interest
(POI). More generally, accessibility measures travel
costs and the quality/quantity of opportunities, as
shown in the review (P
´
aez et al., 2012). Accessibil-
ity can therefore be measured from a population per-
spective (e.g. the availability of services) or from a
destination perspective (e.g. the catchment area).
(Nicoletti et al., 2023) classifies Points of Interest
into seven categories inspired by Maslow’s hierarchy
of needs (Maslow, 1943). Then, the closest point of
interest in each category is considered to assess ac-
cessibility in each road segment. The final score is
calculated as an aggregation of distances, with the im-
portance of the categories being weighted by a panel
of experts.
2.2.2 Studies Regarding Walkability Scores
(Zhao et al., 2021) shows that it is important to con-
sider the pedestrian network instead of the road net-
work in the analysis, especially for Asian cities. Re-
garding the incentive of amenities to walk, the article
sorts the amenities into ten categories (an 11
th
gives
a “mixing index”) and applies a decay by network-
based distance but also by the number of amenity
units to account for redundancy. In their work, the
authors want to adapt the algorithm for densely popu-
lated Hong Kong.
(Gorrini et al., 2021) evaluates the degree of walk-
ability based on four criteria: accessibility, comfort,
safety and attractiveness, whose values are normal-
ized, distributed in deciles and summarized in a final
score.
(Lam et al., 2022) applies the Walk Score al-
gorithm with the additional parameters of “green-
ery” and “proximity to public transport” to the entire
Netherlands and compares the results with those of
a national study on mobility, in which some correla-
tions were found.
2.2.3 About a Walkable Distance
In studies of walkability, the question arises as to the
distance that is to be considered “walkable” and can
serve as a reference for the evaluation of a “degrada-
tion with increasing distance”’ in the convenience of
an amenity. (Yang and Diez-Roux, 2012) reports from
a 2009 survey of 300,000 people in the USA who had
walked a total of more than a million trips, that the
mean and median distances walking were 0.7 and 0.5
miles (or 1.13 and 0.80 kilometers) respectively.
2.3 Comments
2.3.1 Purpose of the Index
As for the original purpose of the index, various ef-
forts have been made to find a correlation between
the calculated values and actual pedestrian activity on
the streets, but as noted in the review (Hall and Ram,
2018), the scoring system is best suited to assess the
quality of a built environment in terms of connectiv-
ity and the distribution of amenities. For example,
the tool does not take into account the sociological
and environmental factors that are part of the decision
process to walk.
2.3.2 Choice of Parameters
We assume that the parameters “connectivity” and
“block length” in the Walk Score formula are intended
to capture psychological motivations and deterrents
to walking caused by the urban environment, as de-
scribed by (Lynch, 1960) in “The Image of the City”.
Ultimately, however, these parameters appear to
serve as a calibration of the formula to extrapolate
the calculation of the score from a limited sample of
surveyed people. As a result, the index/score loses
in scalability as it relies on surveys with specific
and limited spatial coverage, and furthermore it loses
explainability as the formula becomes increasingly
complex with parameters that are not so simple and
meaningful. Furthermore, as already mentioned, the
intended purpose of predicting walkability is not fully
achieved.
This also applies to the idea of adjusting the de-
crease in importance of a POI with increasing dis-
tance by a formula adapted to different categories of
facilities: to refine the index/score so that it matches
the observed walks, it again loses scalability and ex-
plainability.
2.3.3 Importance of the Amenities
The Walk Score and other studies such as (Su et al.,
2017) rely on surveys to assess the importance of
amenities, which has several limitations, it is not ex-
haustive in terms of the variety of amenities, it re-
quires some resources to conduct the survey at a suf-
ficient scale and it does not necessarily translate well
to other populations and locations (limitations in scal-
ability mentioned earlier).
Revitalizing Walkability Scores: A New Assessment Based on Accessibility
41
2.3.4 Exposing the Results
The various studies that use the Walk Score such as
(Gorrini et al., 2021) and (Lam et al., 2022) or one of
its variations, often end up with an index/score ren-
dered on surfaces, while we want to evaluate the walk-
ability of paths. With the move to network-based dis-
tances to amenities, it even seems like a missed oppor-
tunity to not render the scores directly on the paths.
Finally, this reduces the readability of the index.
2.3.5 Accessibility
The works on accessibility mobilize intuitive and
therefore more explainable methods. They must be
tailored to the study of walkability and take into ac-
count the largest possible range of amenities that
specifically induce pedestrian mobility. Estimation of
the importance of amenities also exhibits significant
variations between studies, usually with limited cov-
erage on the diversity of amenities.
3 PROPOSED INDEX
3.1 Purpose of the Score
First, we propose clarifying the purpose of the index
by pursuing the objective of evaluating “pedestrian
accessibility”, which reflects the efficiency of the ur-
ban layout. We do not intend to explain the observed
walking behavior. From the point of view of the ur-
ban planner, the question answered by the scoring can
be formulated as follows: “how well equipped is a
particular street in terms of facilities within walking
distance and their respective distance”. From the cit-
izens’ point of view, it gives a “convenience of living
somewhere” independently of an external means of
transportation. The point here is to ask a more direct,
easy-to-answer question. So we hope to gain in ex-
plainability. In the following, we will refer to our
score as “pedestrian level of accessibility score” in-
stead of “walkability score” to reflect this adaptation
of purpose.
Our index is computed in respect of the following hy-
potheses:
• we consider statistically averaged persons in
terms of physical abilities and needs
• all street segments are of the same perceived qual-
ity (street width, vegetation, etc.) and the altime-
try is not considered
• all amenities in a category are of the same quality
• we consider mobilities at daytime on an averaged
day
3.2 Simplification of the Score
Calculation
Our walkability index has its roots in the approach
used in accessibility studies such as those conducted
by (P
´
aez et al., 2012). To align with this approach,
we simplify the calculation of the walkability score
keeping only two parameters: a decay with increasing
distance to amenities and their relative importance in
the mix of amenities.
Score =
amenities
∑
k=0
Decay(dist
k
) × Importance
k
(1)
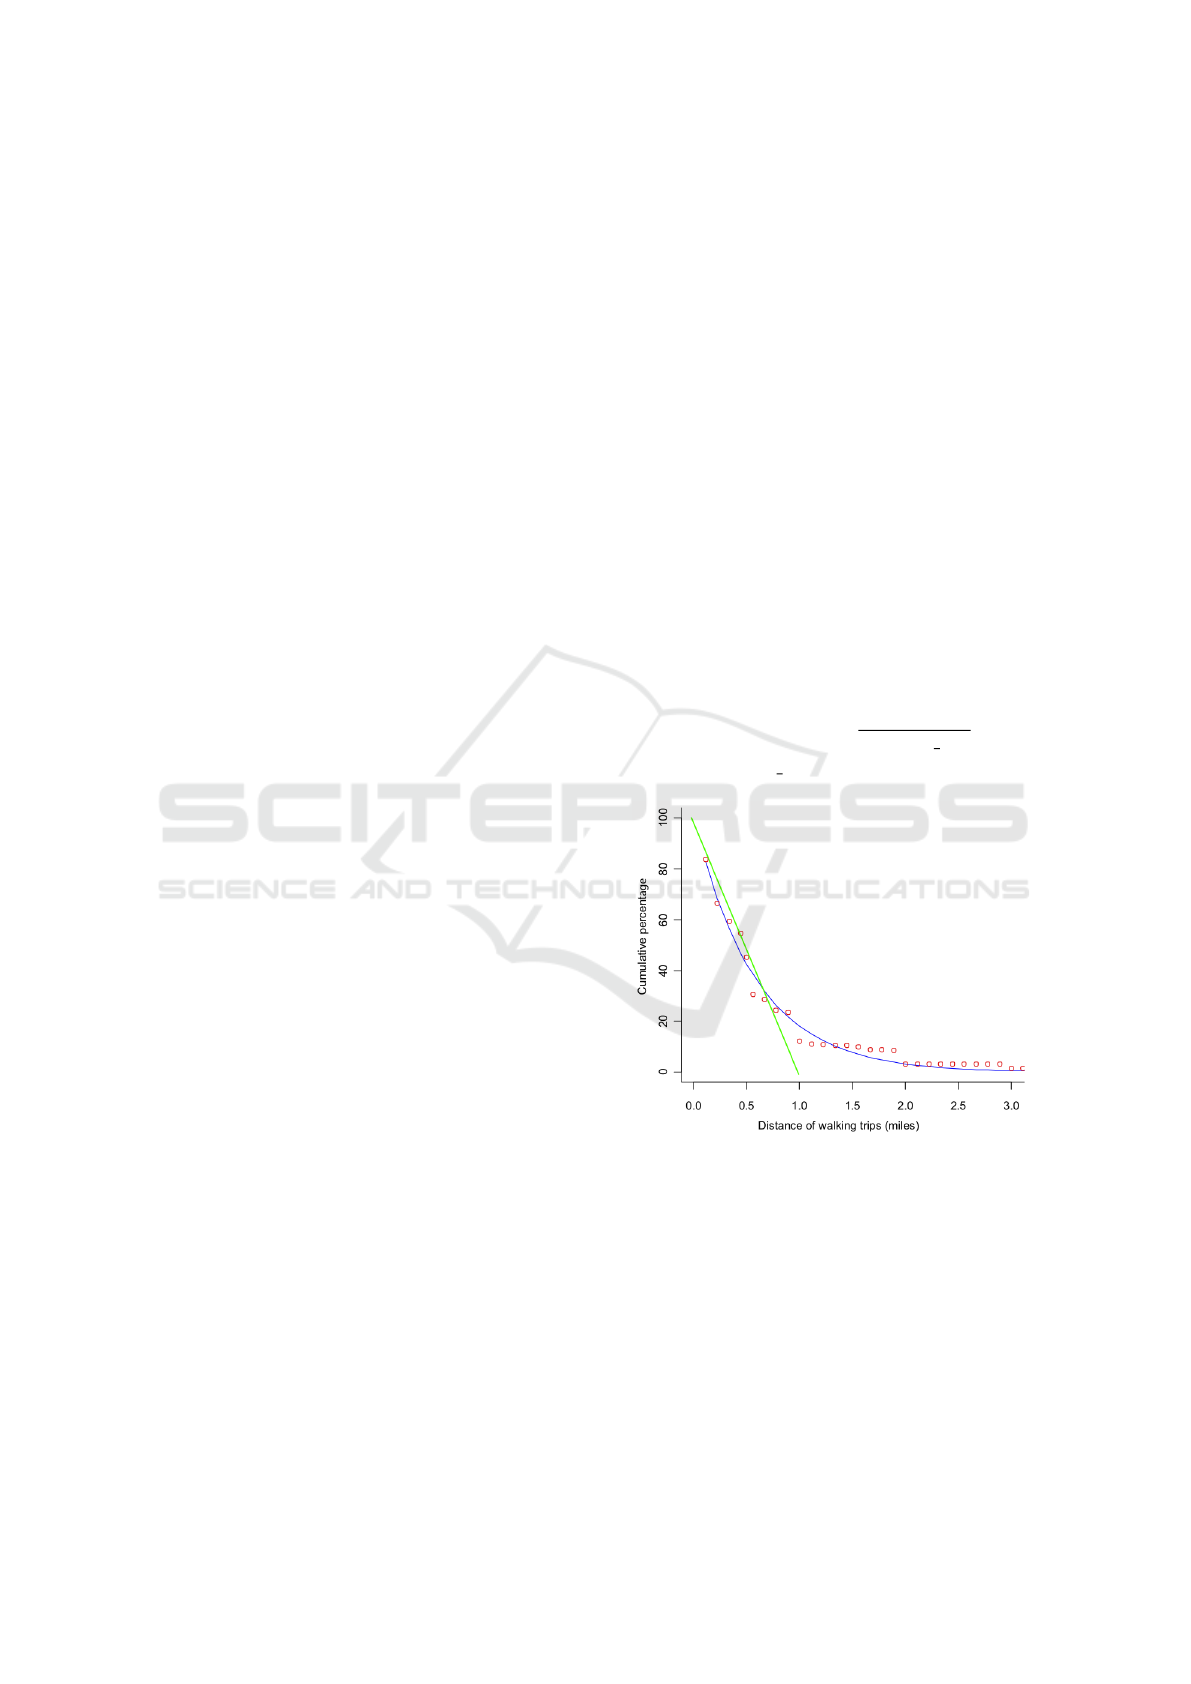
This decay function is taken strictly linear (see the
green line on figure 1) and not specific to a given cat-
egory of amenity to gain in explainability. Addition-
ally, in our study, the distance itself is evaluated using
the network of streets as in the latest iteration from
(Frank et al., 2021) which improves precision in com-
parison to using distances along straight lines.
Decay(dist) = 1.0 −
dist
walkable dist
(2)
if dist ≤ walkable dist, else Decay(dist) = 0.0
Figure 1: Cumulative percentages of walking trips by dis-
tance, red dots are from a survey, blue line is an interpola-
tion and green line is our simplification as a linear regres-
sion which captures about 80% of the cumulative percent-
ages of walking trips by distance (adapted from (Yang and
Diez-Roux, 2012)).
3.3 New Method to Estimate the
Parameter “Importance of an
Amenity”
Every day, all the people in an area set out to satisfy
their needs. Given a sufficiently large and contiguous
GISTAM 2024 - 10th International Conference on Geographical Information Systems Theory, Applications and Management
42

geographic urban area, we can even approximately as-
sume that all amenities satisfy all needs of the popula-
tion (daily trips in and out of the area become anecdo-
tal). We can therefore assume that an amenity satisfies
the needs of the population on average up to its daily
attendance (as a number of persons) and we propose
to consider this as the importance of the amenity.
It should be noted that considering a large area
also allows for statistical averaging and helps to elim-
inate a number of considerations relating to the in-
habitants on the one hand (age, gender, socio-cultural
background, individual sensitivities, skills. . . ) and the
amenities on the other hand (quality, individual eco-
nomic issues, particular type of business. . . ).
This method of evaluation has the advantage of
being universal (all amenities are visited) and objec-
tive (it can be measured). We know that this data can
be found (Google Maps offers hourly attendance as a
tip, e.g. “more or less frequented than usual”). How-
ever, for our study we were unable to gather sufficient
data, so we initially estimated this parameter of daily
attendance using assumptions. In terms of a com-
mercial application, there would be a simple method
to accurately determine the importance of each POI
without relying on a survey that is limited in its geo-
graphical coverage and in the variety of facilities con-
sidered.
3.4 Computation of Scores per Trip
Category and Their Synthesis
To make our index more useful, we compute scores
for different trip categories defined in the general sur-
vey on mobilities (INSEE, 2010) to which we can as-
sociate various amenities.
Trips categories and their related amenities:
• “groceries and shopping”: shopping centers,
malls, downtown shops. . .
• “work”: places of employment
• “leisure”: sport centers, restaurants, coffee shops,
cultural places, entertainment venues. . .
• “studies”: any educational establishment from el-
ementary school to universities
• “administrative and healthcare”: public adminis-
trations, hospitals. . .
• “visits”: friends and parents to visit
Relying on open databases, we managed to gather
a quite exhaustive list of the geolocalized amenities to
represent the trip categories (see data sources in sec-
tion 4.4.1). We interpreted the category “visits” as
the potential for a social life proportional to the pop-
ulation localized at a walking distance (as we con-
sider averaged persons in an averaged city). Looking
for the number of inhabitants per street, we catego-
rize the building footprints according to the land use
(see figure 2) and associated a number of inhabitants
to each: 3 for “habitations low density”, and a value
proportional to the building’s height and its floor area
for “habitations medium density” or “city center”. In
the end, we make the assumption that each building
becomes an attractor in proportion to the number of
inhabitants occupying it.
The scores per trip category are then combined by
a weighted sum to a “global score” using each cat-
egory’s share in the repartition of trips (see table 1)
as the weighting that we find in the aforementioned
survey (INSEE, 2010).
Score =
categories
∑
k=0
category score
k
× weight
k
(3)
3.5 Exposing the Results
In order to improve both readability and explainabil-
ity, the not null scores computed for our large geo-
graphic area were divided into quintiles for each trip
category (e.g. the 1/5 of the highest scores in trip cat-
egory “work” on all road sections form the first quin-
tile for this category). This distribution can then be
used as a normalization for the scores in different ge-
ographical areas, allowing comparative analysis.
The resulting scores are rendered on the network
of streets whose walkability is being estimated. This
should improve readability.
It is also informative to display a score per cate-
gory of trips as well as the combined score described
in 3.4.
It should be noted that the color scale is adapted
from the European energy label for household appli-
ances, which is already familiar to the general public.
4 IMPLEMENTATION
4.1 Computational Methods
Inspired by methods from numerical simulations we
turn the equation (1) used to evaluate the scores for a
trip category, into the following computation:
S = A × b (4)
with A a square matrix of the decays in im-
portance related to the distances from every streets
segments to every streets segments, S the unknown
scores and b the vector of the importance of the
Revitalizing Walkability Scores: A New Assessment Based on Accessibility
43

amenities for a trip category associated to their clos-
est street segment. A is very sparse as decay is zero
above the reference walkable distance between two
street segments.
This way, the computational cost relies almost en-
tirely on the construction of the matrix A and allows
to evaluate the level of opportunity offered by almost
any number of amenities to almost no further compu-
tational cost.
4.2 Algorithmic Translation of the
Index
The main steps for the computation of the score are:
• conversion from a pedestrian network of streets
describing the city to a topology of streets seg-
ments (list of neighbors)
• computation of the matrix A reporting the decay
with distance coefficients using equation (2) and
taking the network based distance between each
pair of streets considered
• each amenity is classified in a trip category
• each amenity is given an importance (see 3.3)
• projection of the amenities onto the geometrically
closest street segments (to construct vector b)
• computation of the product S = A × b (equation
(4)) for each trip category
• normalization of the scores per quintiles against
the scores at a metropolitan scale
• rendering of the score on the streets network for
each trip category
• combination of the scores to get one final “pedes-
trian level of accessibility” score
• rendering of the final score on the streets network
4.3 Softwares Involved
The method has been implemented in Python code
with GIS algorithms from GeoPandas (Jordahl et al.,
2020). The construction of matrix A has been thor-
oughly optimized by leveraging SciPy’s (Virtanen
et al., 2020) sparse matrices and NumPy’s (Harris
et al., 2020) high-performance C-based operations.
The renders are performed with Folium (python-
visualization, 2020).
4.4 Data Sources
4.4.1 Geographic Data
The street network used in the study (and curated
to keep only the pedestrian network) originates from
the IGN
3
(French National Institute of Geographic
and Forest Information). The amenities are ex-
tracted from Open Street Map
4
for categories “gro-
ceries and shopping”, “leisure”, “studies”, “admin-
istrative/healthcare”, from the SIRENE database
5
for
category “work” and from the IGN for category “vis-
its”.
4.4.2 Sociologic Data
The sociologic elements from this study comes from
the INSEE
6
(National Institute of Statistics and Eco-
nomic Studies) which is a public institution attached
to the French Minister of the Economy, Finance and
Industrial and Digital Sovereignty. Its mission is to
collect, analyze, and disseminate information about
the French economy and society throughout its entire
territory.
5 RESULTS
5.1 Description of the Case Study
We will first illustrate the proposed scoring system
computing scores for the town of Sautron
7
(French
city with 8,473 inhabitants in 2020) which has a rela-
tively simple urban layout.
The city is organized around a central street, a
small city center and some sports facilities on the
western side. The town hall of Nantes is located to the
southeast, about eleven kilometers away. Sautron is
surrounded by an industrial area (to the east), a high-
way to the south and some vegetation (both agricul-
tural and natural) to the north and west sides.
We will then apply our scoring on the vaster
and more heterogeneous metropolitan area of Nantes
M
´
etropole (French city of Nantes with suburbs,
665,204 inhabitants in 2019
8
).
Nantes M
´
etropole consists of a historic center lo-
cated in the middle of a ring road (see figure 2). It
is divided horizontally by the Loire River, which cuts
out a large island below the city center. The area is
divided into twenty-four municipalities, with Nantes
being the most important.
3
https://geoservices.ign.fr/bdtopo (edition 2023-06-15)
4
http://download.openstreetmap.fr/ (accessed 11/2023)
5
https://www.sirene.fr (accessed 11/2023)
6
https://www.insee.fr (accessed 11/2023)
7
https://fr.wikipedia.org/wiki/Sautron (accessed
11/2023)
8
https://fr.wikipedia.org/wiki/Nantes Metropole (ac-
cessed 11/2023)
GISTAM 2024 - 10th International Conference on Geographical Information Systems Theory, Applications and Management
44

Figure 2: General map of Nantes M
´
etropole and location of
Sautron in the northwest.
We take Nantes M
´
etropole as our “large area of
reference”.
The distribution of trips per purpose discussed in
section 3.4 is taken from the generic survey on mobil-
ity (INSEE, 2010):
Table 1: Distribution of trips according to their purpose for
Nantes M
´
etropole (INSEE, 2010).
Purpose Weekday Saturday Sunday
Groceries and shopping 20% 35% 10%
Work regular place 19% 4% 1%
Leisure 16% 24% 23%
Studies 12% 4% 0%
Visits 10% 17% 12%
Administrative and healthcare 6% 3% 4%
Other 17% 13% 50%
Then, the weight for trip purpose k and for an av-
eraged day is:
w
k
=
5
7
× w
weekday
+
1
7
× (w
saturday
+ w
sunday
) (5)
These statistics are obtained with the following
methodology:
• a trip is defined as a displacement from a destina-
tion to another, a new trip is registered each time
a purpose is achieved
• return trips are not considered
• respondents are six years old and above
Regarding the reference walkable distance (see 2.2.3),
for our investigation, we consider a value of 1.0 miles
(1.6 kilometers) for the whole round trip according
to the green line on the figure 1: at 400 meters the
importance of an amenity is divided by two and at
800 meters (1600/2) it becomes null.
5.2 Results for Sautron
5.2.1 Scores per Trip Categories
We apply our algorithm to the city of Sautron and
obtain the values for pedestrian accessibility scores
showed in the figure 3.
(a) Work: we see that most of the work offers comes
from the industrial zone on the east as well as the in-
stitutions of the city center and the shops on the main
pathway
(b) Shopping / Groceries: most of the shopping of-
fers is situated near the central road
(c) Leisure: there are many sports facilities and an
entertainment venue at the west of the city center
(d) Health / Institutions: most of the institutions take
place around the city hall at the city center
(e) Studies: the schools are mainly located at the city
center in Sautron
(f) Visits: most of the population is concentrated
around the central road and city center with the den-
sity getting lower further away
Satellite imagery as well as local cartography al-
ready provided this kind of information, so the added
value here comes from the synthesis as well as the dis-
play of the geographic scope of the service provided
by the amenities.
We also gain a comparison with Nantes M
´
etropole
against which the scores were normalized. In most
categories, the scores experience a quick decay with
the increasing distance as the amenities are in a low
number and quite concentrated.
5.2.2 Global Score
We combine the scores from the different categories
into one global “pedestrian level of accessibility
score” using, as weights, the distribution of trips from
(INSEE, 2010) described previously (see 5.1). We get
figure 4.
For Sautron, as the best score “A” is essentially
absent, we can say that its city center is not as
well provided with amenities as the center of Nantes
M
´
etropole and that’s why the city benefits from good
public transportation to the latter. People living in
streets ranking “C” can carry out some activities on
foot but will probably appreciate using a bicycle to
gain better access to the whole mix of Sautron’s
amenities. In comparison, the population on the
streets ranking “D” and “E” have an increased de-
pendency on motorized vehicles (which will be con-
firmed analyzing Nantes M
´
etropole in the next para-
graph, these two scores being quite bad).
5.3 Results for Nantes M
´
etropole
Nantes M
´
etropole is a more heterogeneous territory
than Sautron, composed of a variety of urban environ-
ments ranging from a dense historic center to small
communities and interurban places. Nature, with its
Revitalizing Walkability Scores: A New Assessment Based on Accessibility
45
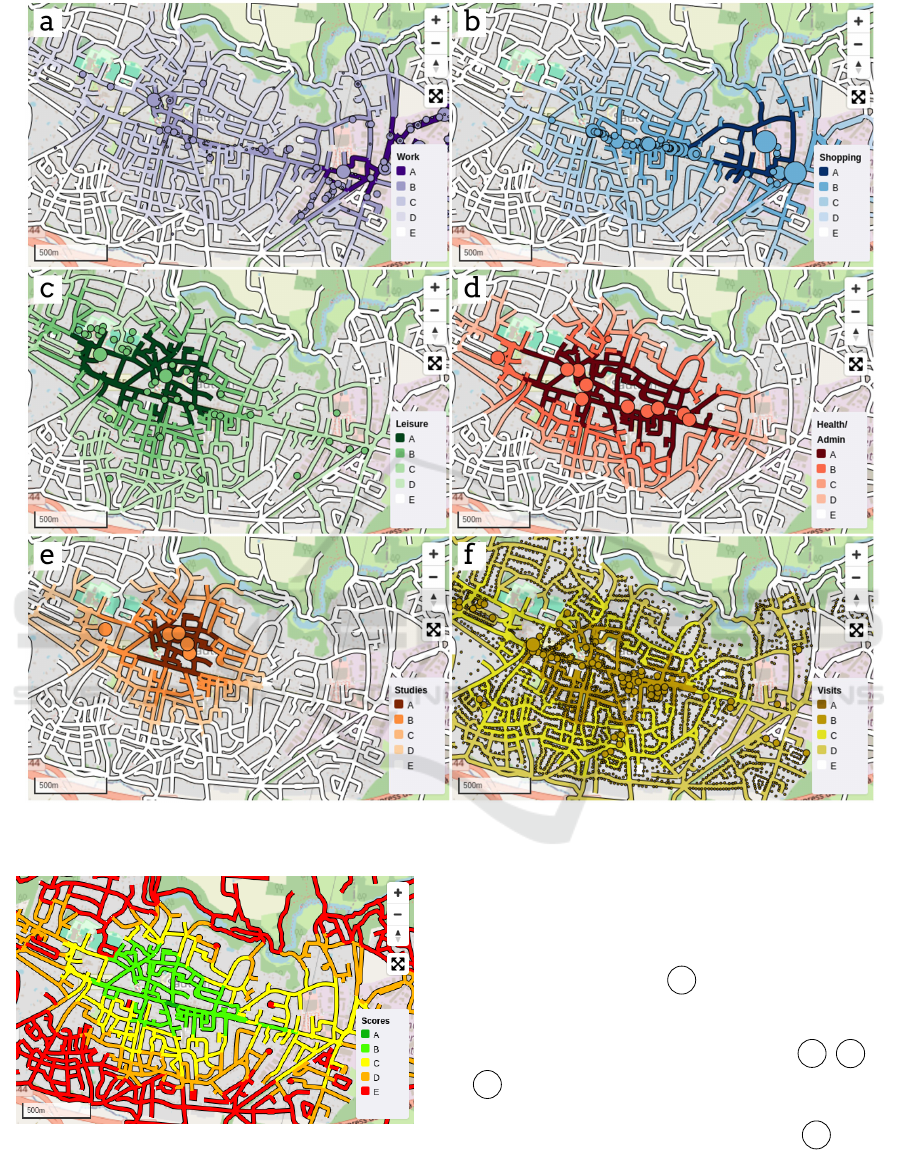
Figure 3: Scores and amenities (size related to importance) associated to work (a), shopping (b), leisure (c),
health/administration (d), studies (e) and visits (f) normalized over the results on Nantes M
´
etropole.
Figure 4: Global pedestrian level of accessibility score for
Sautron.
parks and rivers, and industrial areas also characterize
the area.
We evaluate the scores from the different cate-
gories of amenities as well as the overall rating on
Nantes M
´
etropole. For the sake of brevity, we only
report on the latter here (see figure 5).
Rank A: the city center 1 unsurprisingly yields ex-
cellent scores ranking A in every trip categories with
amenities in over abundance to serve also the neigh-
boring districts and municipalities. With 2 , 3 and
4 we identify secondary centers, and most notably
their geographic extent, which are also well equipped
with amenities in all categories. Also, 4 encom-
passes the biggest building of Nantes M
´
etropole (Sil-
lon de Bretagne, about 2,500 inhabitants) which is lo-
cated close to an industrial busy road/area with jobs
and shopping offerings. It should be noted that the
GISTAM 2024 - 10th International Conference on Geographical Information Systems Theory, Applications and Management
46
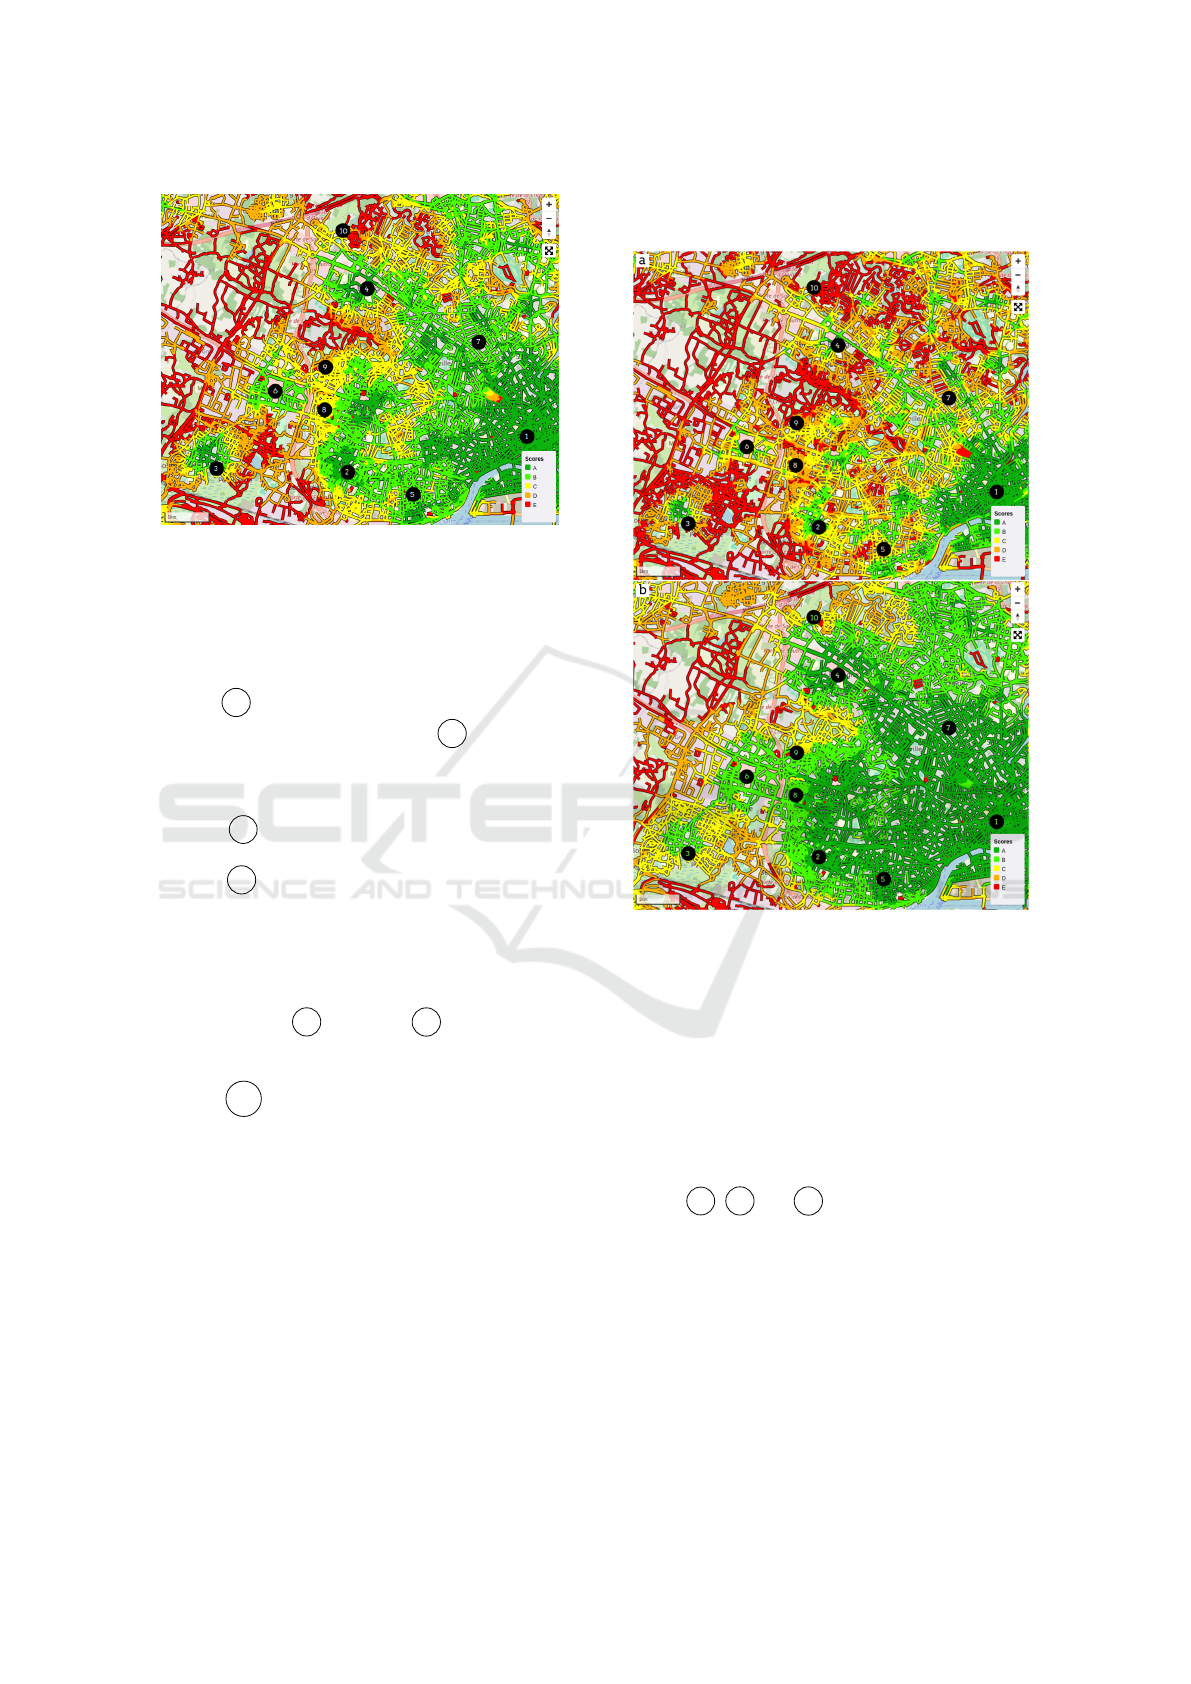
Figure 5: Zoom on the scores on the western districts of
Nantes M
´
etropole obtained for a round trip walkable dis-
tance of 1.6 kilometers.
good ranking fails to report that the area is quite un-
pleasant to reach on foot, as it is mainly designed for
car-oriented mobility.
Rank B: 5 has slightly fewer offers in shopping and
employment than the city centers, 6 is an indus-
trial area that is hardly inhabited but offers employ-
ments and shopping opportunities for people willing
to come with motorized means of transport. Last with
this rank, 7 only maintains a good score due to its
proximity to two large and well-provided avenues.
Rank C: 8 is a residential area which gets a good
employment rating from the industrial zone nearby,
however it quite fails to answer the needs of its in-
habitants in all the other categories. A good opening
towards the better equipped east prevents it from get-
ting a worse notation.
Rank D: as with 8 , the place 9 lacks service in
most amenity categories and is further convoluted, re-
ducing access to better equipped places.
Rank E: 10 offers a place with poor access to any
amenities and additionally with rather convoluted ac-
cess. Its inhabitants are probably quite dependent on
cars for their mobility.
5.4 Sensitivity Analysis of the Decay
Function
The decay function described in section 3.2, reports
on the decrease in opportunities offered by an amenity
as the distance to it increases.
It depends on a walkable distance (see 2.2.3) that
we chose at 1.6 kilometers (total round trip) for our
case study (see 5.1). In order to characterize the sensi-
tivity of this walkable distance, we compute our scor-
ing with a value decreased by 50% to 0.8 kilometers
and increased by 100% to 3.2 kilometers.
Figure 6: Zoom on the scores on the western districts of
Nantes M
´
etropole obtained for a round trip walkable dis-
tance of 0.8 kilometers (a) and 3.2 kilometers (b).
The result for the western districts of Nantes
M
´
etropole is exposed on figure 6 to be compared with
figure 5.
Regarding the decreased walkable distance (fig-
ure 6.a) we observe that only the places well furnished
with amenities keep a good score, while those that
mainly benefited by well provided nearby places get
well degraded scores. As such, the residential only
districts 7 , 8 and 9 have their scores devalued,
while well-provided environments get some credits.
Indeed, with this analyze, the local environment gains
a greater importance and we can say that this choice
of walkable distance would better reflect the mobil-
ity of senior people who are known to walk smaller
distances.
About the increased walkable distance (figure 6.b)
most of the places considered get an improved score
compared with round trip walkable distance of 1.6
kilometers as they benefit from the proximity with the
Revitalizing Walkability Scores: A New Assessment Based on Accessibility
47
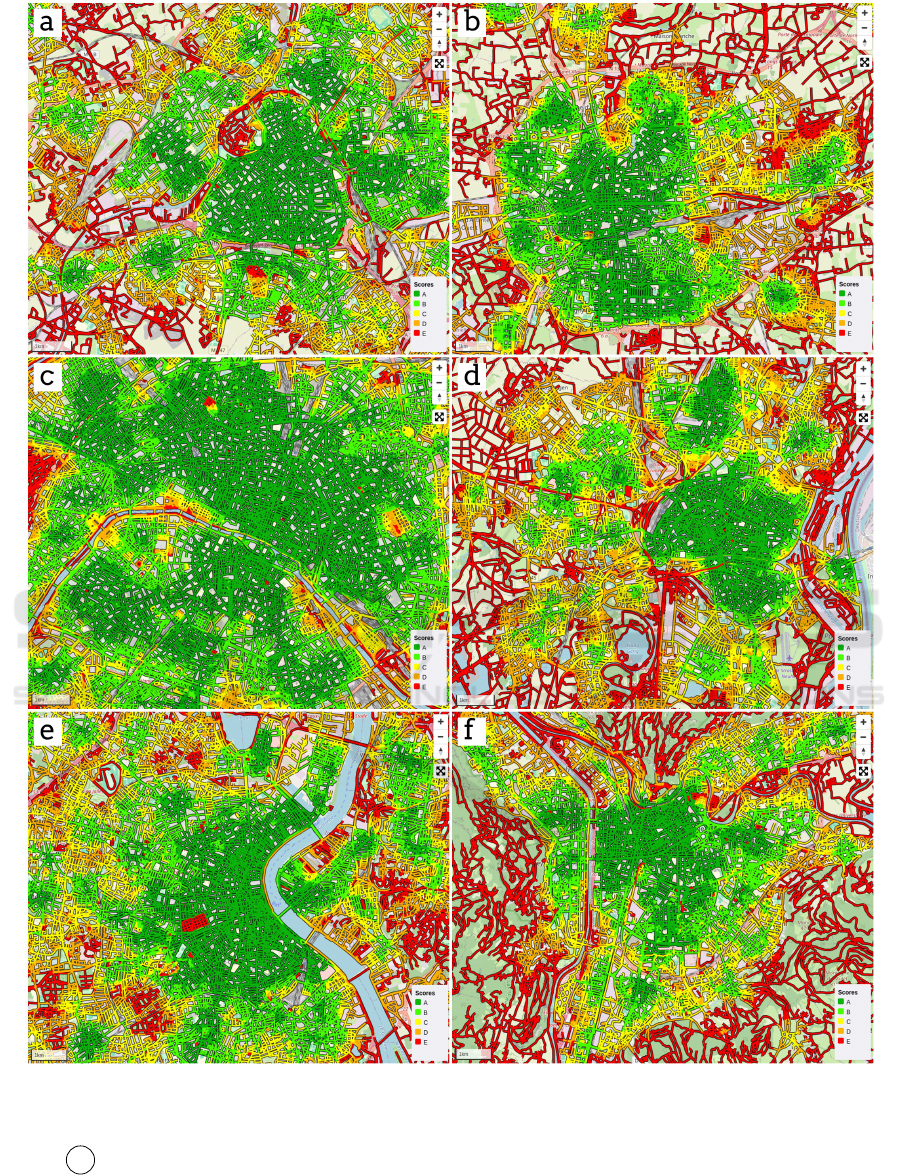
Figure 7: Scores on various French cities: Lille (a), Rennes (b), Paris (c), Strasbourg (d), Bordeaux (e) and Grenoble (f).
center of Nantes M
´
etropole. However, some places,
such as 3 get a degraded score. This is because the
normalization process described in section 3.5 leads
to an equal number of streets (with not null scores) in
each rank for the whole Nantes M
´
etropole.
5.5 Scalability
To demonstrate good scalability of the method, we
compute the scores for six other French metropolitan
areas on the figure 7.
GISTAM 2024 - 10th International Conference on Geographical Information Systems Theory, Applications and Management
48

In this figure, the distribution of scores into quin-
tiles is done independently for each city, which pre-
vents the comparison of absolute scores. However,
we could select one city against which the others are
normalized to allow such a comparison.
A similar figure could be generated to display the
scores for each category with the associated ameni-
ties. Also, we provide the map to the general public
through a website
9
.
6 DISCUSSION AND
CONCLUSION
In our study dedicated to walkability scores, we de-
fined a more direct and easy-to-answer question than
the usual literature (Hall and Ram, 2018) to gain
in explainability. With the same prospect, we also
chose to consider statistically averaged persons in an
averaged city built of averaged streets and amenities.
Revisiting these hypotheses make for as many oppor-
tunities of future studies. Again for explainability,
we simplified the score calculation taking inspiration
from works on accessibility to amenities. Also, for
scalability, we revised the method to estimate the pa-
rameter “importance of an amenity” to a more uni-
versal and objective approach distinct from the ap-
proaches in the literature which are mainly based on
surveys (Su et al., 2017). The surveys have the ad-
vantage of being quite precise in their conclusions but
they are also quite limited in their geographic cov-
erage and in the diversity of amenities considered.
Unfortunately, with our limited time and resources,
we ended up estimating the parameter with assump-
tions, however as mentioned, the data exists and it
should be possible to acquire it for a commercial ap-
plication. The statistical and geographic data for our
case study otherwise come from very generic sources
which should allow to easily apply the scoring to at
least the whole French territory. We evaluated scores
for different trip categories (for usefulness) and per-
formed their combination into a final score. The ren-
dering of the computed scores was also worked out
for readability which offers finer details compared to
scores aggregated on surfaces in (Gorrini et al., 2021)
or (Lam et al., 2022). In the end, we discussed here
only one aspect of the question “where do people ac-
tually walk” behind walkability scores. Our purpose
was indeed to lay a more robust foundation to those
scores, considering that the accessibility to amenities
is the starting point of any mobility.
Additionally, for future developments, we are go-
9
https://villes-marchables.huma-num.fr
ing to interview urban planners so as to refine the use-
fulness of our scoring and help them make more in-
formed decisions.
ACKNOWLEDGEMENTS
The authors thanks the French Ministry of Higher Ed-
ucation and Research for the financial support of this
project.
REFERENCES
Ewing, R. and Cervero, R. (2010). Travel and the Built
Environment: A Meta-Analysis. Journal of the Amer-
ican Planning Association, 76(3):265–294.
Frank, L. D., Appleyard, B. S., Ulmer, J. M., Chapman,
J. E., and Fox, E. H. (2021). Comparing walkability
methods: Creation of street smart walk score and ef-
ficacy of a code-based 3D walkability index. Journal
of Transport & Health, 21:101005.
Frank, L. D., Schmid, T. L., Sallis, J. F., Chapman, J.,
and Saelens, B. E. (2005). Linking objectively mea-
sured physical activity with objectively measured ur-
ban form: Findings from SMARTRAQ. American
Journal of Preventive Medicine, 28(2):117–125.
Gastner, M. and Newman, M. (2006). Optimal design of
spatial distribution networks. Physical review. E, Sta-
tistical, nonlinear, and soft matter physics, 74:016117.
GIEC (2023). Synthesis report of the IPCC sixth assessment
report (AR6).
Giles-Corti, B., Vernez-Moudon, A., Reis, R., Turrell, G.,
Dannenberg, A. L., Badland, H., Foster, S., Lowe, M.,
Sallis, J. F., Stevenson, M., and Owen, N. (2016). City
planning and population health: A global challenge.
Lancet (London, England), 388(10062):2912–2924.
Gorrini, A., Presicce, D., Choubassi, R., and Sener, I. N.
(2021). Assessing the Level of Walkability for Women
Using GIS and Location-based Open Data: The Case
of New York City. Findings, (2019).
Hall, C. M. and Ram, Y. (2018). Walk score® and its po-
tential contribution to the study of active transport and
walkability: A critical and systematic review. Trans-
portation Research Part D: Transport and Environ-
ment, 61:310–324.
Hansen, W. G. (1959). How Accessibility Shapes Land
Use. Journal of the American Institute of Planners,
25(2):73–76.
Harris, C. R., Millman, K. J., Van Der Walt, S. J., Gom-
mers, R., Virtanen, P., Cournapeau, D., Wieser, E.,
Taylor, J., Berg, S., Smith, N. J., Kern, R., Picus, M.,
Hoyer, S., Van Kerkwijk, M. H., Brett, M., Haldane,
A., Del R
´
ıo, J. F., Wiebe, M., Peterson, P., G
´
erard-
Marchant, P., Sheppard, K., Reddy, T., Weckesser,
W., Abbasi, H., Gohlke, C., and Oliphant, T. E.
(2020). Array programming with NumPy. Nature,
585(7825):357–362.
Revitalizing Walkability Scores: A New Assessment Based on Accessibility
49

INSEE (2010). Les transports et deplacements des habitants
des Pays de la Loire.
Jordahl, K., Bossche, J. V. D., Fleischmann, M., Wasser-
man, J., McBride, J., Gerard, J., Tratner, J., Perry, M.,
Badaracco, A. G., Farmer, C., Hjelle, G. A., Snow,
A. D., Cochran, M., Gillies, S., Culbertson, L., Bartos,
M., Eubank, N., Maxalbert, Bilogur, A., Rey, S., Ren,
C., Arribas-Bel, D., Wasser, L., Wolf, L. J., Journois,
M., Wilson, J., Greenhall, A., Holdgraf, C., Filipe, and
Leblanc, F. (2020). Geopandas/geopandas: V0.8.1.
Zenodo.
Lam, T. M., Wang, Z., Vaartjes, I., Karssenberg, D., Ettema,
D., Helbich, M., Timmermans, E. J., Frank, L. D., den
Braver, N. R., Wagtendonk, A. J., Beulens, J. W. J.,
and Lakerveld, J. (2022). Development of an ob-
jectively measured walkability index for the Nether-
lands. International Journal of Behavioral Nutrition
and Physical Activity, 19(1):50.
Lynch, K. (1960). The Image of the City. Publication of
the Joint Center for Urban Studies. M.I.T. Press, Cam-
bridge, Mass., 33. print edition.
Maslow, A. H. (1943). A theory of human motivation. Psy-
chological Review, 50(4):370–396.
Moreno, C., Allam, Z., Chabaud, D., Gall, C., and Prat-
long, F. (2021). Introducing the “15-minute city”:
Sustainability, resilience and place identity in future
post-pandemic cities. Smart Cities, 4(1):93–111.
Nicoletti, L., Sirenko, M., and Verma, T. (2023). Disadvan-
taged communities have lower access to urban infras-
tructure. Environment and Planning B: Urban Analyt-
ics and City Science, 50(3):831–849.
P
´
aez, A., Scott, D. M., and Morency, C. (2012). Measuring
accessibility: Positive and normative implementations
of various accessibility indicators. Journal of Trans-
port Geography, 25:141–153.
python-visualization (2020). Folium, https://python-
visualization.github.io/folium/.
Rosso, A. L., Auchincloss, A. H., and Michael, Y. L.
(2011). The urban built environment and mobility in
older adults: A comprehensive review. Journal of Ag-
ing Research, 2011:816106.
Santos, A. C., Willumsen, J., Meheus, F., Ilbawi, A., and
Bull, F. C. (2023). The cost of inaction on physical in-
activity to public health-care systems: A population-
attributable fraction analysis. The Lancet Global
Health, 11(1):e32–e39.
Su, S., Pi, J., Xie, H., Cai, Z., and Weng, M. (2017). Com-
munity deprivation, walkability, and public health:
Highlighting the social inequalities in land use plan-
ning for health promotion. Land Use Policy, 67:315–
326.
Virtanen, P., Gommers, R., Oliphant, T. E., Haberland, M.,
Reddy, T., Cournapeau, D., Burovski, E., Peterson, P.,
Weckesser, W., Bright, J., Van Der Walt, S. J., Brett,
M., Wilson, J., Millman, K. J., Mayorov, N., Nel-
son, A. R. J., Jones, E., Kern, R., Larson, E., Carey,
C. J., Polat,
˙
I., Feng, Y., Moore, E. W., VanderPlas,
J., Laxalde, D., Perktold, J., Cimrman, R., Henrik-
sen, I., Quintero, E. A., Harris, C. R., Archibald,
A. M., Ribeiro, A. H., Pedregosa, F., Van Mulbregt,
P., SciPy 1.0 Contributors, Vijaykumar, A., Bardelli,
A. P., Rothberg, A., Hilboll, A., Kloeckner, A., Sco-
patz, A., Lee, A., Rokem, A., Woods, C. N., Ful-
ton, C., Masson, C., H
¨
aggstr
¨
om, C., Fitzgerald, C.,
Nicholson, D. A., Hagen, D. R., Pasechnik, D. V.,
Olivetti, E., Martin, E., Wieser, E., Silva, F., Lenders,
F., Wilhelm, F., Young, G., Price, G. A., Ingold, G.-
L., Allen, G. E., Lee, G. R., Audren, H., Probst, I.,
Dietrich, J. P., Silterra, J., Webber, J. T., Slavi
ˇ
c, J.,
Nothman, J., Buchner, J., Kulick, J., Sch
¨
onberger,
J. L., De Miranda Cardoso, J. V., Reimer, J., Har-
rington, J., Rodr
´
ıguez, J. L. C., Nunez-Iglesias, J.,
Kuczynski, J., Tritz, K., Thoma, M., Newville, M.,
K
¨
ummerer, M., Bolingbroke, M., Tartre, M., Pak, M.,
Smith, N. J., Nowaczyk, N., Shebanov, N., Pavlyk,
O., Brodtkorb, P. A., Lee, P., McGibbon, R. T., Feld-
bauer, R., Lewis, S., Tygier, S., Sievert, S., Vigna, S.,
Peterson, S., More, S., Pudlik, T., Oshima, T., Pin-
gel, T. J., Robitaille, T. P., Spura, T., Jones, T. R.,
Cera, T., Leslie, T., Zito, T., Krauss, T., Upadhyay,
U., Halchenko, Y. O., and V
´
azquez-Baeza, Y. (2020).
SciPy 1.0: Fundamental algorithms for scientific com-
puting in Python. Nature Methods, 17(3):261–272.
Xu, Y., Olmos, L. E., Abbar, S., and Gonz
´
alez, M. C.
(2020). Deconstructing laws of accessibility and
facility distribution in cities. Science Advances,
6(37):eabb4112.
Yang, Y. and Diez-Roux, A. V. (2012). Walking Distance
by Trip Purpose and Population Subgroups. American
Journal of Preventive Medicine, 43(1):11–19.
Zhao, J., Sun, G., and Webster, C. (2021). Walkability scor-
ing: Why and how does a three-dimensional pedes-
trian network matter? Environment and Planning B:
Urban Analytics and City Science, 48(8):2418–2435.
GISTAM 2024 - 10th International Conference on Geographical Information Systems Theory, Applications and Management
50
