
Occupational Accidents Prediction in Brazilian States: A Machine
Learning Based Approach
J. M. Toledo
1,2 a
and Thiago J. M. Moura
1
1
Federal Institute of Para
´
ıba (IFPB), Avenida Primeiro de Maio, 720, Jaguaribe,
Jo
˜
ao Pessoa, Para
´
ıba, CEP 58015-435, Brazil
2
Minist
´
erio do Trabalho e Emprego, Esplanada dos Minist
´
erios, Bloco F, Bras
´
ılia, DF, Brazil
Keywords:
Occupational Accidents, Machine Learning, Regression Problems.
Abstract:
Occupational accident is an unexpected event connected to work that may result in injury and/or death of
workers. Thus, the possibility of predicting the occurrence of occupational accidents can assist the government
in labor policy-making, protecting the lives and health of workers. In this work, we propose the use of machine
learning models to predict the occurrence of occupational accidents in each Brazillian state. We use multiple
datasets concerning socio-economic, employment, and demographic data as sources to obtain an integrated
table utilized to train regression models (linear regression, support vector regressor, and LightGBM) and make
predictions. We verify that the developed models show high predictive performance and explainability, with
the R-squared metric reaching 0.90.
1 INTRODUCTION
The first joint report produced by the International La-
bor Organization (ILO) and the World Health Organi-
zation (WHO) to assess the burden of illnesses and
injuries at work estimates that these cause the deaths
of almost two million workers per year (Organiza-
tion et al., 2021). In 2016 alone, occupational acci-
dents and work-related diseases caused the death of
1.9 million people, overloading the countries’ health
systems, reducing family income, and decreasing eco-
nomic productivity (Organization et al., 2021).
About Brazil, between 2012 and 2021, there
were 6,161,623 (six million, one hundred and sixty-
one thousand, six hundred and twenty-three) oc-
cupational accidents and work-related diseases re-
ported to official government agencies, in addition to
22,954 (twenty and two thousand, nine hundred and
fifty-four) deaths due to work-related reasons (MPT,
2023). It is worth highlighting that social security ex-
penses estimated to result from such facts have al-
ready exceeded 133 billion reais (MPT, 2023) (ap-
proximately 25.7 billion dollars in 2023 exchange
rate), a significant portion of the Brazilian Gross Do-
mestic Product (GDP).
According to specialized literature, however,
work-related accidents and illnesses are caused by
a
https://orcid.org/0000-0001-9284-0549
multiple factors that could be prevented (Alli, 2008).
According to Brazilian legislation, employers are de-
manded to implement preventive measures to elimi-
nate or mitigate the risks present in the workplace,
while the government is responsible for enforcing la-
bor legislation and promoting a safe working environ-
ment, with a focus on preventing accidents and work-
related diseases. To achieve this objective, govern-
ment agencies can use technology to increase the ef-
ficiency of their actions.
Recently, we have experienced the growth of ma-
chine learning (ML), driven not only by the data avail-
ability but also by the increasing processing power of
computers (Alpaydin, 2021). This field of study al-
lows machines to learn from past data and make pre-
dictions (Alpaydin, 2021). Machine learning algo-
rithms have been applied to solve various problems,
such as building recommendation systems, fraud de-
tection, and image recognition (Alpaydin, 2021).
Several areas of knowledge, such as medicine and en-
gineering, have also made use of advances in the area
to automate diagnoses and anticipate results.
Although Brazilian legislation requires the report-
ing of occupational accidents and work-related dis-
eases for public entities, there is a delay between the
reporting of occupational accidents and their use by
the government. Thus, forecasting the number of oc-
cupational accidents can anticipate preventive actions.
Toledo, J. and Moura, T.
Occupational Accidents Prediction in Brazilian States: A Machine Learning Based Approach.
DOI: 10.5220/0012557900003690
Paper published under CC license (CC BY-NC-ND 4.0)
In Proceedings of the 26th International Conference on Enterprise Information Systems (ICEIS 2024) - Volume 1, pages 595-602
ISBN: 978-989-758-692-7; ISSN: 2184-4992
Proceedings Copyright © 2024 by SCITEPRESS – Science and Technology Publications, Lda.
595

Furthermore, predicting work accidents for the coun-
try’s economic sectors can help in establishing public
policies for health and safety at work and prevention
of occupational accidents.
The objective of this work is to obtain a dataset
on the number of occupational accidents, as well as
the extraction and processing of information that are
used as independent variables in predictive models
and which is obtained from multiple sources. Sub-
sequently, we analyze the use of machine learning al-
gorithms to predict the number of occupational ac-
cidents in each economic activity and Brazilian state
(Brazillian territory divisions). As far as we know,
this work is unprecedented in Brazil and may help the
government to act more efficiently, reducing pension
costs, and increasing the general well-being of soci-
ety.
2 BACKGROUND AND RELATED
WORKS
In this section, we briefly examine the fundamental
concepts of machine learning and perform a biblio-
graphical review of the employment of ML in occu-
pational accident prediction.
2.1 Machine Learning
In recent years, the increase in computational capacity
and data storage has driven the development of ML,
which has been applied in many areas of knowledge.
In this work, we intend to predict the number of oc-
cupational accidents in each Brazillian state and eco-
nomic activity. Therefore, the target variable is a con-
tinuous number, and, as a consequence, we propose
the use of regression models. Thus, let us briefly de-
scribe the ML regression algorithms implemented in
the proposed experimental protocol.
The simplest regression model is called linear re-
gression (James et al., 2013). It assumes that there is
approximately a linear relationship between the fea-
tures and the target variable. Data is used to find the
best linear coefficients which minimize the discrepan-
cies between predicted and actual output values. This
kind of model, although simple compared to more
modern models as the ones described below (Support
Vector Machines - SVM and LightGBM), is widely
used in science (James et al., 2013).
The SVM algorithms denote a class of ML mod-
els developed in the 1990s and which gained popular-
ity since then (James et al., 2013). The SVM models
were initially introduced for classification problems
and later generalized to other situations, being cur-
rently used in various domains of application, such as
text categorization and computer vision (Mammone
et al., 2009).
LightGMB is a gradient boosting tree algorithm
that was developed by Microsoft, focusing on the ef-
ficiency and scalability of the ML model (Ke et al.,
2017). Compared to other boosting trees, Light-
GBM saves time and computational cost, allowing
researchers and developers to deal with big datasets
(Schapire et al., 1999).
Given the variety of available machine learning
models, deciding which method produces the best re-
sults in a given dataset is an important task(James
et al., 2013). Thus, let us briefly summarize the met-
rics used in this work to evaluate the prediction of the
trained regression models.
The Root mean square error (RMSE) represents
the squared root of the squared differences between
the actual values and the predicted values of a vari-
able. The closer RMSE is to zero, the better the pre-
dictions. On the other hand, the mean absolute per-
centage error (MAPE) is the mean percentual differ-
ence between the predicted and actual value of a vari-
able. Finally, the coefficient of determination (R
2
)
represents the proportion of variance in the target that
can be explained by the features. The values of R
2
range between 0 and 1 and the greater the value of
this metric, the more explainable is the target variable
by the features through the regression model.
2.2 Related Works
In recent years, some works have been produced us-
ing ML techniques on themes related to workers’
health and, more specifically, using data on occupa-
tional accidents.
In this regard, Sarkar et al. predicted whether an
accident caused damage to workers or property with
an accuracy of around 90% (ninety percent) by per-
forming tests with SVM and ANN (Artificial Neu-
ral Networks) and applying GA (genetic algorithm)
and PSO (particle swarm optimization) algorithms
to refine the hyperparameters of the models (Sarkar
et al., 2019). In turn, Recal et al. used logistic re-
gression, SVM, ANN, and SGB (Stochastic Gradient
Boosting) to classify work accidents that occurred in
the construction industry in Turkey, working in two
scenarios: binary prediction (fatal accident or not)
and prediction in three classes (simple, severe, or
fatal accident)(Recal and Demirel, 2021). The au-
thors conclude that the SVM and SGB algorithms
performed better in the two-class problem, while the
SGB obtained better metrics in the three-class prob-
lem. In addition, the authors state that the predictions
ICEIS 2024 - 26th International Conference on Enterprise Information Systems
596
in the class of fatal accidents surpassed the results
of other classes in accuracy, which reveals that the
selected features have characteristics associated with
the severity of accidents and, therefore, the trained
models can be used to prevent future occurrences (Re-
cal and Demirel, 2021).
Khairuddin et al. analyzed a public OSHA (Occu-
pational Safety and Health Administration) database
using five machine learning algorithms: SVM, KNN
(K-Nearest Neighbors), Na
¨
ıve Bayes, Decision Tree,
and Random Forest (Khairuddin et al., 2022). The au-
thors used a feature optimization technique through
which only the three most important features of the
models are maintained in the algorithms’ training pro-
cess. Using the described methodology, the authors
could predict the possibility of hospitalization with
89% accuracy (eighty-nine percent) and with 95% ac-
curacy (ninety-five percent) the occurrence of ampu-
tation as a result of an accident at work.
ML models were also used for predictions in some
specific economic activities. Koc et al., for exam-
ple, used data from approximately 48,000 accidents
in civil construction in Turkey and predicted the pos-
sibility of permanent disability of the injured workers
with an accuracy of 82% (eighty-two percent) through
the application of the algorithm XGBoost (Extreme
Gradient Boosting) and with the use of a genetic al-
gorithm to fix the hyperparameters of the model (Koc
et al., 2021).
In another work, Scott et al. used prehospital care
data to predict which admissions occurred as a result
of occupational accidents in rural areas (Scott et al.,
2021). Intending to help reduce the underreport-
ing of occupational accidents, the authors used the
Na
¨
ıve Bayes algorithm and claimed to reduce by 69%
(sixty-nine percent) the need for visual inspection of
pre-hospital care cases (Scott et al., 2021). In the
medical-hospital activity, Koklonis et al. used post-
accident (or post-incident) data to classify events into
five classes: needle/cut accident, fall, incident, acci-
dent, and safe condition (Koklonis et al., 2021). The
authors categorized the data into the classes above
with an accuracy of 93% (ninety-three percent), per-
forming tests with the Na
¨
ıve Bayes, MLP (multilayer
perceptron), KNN, and BN (Bayesian Networks) al-
gorithms.
In Brazil, the Labor Inspectors created a binary
classification model for accidents that was able to cre-
ate a probability of occurrence of accidents (Toledo
et al., 2020). The trained model presented an 86%
(eighty-six percent) accuracy in the test dataset and
the generated probabilities have been used in the plan-
ning of inspections in the country (Toledo et al.,
2020).
3 OCCUPATIONAL ACCIDENTS
IN BRAZIL
As an initial step in building predictive models, it is
necessary to understand the data used as features and
target variables. To this end, an exploratory analy-
sis of the occupational accident data in Brazil is per-
formed in this section.
Brazilian laws oblige all companies in which oc-
cupational accidents and work-related diseases occur
to communicate these facts to the government through
a digital document named Occupational Accident
Communication (CAT - Comunicac¸
˜
ao de Acidente de
Trabalho). Data about the employee (like age, gen-
der, and professional activity), the accident/disease
(type of accident/disease, causative factor, etc.), and
the employer (such as its economic activity) are in-
formed in this document. These data are received by
the Brazilian government which creates a dataset that
is used in this work, after an anonymization process.
It is worth mentioning that we do not consider work-
related diseases, just maintaining in the analyzed data
the occupational accidents. From 2016 to 2022, a to-
tal of 2.387.938 occupational accidents were reported
in Brazil, which will be analyzed in what follows.
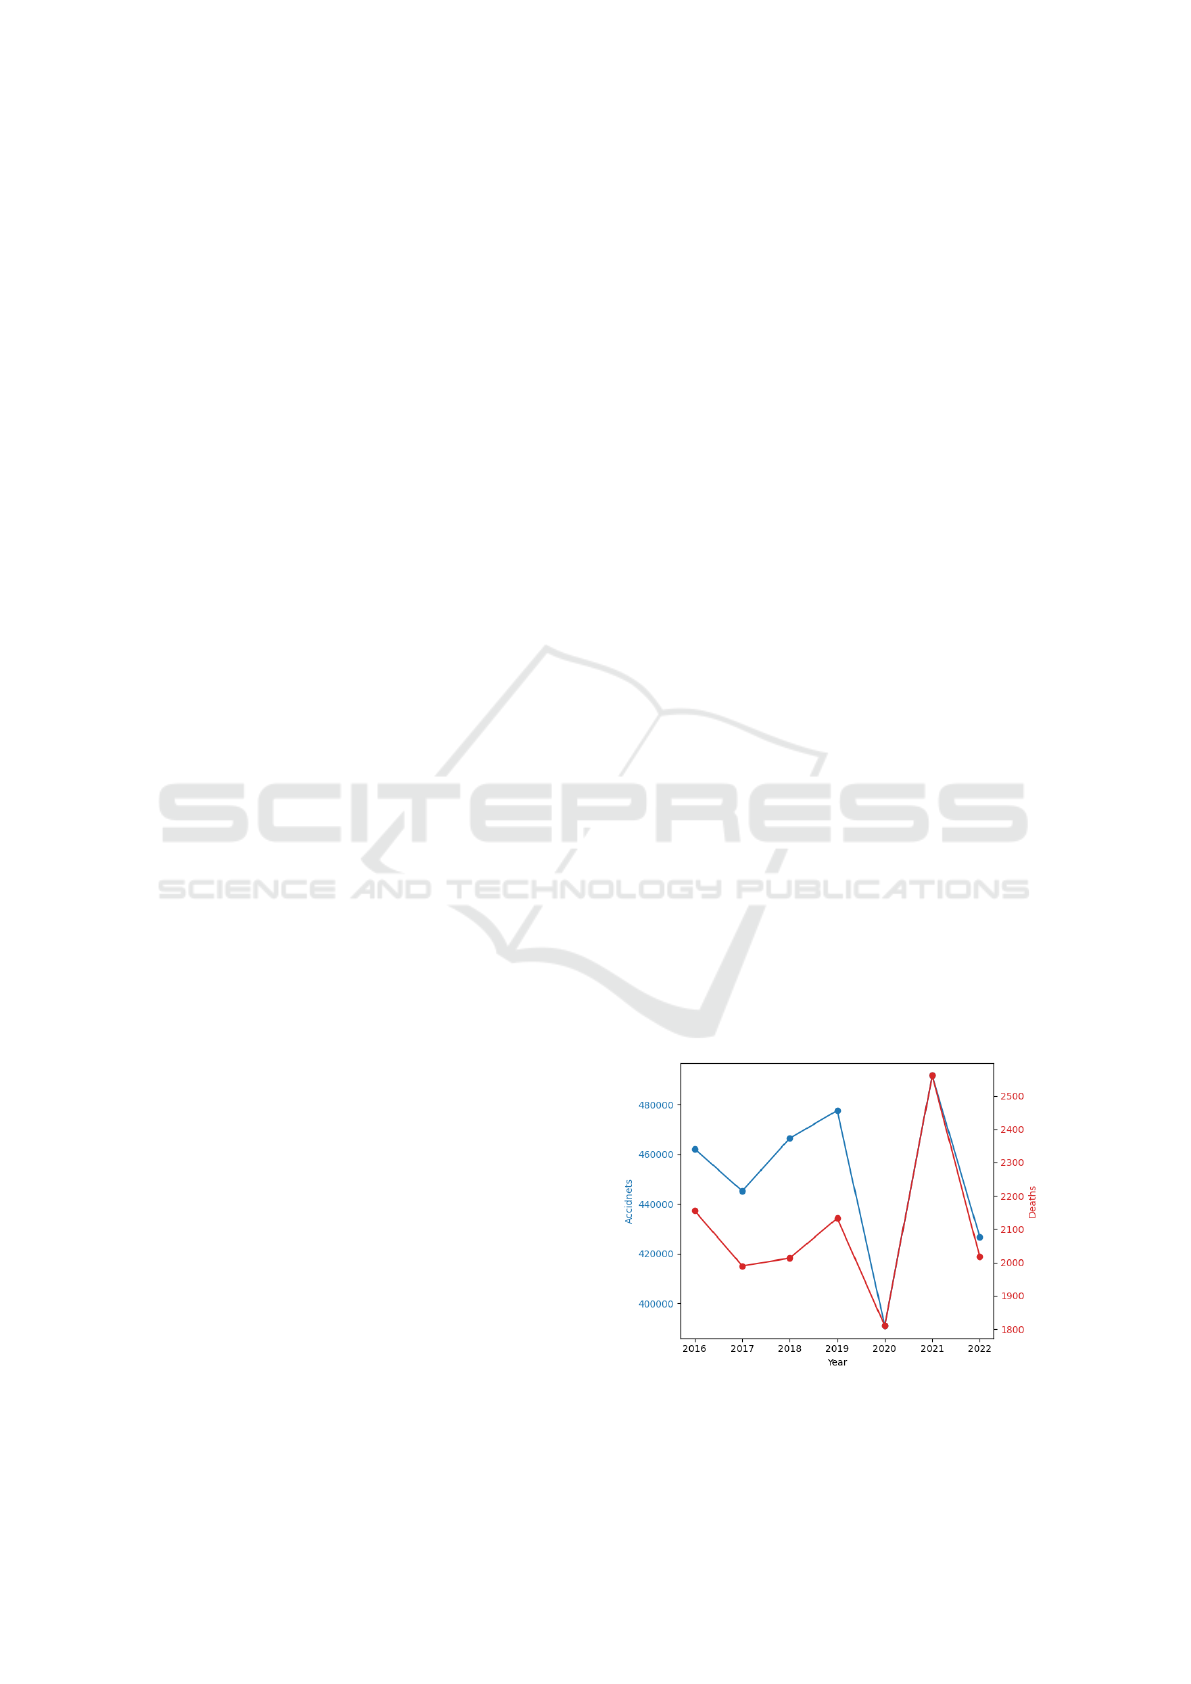
In Fig. 1, we represent the line plot of the number
of occupational accidents (shown in blue) and deaths
resulting from accidents (shown in red) in Brazil for
the period under consideration. We can observe that
the number of accidents decreased in 2020 due to the
COVID-19 pandemic outbreak, while, on the other
hand, there was an increase in the number of work-
related diseases, due to the same cause. In the period
considered excluding the year 2020, the number of
occupational accidents was at the level of 450 thou-
sand, while the number of deaths resulting from work-
related causes was close to 2 thousand.
Figure 1: Line plots of the number of occupational acci-
dents and work-related deaths.
Occupational Accidents Prediction in Brazilian States: A Machine Learning Based Approach
597
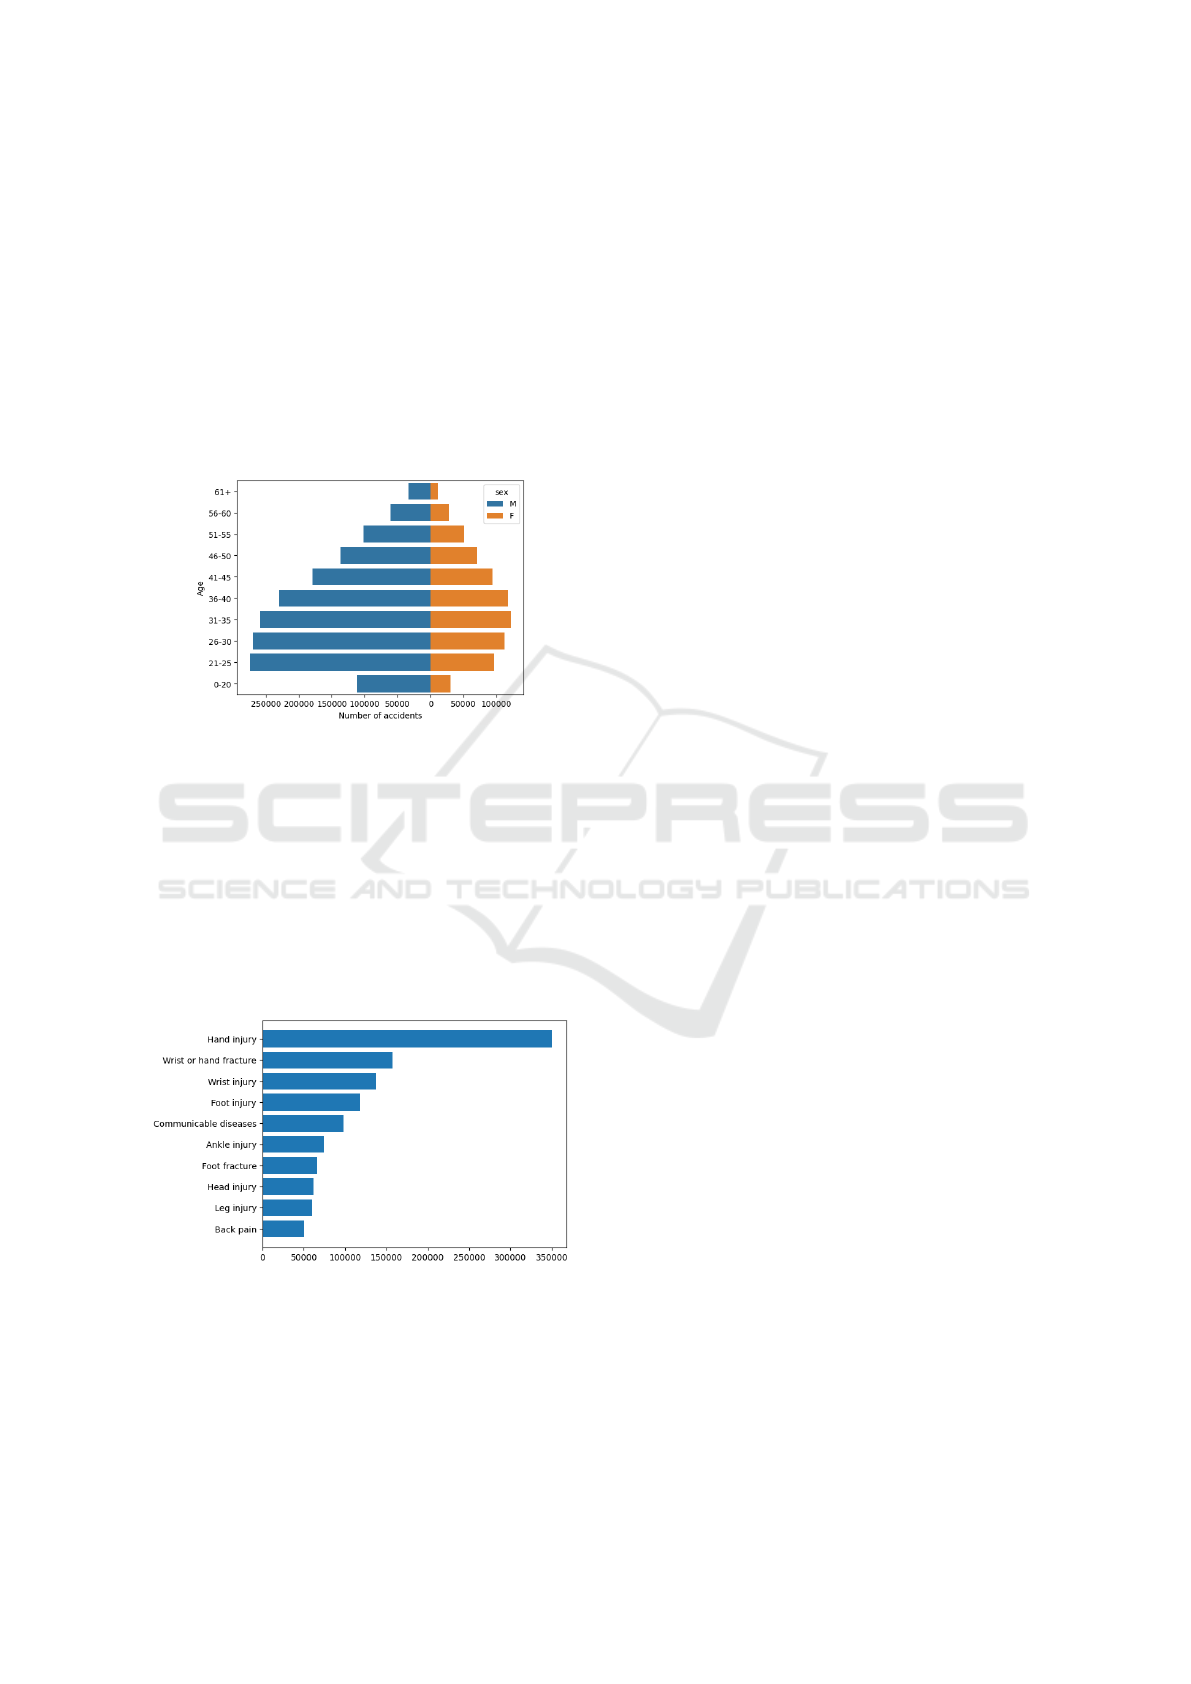
In Fig. 2, we show the distribution of occupa-
tional accidents in Brazil by sex and age of work-
ers, presenting the age pyramid of these accidents in
Brazil. It is possible to verify that the most affected
age group is made up of young men, aged between 21
and 25 years. In general, it is also possible to verify
that the number of occupational accidents is higher
among men (69.4% of the occupational accidents oc-
cur with men). The types of activities carried out by
male workers in Brazil and the inexperience of young
people at work may explain this demographic distri-
bution.
Figure 2: Age pyramid of work-related diseases in Brazil.
In Fig. 3, we can observe the distribution of occu-
pational accidents by the type of injury, classified us-
ing the category of the International Statistical Clas-
sification of Diseases (ICD), for the ten most frequent
types. We can notice that injuries related to muscu-
loskeletal factors (hand and wrist injuries and frac-
tures, foot and ankle injuries, etc.) are the most fre-
quent diseases consequent to accidents. Communica-
ble diseases are also in the list, most related to health
assistant professionals.
Figure 3: Bar diagram of the distribution of occupational
accidents in Brazil by type of injury for the ten most fre-
quent types.
In this work, we aim to obtain a machine learning
model to predict the number of occupational accidents
in the Brazilian states. Thus, the target variable is ob-
tained from the CAT dataset as we discuss below.
4 PROPOSED APPROACH AND
DATA PREPARATION
This section describes the methodology adopted in
this work in addition to analyzing the steps in data
preparation and the dataset obtained.
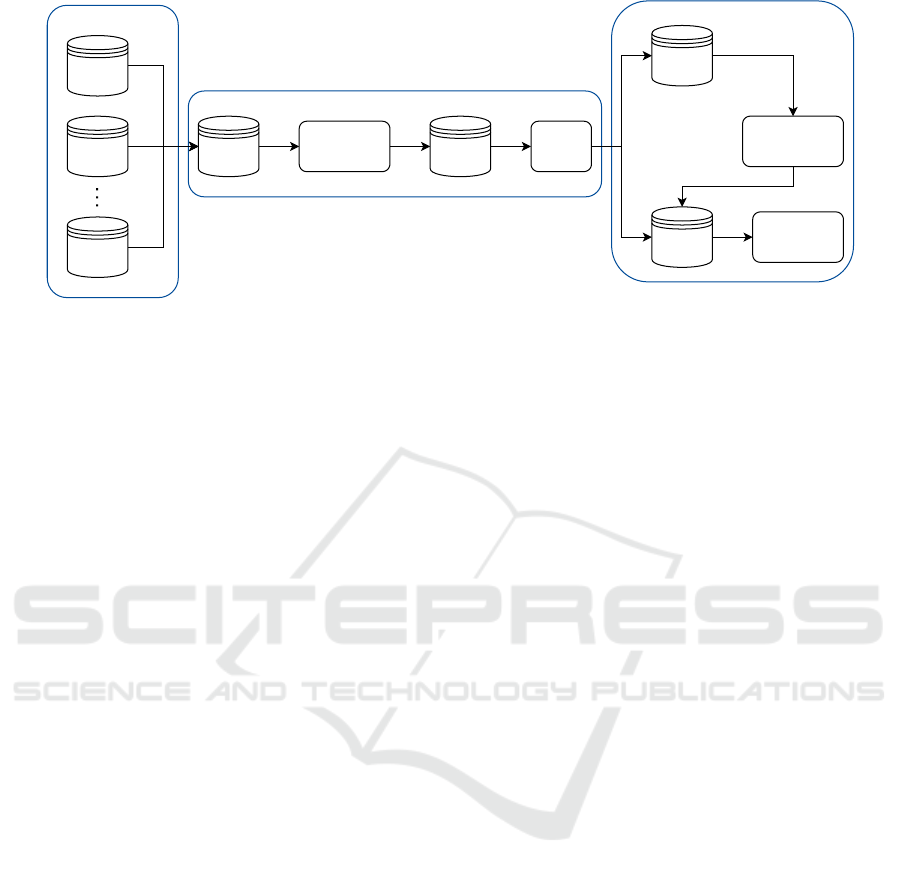
4.1 The Methodological Path
The methodology used in the present work is summa-
rized in Fig. 4. Firstly, we use data from multiple
sources to obtain an integrated dataset containing all
the features and the target variable that are used in
this work. Then, we execute a preprocessing stage
and split the dataset into training and test data, which
are used to implement the ML models and analyze the
results. In this section, we detail the data integration
and preparation step presented in Fig. 4, while the
data preprocessing and ML model training end evalu-
ation are described in Sec. 5.
It is important to mention that we used Python
programming language (Van Rossum et al., 2007) in
all steps of this work, from data preparation to model
training and evaluation.
4.2 Data Preparation
Let us start by describing the data preparation, the
first step of the methodology used in this work and
depicted in Fig. 4.
In this work, the target variable is the number
of occupational accidents in Brazilian states for each
economic activity and by year. Thus, we use the
data acquired from the mentioned CAT communica-
tion and obtain the number of occupational accidents
in a given economic activity in a Brazilian city each
year by grouping and counting the number of rows.
When constructing the dataset, only accidents that
occurred between 2016 and 2021 were kept, as we
would not have all the features available for 2022.
The data used as features were obtained by inte-
grating multiple datasets, as shown in Fig. 4. These
datasets were obtained from public sources and the
Brazilian Labor Ministry databases. Thus, an impor-
tant contribution is made in this work: the integration
of data from multiple sources to obtain a single uni-
fied table containing all variables needed to train the
models.
The construction of a public sociodemographic
dataset in Brazil has already been done (Toledo et al.,
2023). Integrating data from public sources related
to population, economy, employment, education, and
health, the authors obtained a socioeconomic statis-
tics dataset for all 5,570 Brazillian cities (Toledo
ICEIS 2024 - 26th International Conference on Enterprise Information Systems
598
Data
Pre-processing
Data
Train-test
split
Training
Data
Test Data
Model training/
hyperparameter
tuning
Model Evalution
1. Data preparation
2. Data pre-processing and train-test split
3. Model training and evalution
Figure 4: The methodological path used in this work.
et al., 2023). From these public sources, some vari-
ables are chosen to compose the dataset used in this
work, as we discuss below.
The Gross Domestic Product (GDP) represents the
value of all the finished goods and services produced
in a region and, as a consequence, it is related to the
economic activity and the need for work. On the other
hand, the Human Development Index (HDI) is related
to health, education, and work conditions.
General data from Brazilian cities are also in-
cluded as features: the population and working staff.
We can expect that the greater a region is (bigger pop-
ulation and working staff), the greater the number of
occupational accidents too.
From the Brazilian Labor Ministry databases, we
include data related to the employers and employees.
The economic activity of an enterprise, given by the
Brazilian National Classification of Economic Activ-
ities (CNAE), is used as a categorical variable. The
numbers of employers and employees in each Brazil-
ian state are also included. It is important to observe
that, as described in Sec. 3, the sex and age of work-
ers are determinant variables in the occurrence of ac-
cidents. Thus, the mean age of the employees, the
average time they work in a given employer, and the
proportion of females were included as features in our
study.
Finally, we included features obtained from the
Brazilian Labor Inspection. The number of irregu-
larities related to informal workers and the number
of irregularities related to working hours are added,
since the mentioned WHO/ILO joint report points out
exposure to long work hours as the major cause of
deaths related to work and informal jobs being cor-
related to the occurrence of accidents (Organization
et al., 2021). In Brazil, Labor Inspectors stop work
activities if serious and imminent risks to workers’
health are detected, in procedures called embargos or
interdictions, whose numbers per economic activity
in a given state are also included in this work. Since
it should be expected that a higher number of oc-
cupational accidents occur in economic activities in
which a greater number of irregularities are detected,
the mentioned variables are considered in ML model
training.
It is worth mentioning that the described datasets
are joined using the Brazilian cities and the year as
keys.
4.2.1 The Resulting Dataset
After the step of data integration, a unified dataset is
obtained containing, for each Brazillian city, the num-
ber of occupational accidents in each economic activ-
ity and all the corresponding features. Brazil is di-
vided into 27 states and, these regions, are divided
into cities. As we intend to predict the accidents in
each Brazilian state, we proceed to the proper aggre-
gation summing all the numerical variables but the
ones that are average numbers (and which begin with
”avg”). At this step, we also calculate the population
density (ratio between population and surface area)
and employers’ density (number of employers divided
by the surface area). The features of the dataset used
to train the machine learning models proposed in this
work are displayed in Table 1. We describe each vari-
able, informing its type, unity, maximum and mini-
mum values.
It is essential to state that we take into account the
correlation between variables when choosing the fea-
tures for model training and if a feature pair has a cor-
relation near one we removed one of them, maintain-
ing only the ones listed in Table 1. For example, ini-
tially, we intended to use the total number of female
workers and the total salaried workers as features. But
as the number of female workers and the number of
employees have a Pearson correlation near 1, just the
second variable is maintained. Similarly, the total
Occupational Accidents Prediction in Brazilian States: A Machine Learning Based Approach
599

Table 1: Data dictionary.
Variable Description Type Unit Min value Max value
UF Brazilian state string - - -
Cnae Brazilian economic activity classification string - - -
Population Population int - 1.85 × 10
3
3.08 × 10
7
WorkingStaff Working staff int - 0 2.33 × 10
6
PopulationDensity Number of people by km
2
float - 0.6 5363.08
HDI Human Development Index (HDI) float - 0.469 0.847
GPD Gross Domestic Product (GDP) float 10
3
R$ 2.36 2.18 × 10
7
NrEmployers Number of employers int - 0 633, 656
EmployersDensity Number of enterprises by km
2
float - 0 5.36
NrEmploees Number of employees int - 0 1.07 × 10
6
PropFemale Proportion of female workers float - 0 1
AvgAge Average age of employees float years 0 56.70
AvgTime Average time working for the employer float years 0 25.55
NrIrregularities Nr. of irregularities related to informal workers int - 0 662
NrIrregHours Nr. of irregularities related to working hours int - 0 270
NrEmbargoes Nr. of embargoes/closures int - 0 1547
salaried population and the working staff have a cor-
relation coefficient near one and, thus, the first feature
was removed.
5 EXPERIMENTAL PROTOCOL
In this section, we describe the data prepossessing and
the machine learning models training, the final steps
of Fig. 4.
5.1 Data Preprocessing
As a data preprocessing step, null numerical data
were replaced by zero. The categorical variables were
transformed into numerical variables using the target
encoding strategy (Micci-Barreca, 2001), since there
are a large number of variable categories, a situation
for which the strategy has proven effective (Pargent
et al., 2022). The numerical variables were resized
by subtracting them from their means and dividing
them by the standard deviation of their distributions, a
strategy called standard scalar. After the preprocess-
ing step, the resulting dataset has 11,255 (eleven thou-
sand, two hundred and fifty-five) rows (also called in-
stances in ML problems).
5.1.1 Train-Test Split
Evaluating the performance of an ML model in an un-
biased dataset is an essential step. So, it is a com-
mon practice to split the initial dataset into training
and test ones. In this work, the dataset resulting from
the preprocessing step was randomly divided into a
training dataset, which contains 80% of the data in-
stances, or 9,004 (nine thousand and four) rows, and
a test dataset, including the remaining 20% rows, or
2,251 (two thousand, two hundred and fifty one).
5.2 Moldel Training
As already mentioned, we intend to predict the num-
ber of occupational accidents in Brazil in each state
and for each economic activity. So, it is clear that this
problem is a regression one and, as a consequence, the
correct choice of the studied models must be made.
Although linear regression is a very simple super-
vised learning model, it is useful and widely used
in science (James et al., 2013). In this work, lin-
ear regression with the standard hyperparameters of
the Python library Scikit Learn is used as a baseline
model.
In this study, we analyze the use of models SVM
and LightGBM, since they have been presenting a
high performance in regression problems (Bent
´
ejac
et al., 2021) and were also used in similar problems
to the one proposed in this work in other countries
(Di Noia et al., 2020; Toledo et al., 2020).
The ML models have a set of hyperparameters,
which are adjusted in training steps, that can improve
the models’ performance and help prevent overfitting.
The hyperparameter search space used for SVM and
LighGBM models can be seen in Table 2.
In the model training step and for hyperparam-
eter search, we also use cross-validation with four
folds for all the models and Bayesian optimization.
In this process, the training dataset is divided into
four folds in each iteration and, while one of them
is used for evaluating the model, the other three are
used for training the algorithm. After all of the iter-
ations, the best hyperparameters are chosen and the
ICEIS 2024 - 26th International Conference on Enterprise Information Systems
600
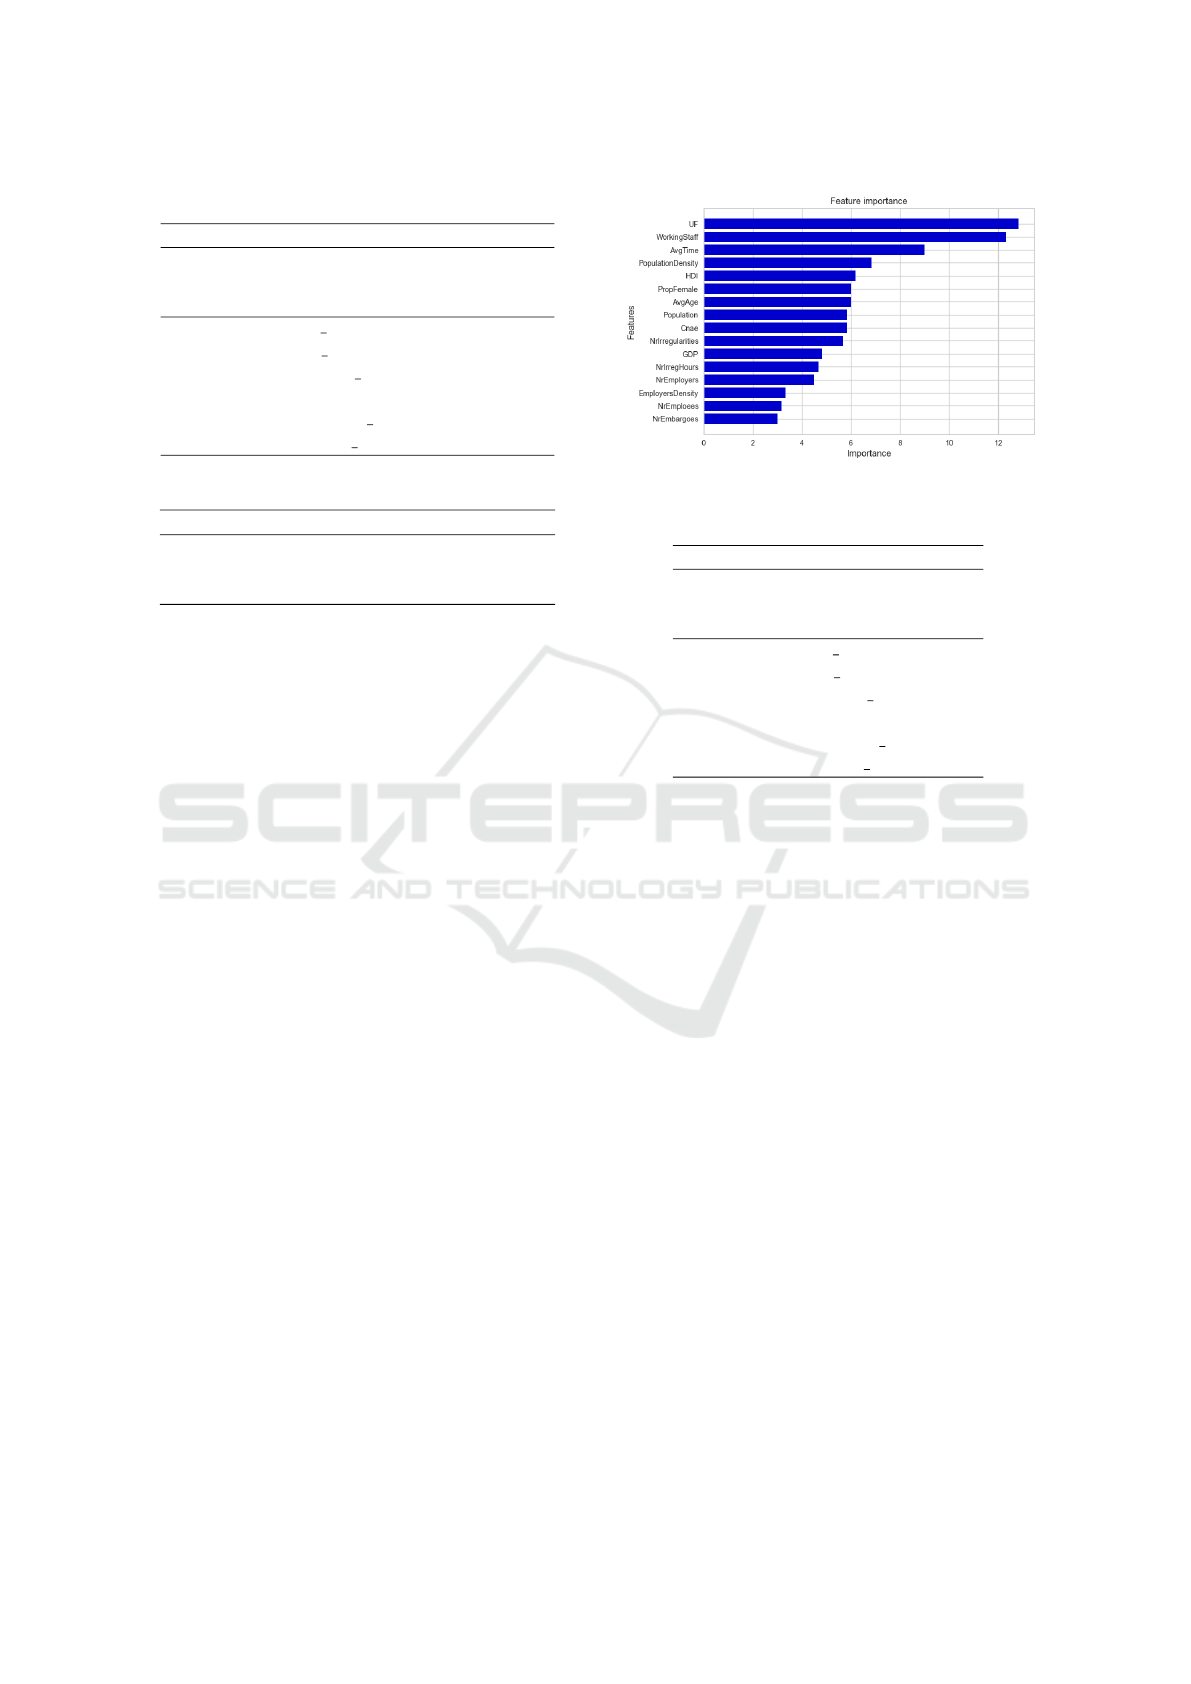
Table 2: Hyperparameter search spaces.
Model Hyperparameter search space
SVR
C:[0.1,1,10,100]
gamma:[’scale’, ’auto’]
kernel:[’linear’, ’poly’, ’rbf’]
LightGBM
max depth: [5, 9]
num leaves: [6, 17]
boosting type: [gbdt, dart]
subsample: [0.7, 0.8, 0.9, 1.0]
colsample bytree: [0.8, 0.9, 1.0]
learning rate: [0.05, 0.5]
Table 3: Metrics for the implemented regression models.
Model R
2
MAPE RMSE
Linear regression 0.492 21.27% 743.20
SVR 0.725 3.31% 546.54
LightGBM 0.908 1.86 % 316.60
whole dataset is used to train the algorithm, which is
evaluated with the test dataset.
6 RESULTS AND DISCUSSION
This section discusses the predictions obtained by the
ML models trained as shown in Sec. 5.
In Table 3, we list the metrics obtained for the
models in the test dataset. We can notice that the
LightGBM has the higher R
2
and the lower values
of MAPE and RMSE. Observe that the value of R
2
reaches the values of 0.725 for SVM and 0.908 for
LightGBM, which tells us that the features and mod-
els chosen explain the target variable, distancing from
random guesses.
Upon analyzing the MAPE metric, we can observe
that there is only a 1.86% variation between the ac-
tual and predicted values for the target variable when
using the LightGBM model. On the other hand, the
values of RMSE presented in Table 3 are below the
standard deviation for the target variable, which is
1051.72.
The LightGBM algorithm calculates a score for
each feature, representing the feature’s importance,
with a higher score representing a larger effect on the
prediction. We depict in Fig. 5 the relative feature
importance for the trained model.
We can observe that the Brazilian state has the
highest importance. The territory is related to the
economic activities developed and to the population,
which can explain the score. The total work staff is
the second most important feature since we can ex-
pect a growth in the number of accidents in territories
with a higher number of workers. The average time
that the employees work with the employers is also
Figure 5: Feature importance for LightGBM algorithm.
Table 4: Hyperparameter search spaces.
Model Best hyperparameters
SVR
C = 10
gamma=’auto’
kernel= ’poly’
LightGBM
max depth = 9
num leaves= 7
boosting type=gbdt
subsample=0.7
colsample bytree=1.0
learning rate= 0.48
an important feature, indicating that the experience in
the workplace reduces the probability of accidents.
Finally, for reproducibility reasons, we list in Ta-
ble 4 the models’ hyperparameters that gave the best
metrics in the training step.
7 CONCLUDING REMARKS
In this work, we obtain an integrated dataset con-
taining the number of occupational accidents in each
Brazilian state and socioeconomic variables used as
features. We, thus, examine the use of ML models
to predict the number of occupational accidents in the
country.
Analyzing the results obtained so far, it is possible
to verify that it has been possible to build predictive
models to predict the number of accidents occurring
in a given state of the federation.
The high R
2
values obtained for the SVM and
LightGBM algorithms allow the conclusion that the
trained models can explain the target variable based
on the selected features. Besides that, MAPE values
in the order of 1.8% to 3.3% mean that there is a low
percentual difference between the predicted and ac-
tual value of the accident number.
In this work, we predict the number of work acci-
dents for each economic activity in Brazilian states. A
Occupational Accidents Prediction in Brazilian States: A Machine Learning Based Approach
601

challenge that still needs to be faced is the prediction
of work accidents for each of the 5,570 (five thousand
five hundred and seventy) cities in the country, which
we intend to do in future contributions. In this prob-
lem, there is a greater granularity in data, consider-
ably increasing the number of training instances. Fur-
thermore, not all economic activities are developed in
all cities in the country, which will need to be ana-
lyzed in the data preprocessing stages.
Another possibility for future work is the use of
time series analysis techniques to forecast the number
of occupation accidents. To this end, it is necessary
to perform appropriate transformations in the occu-
pational accident dataset, evaluate the granularity of
the information, and choose the correct experimental
protocol.
Given the importance of the government’s preven-
tive action strategies to safeguard workers’ health, the
continuity of research seems to be essential.
REFERENCES
Alli, B. O. (2008). Fudamental Principles of Occupational
Health and Safety.
Alpaydin, E. (2021). Machine learning. Mit Press.
Bent
´
ejac, C., Cs
¨
org
˝
o, A., and Mart
´
ınez-Mu
˜
noz, G. (2021).
A comparative analysis of gradient boosting algo-
rithms. Artificial Intelligence Review, 54:1937–1967.
Di Noia, A., Martino, A., Montanari, P., and Rizzi, A.
(2020). Supervised machine learning techniques and
genetic optimization for occupational diseases risk
prediction. Soft Computing, 24(6):4393–4406.
James, G., Witten, D., Hastie, T., Tibshirani, R., et al.
(2013). An introduction to statistical learning, vol-
ume 112. Springer.
Ke, G., Meng, Q., Finley, T., Wang, T., Chen, W., Ma, W.,
Ye, Q., and Liu, T.-Y. (2017). Lightgbm: A highly
efficient gradient boosting decision tree. Advances in
neural information processing systems, 30.
Khairuddin, M. Z. F., Lu Hui, P., Hasikin, K., Abd Razak,
N. A., Lai, K. W., Mohd Saudi, A. S., and Ibrahim,
S. S. (2022). Occupational injury risk mitigation:
machine learning approach and feature optimization
for smart workplace surveillance. International jour-
nal of environmental research and public health,
19(21):13962.
Koc, K., Ekmekcio
˘
glu,
¨
O., and Gurgun, A. P. (2021). In-
tegrating feature engineering, genetic algorithm and
tree-based machine learning methods to predict the
post-accident disability status of construction work-
ers. Automation in Construction, 131:103896.
Koklonis, K., Sarafidis, M., Vastardi, M., and Koutsouris,
D. (2021). Utilization of machine learning in support-
ing occupational safety and health decisions in hos-
pital workplace. Engineering, Technology & Applied
Science Research, 11(3):7262–7272.
Mammone, A., Turchi, M., and Cristianini, N. (2009). Sup-
port vector machines. Wiley Interdisciplinary Re-
views: Computational Statistics, 1(3):283–289.
Micci-Barreca, D. (2001). A preprocessing scheme for
high-cardinality categorical attributes in classification
and prediction problems. ACM SIGKDD Explorations
Newsletter, 3(1):27–32.
MPT (2023). Observat
´
orio de seguranc¸a e sa
´
ude no tra-
balho. Accessed: 2023-10-02.
Organization, W. H. et al. (2021). Who/ilo joint estimates of
the work-related burden of disease and injury, 2000–
2016: global monitoring report.
Pargent, F., Pfisterer, F., Thomas, J., and Bischl, B.
(2022). Regularized target encoding outperforms tra-
ditional methods in supervised machine learning with
high cardinality features. Computational Statistics,
37(5):2671–2692.
Recal, F. and Demirel, T. (2021). Comparison of machine
learning methods in predicting binary and multi-class
occupational accident severity. Journal of Intelligent
& Fuzzy Systems, 40(6):10981–10998.
Sarkar, S., Vinay, S., Raj, R., Maiti, J., and Mitra, P. (2019).
Application of optimized machine learning techniques
for prediction of occupational accidents. Computers &
Operations Research, 106:210–224.
Schapire, R. E. et al. (1999). A brief introduction to boost-
ing. In Ijcai, volume 99, pages 1401–1406. Citeseer.
Scott, E., Hirabayashi, L., Levenstein, A., Krupa, N., and
Jenkins, P. (2021). The development of a machine
learning algorithm to identify occupational injuries in
agriculture using pre-hospital care reports. Health in-
formation science and systems, 9:1–9.
Toledo, J., Moura, T. J., and Timoteo, R. (2023). Brstats: a
socioeconomic statistics dataset of the brazilian cities.
In Anais do V Dataset Showcase Workshop, pages 67–
78. SBC.
Toledo, J., Timoteo, R. D. A., and Silva Barbosa, E. (2020).
Intelig
ˆ
encia artificial para predic¸
˜
ao de acidentes de
trabalho no brasil e sua aplicac¸
˜
ao pela inspec¸
˜
ao do
trabalho. Revista da Escola Nacional da Inspec¸
˜
ao do
Trabalho.
Van Rossum, G. et al. (2007). Python programming lan-
guage. In USENIX annual technical conference, vol-
ume 41, pages 1–36. Santa Clara, CA.
ICEIS 2024 - 26th International Conference on Enterprise Information Systems
602
