
Efficient Learning Processes by Design: Analysis of Usage Patterns in
Differently Designed Digital Self-Learning Environments
Malte Neugebauer
1 a
, Ralf Erlebach
2 b
, Christof Kaufmann
1 c
, Janis Mohr
1 d
and J
¨
org Frochte
1 e
1
Bochum University of Applied Sciences, 42579 Heiligenhaus, Germany
2
University of Wuppertal, 42119 Wuppertal, Germany
Keywords:
Learning Analytics, Learning Management System, Gamification, Pedagogical Agent, A/B Testing,
Self-Regulated Learning, Higher Education.
Abstract:
The relevance of e-learning for higher education has resulted in a wide variety of online self-learning materials
over the last decade like pedagogical agents (PA) or learning games. Regardless of this variety, educators
wonder whether they can make use of these tools for their goals and if so, which tool to choose and in which
context a specific tool performs best. To do so, the collection and analysis of learning data – referred to as
Learning Analytics (LA) – is required. Along with digital learning environments the possibilities of applying
LA are growing. Often, LA focuses on data that can easily be quantified: drop-out quota, time or grade
performance. To facilitate learning in a more procedural sense, a deeper understanding of learners’ behavior
in specific contexts with specific exercise designs is desired. This study therefore focuses on usage patterns.
Learners’ movements through three different designs of mathematical exercises – (i) plain exercises, (ii) PA
supported and (iii) fantasy game design – are analyzed with Markov chains. The results of an experiment with
503 students inform about which design facilitates what kind of learning. While the PA design lets learners
enter more partial solutions, the fantasy game design facilitates exercise repetition.
1 INTRODUCTION
Digital exercises have long been a standard part of
higher education institutions. Most recently, their
use has been fueled by distance learning during the
Covid-19 pandemic (Turnbull et al., 2021; Lisnani
et al., 2020; Irfan et al., 2020). At the same time,
an increasingly heterogeneous student body addition-
ally facilitated the development of digital material for
self-learning (Boelens et al., 2018). The latter bene-
fited from digital tasks by increased internal differen-
tiation through a greater choice of learning opportu-
nities. Through self-regulated learning, lower-skilled
students are enabled to catch up while higher-skilled
students are enabled to specialize (McKenzie et al.,
2013; Wanner and Palmer, 2015).
The raise of digital exercises also facilitated a raise
of opportunities to measure learning. Learning An-
a
https://orcid.org/0000-0002-1565-8222
b
https://orcid.org/0000-0002-6601-3184
c
https://orcid.org/0000-0002-0191-3341
d
https://orcid.org/0000-0001-6450-074X
e
https://orcid.org/0000-0002-5908-5649
alytics (LA) investigates the process of learning by
collecting and analyzing user-generated data (Long
and Siemens, 2011). However, it still remains un-
clear how and to what extent digital exercises facil-
itate learning processes (Nguyen, 2015). Especially
in the face of a large amount of self-learning tools,
students and teachers ask themselves which learning
tools are suitable for their context. A characterization
of self-learning materials for specific contexts would
be helpful to gain a clear view here.
As a special form of LA, Educational Process
Mining (EPM) focuses on the collection and analysis
of learners’ pathways along different materials during
learning (AlQaheri and Panda, 2022; Bogar
´
ın et al.,
2017). This allows to elucidate learners’ usage pat-
terns of learning materials and how learning material
design influences students’ learning behavior. The
present study makes use of Markov chains for EPM
in order to distinguish effects of different exercise de-
signs on learners’ usage patterns within the same set
of exercises. By analyzing the influence of the de-
sign on learners’ behavior, a specific statement can
be made about the appropriate context of the learning
material.
Neugebauer, M., Erlebach, R., Kaufmann, C., Mohr, J. and Frochte, J.
Efficient Learning Processes by Design: Analysis of Usage Patterns in Differently Designed Digital Self-Learning Environments.
DOI: 10.5220/0012558200003693
Paper published under CC license (CC BY-NC-ND 4.0)
In Proceedings of the 16th International Conference on Computer Supported Education (CSEDU 2024) - Volume 2, pages 467-477
ISBN: 978-989-758-697-2; ISSN: 2184-5026
Proceedings Copyright © 2024 by SCITEPRESS – Science and Technology Publications, Lda.
467

For the present study we used three different de-
sign variants of digital exercises within mathematics
pre-courses – courses that try to bridge the gap be-
tween school and university regarding mathematical
competencies. 503 students were randomly assigned
to either the control group or one of two experimental
groups. With the help of the presented approach, spe-
cific differences in the usage patterns were identified.
Our contributions are summarized as follows:
• Presenting three variants of a digital self-learning
environment based on STACK (see Section 4.1)
within a Moodle quiz, differing in the employ-
ment of feedback and motivators.
• Introducing an approach based on Markov chains
as an LA method to analyze emerging usage pat-
terns and learning behavior within these variants.
• Demonstrating the approach with data from 503
students, showing that the experimental designs
foster deeper learning processes.
• Providing a proposal to align the emerging usage
patterns with didactical functions and user expec-
tations when employing one of the variants.
2 PREVIOUS WORK
LA plays a major role in measuring the impact of dig-
ital learning interventions like game-based learning
(Emerson et al., 2020) or collaborative digital learn-
ing (Elstner et al., 2023). Modern Learning Manage-
ment Systems (LMS) are able to collect numerous
data about their users automatically. Thus, by em-
ploying LA inside LMS the specific effects of digi-
tal learning interventions on learners behavior can be
measured. As a consequence of that, behavior data
is – besides learning level data – the commonly used
type of student-analytics data in LMS (Kew and Tasir,
2021). This data is often used as the LA algorithms’
input variable, e. g. to predict or monitor learners’
performance (Choi et al., 2018; Ga
ˇ
sevi
´
c et al., 2016;
Lowes et al., 2015; Lu et al., 2018). This study takes
the opposite approach and focuses on behavior as the
output variable of interest. By comparing learners’
usage of different designs, the question which design
influences behavior to what extent and which design
is recommended for which setting can be addressed.
Some studies already use LA to measure learning
behavior, e. g. the spent time within an activity or
the interaction with the LMS to derive implications
for lecturers from that. Rienties and Toetenel (2016)
use LMS data to relate the amount of time learners
spent on doing digital activities to differences in the
learning design. Although the spent time in learning
activities is an interesting value for the development
of learning designs in general, it is not sufficient for
giving lecturers advice on which design is suitable for
which context, which is the aim of the present study.
Vanacore et al. (2023) on the other hand use
different designs within a computer-assisted learn-
ing platform in an experimental research setting.
They apply different non-cognitive interventions like
displaying motivating messages during learning to
middle-school students. They test not only learners’
performance, but also their response time and hint us-
age. Here again the data basis is not sufficient for
suggesting specific interventions for specific contexts
to lecturers. Apart from that, the few significant ef-
fects that were found were not strong enough to make
an actual recommendation. In contrast to this, the
present study tests two experimental designs that have
a strong impact on learners’ usage patterns compared
to a control design. The focus lies on the pathways
users make within the given exercises.
3 THEORETICAL
FOUNDATIONS
Before discussing a study on a mathematical self-
learning tool for future university students, we must
first outline its theoretical basis. This tool aims to fa-
cilitate review and practice of mathematical exercises,
targeting the initial levels of Bloom’s taxonomy – Re-
member and Understand – as outlined by Anderson
et al. (2000) – in an LMS. Characteristically, such
self-directed learning offerings are characterized by
the absence of direct interaction with an instructor.
Therefore, the design of the learning materials sig-
nificantly impacts their utilization. Feedback mecha-
nisms and motivational elements within the resource
play a role. Both feedback (Section 3.1) and moti-
vation (Section 3.2) will be further elaborated. The
research question is derived from that (Section 3.3).
Finally, Markov chains and their role for answering
the research question are described (Section 3.4).
3.1 Feedback
Feedback plays a crucial role in guiding learning pro-
cesses and has several functions. According to re-
search, effective feedback must be clear, specific,
timely, process-oriented, and task-related (Hattie and
Timperley, 2007; Wisniewski et al., 2020). Forma-
tive feedback provided during the learning process
helps students improve their performance, while pos-
itive feedback serves as a motivational factor. How-
ever, understanding the nuances of feedback is essen-
CSEDU 2024 - 16th International Conference on Computer Supported Education
468

tial for educators and educational systems to optimize
learning outcomes. In this article, three forms of feed-
back are distinguished based on timing and function:
(F1) Assistive Feedback, (F2) Corrective Feedback,
and (F3) Motivational and Learning-organizing Feed-
back.
(F1) Assistive Feedback refers to guidance provided
to learners while they solve problems, offering
clues on how to correct their work without re-
vealing the solution directly.
(F2) After submitting their input, learners re-
ceive Corrective Feedback with information on
whether it’s correct or not. In cases where er-
rors match specific patterns, the feedback also
provides guidance on how to avoid those errors
in future attempts.
(F3) Lastly, Motivational and Learning-organizing
Feedback goes beyond a simple indication of
solution success. By incorporating corrective
feedback, learners are presented with the oppor-
tunity to repeat the specific task with different
sets of values, facilitating further practice and
skill development.
As a specialized form of providing feedback, dig-
ital Pedagogical Agents (PA) are often used. PA
are computer-generated depictions of a person that
can be integrated into software or websites. PA
provide personalized feedback and guidance to stu-
dents, with small-to-medium effect sizes observed in
learning outcomes and motivation (Schroeder et al.,
2013; Castro-Alonso et al., 2021). PA’s adaptive non-
verbal or emotional feedback has shown particular ef-
ficacy in enhancing learner motivation and engage-
ment (Guo and Goh, 2015; Wang et al., 2022).
3.2 Motivation
Apart from feedback, which also provides motiva-
tional aspects to the learning process, there are further
mechanisms that can be embedded in self-learning
materials in order to specifically positively influence
learners’ motivation and usage behavior. A frame-
work for designing such mechanisms can be derived
from the Self-Determination Theory (SDT) (Ryan
and Deci, 2000). SDT delineates the impact of
four intrinsically motivating factors: social related-
ness, autonomy, mastery, and purpose. A meta-
analysis confirmed that meeting psychological needs
improves motivation and learning outcomes (Niemiec
and Ryan, 2009). Conventional instruction focuses
on setting goals through teacher planning and pro-
viding meaningful content within a controlled class-
room environment. In contrast, self-directed learning
lacks these control mechanisms, making it more chal-
lenging to compete with other stimuli for learners’ at-
tention. A potential solution is to incorporate goal-
setting and meaning choices into the learning material
by creating a coherent narrative and storytelling. Nar-
ratives provide structure and relevance, helping learn-
ers connect their goals with the content.
3.3 Research Question
As outlined above, both feedback as well as motiva-
tion essentially influence learning behavior. How both
aspects are considered in digital exercises hinges in
turn on how the exercises are designed. This gives
rise to the following research question:
RQ: What kinds of learning action patterns emerge
within the self-learning material as a result of the ma-
nipulation of the factors design and feedback?
3.4 Markov Chains
The research question makes a systematic statistical
description of the sequential learning process neces-
sary. The learning process is, in the scope of this con-
tribution, conceptualized as attainment and progres-
sion through various states. A state, for instance, may
be the presentation of a task or a question. Similarly,
the outcomes of such engagements can be character-
ized as such states as well, encompassing “task cor-
rectly answered,” “task partially correct answered,” or
“task incorrectly answered.”
The concatenation of transitions from any individ-
ually learning path can be modeled through Markov
chains, a well-established method (Asmussen and
Steffensen, 2020) used, e. g., in LA (Jeong et al.,
2010) or Bayesian Knowledge Tracing (Corbett and
Anderson, 1995; Yudelson et al., 2013; Moraffah
and Papandreou-Suppappola, 2022). Our usage of
Markov chains is to compare transitions in differently
designed activities in LMS and derive effects from
them in an experimental research design, which has
not yet been done. This, as well as relating the derived
effects to specific didactical functions is the main con-
tribution of the present paper.
4 EXPERIMENT
The following section describes the exercise set and
the different designs more deeply to explain the used
material (Section 4.1). Furthermore, the used research
method is presented (Section 4.2) and the collected
data is described (Section 4.3).
Efficient Learning Processes by Design: Analysis of Usage Patterns in Differently Designed Digital Self-Learning Environments
469

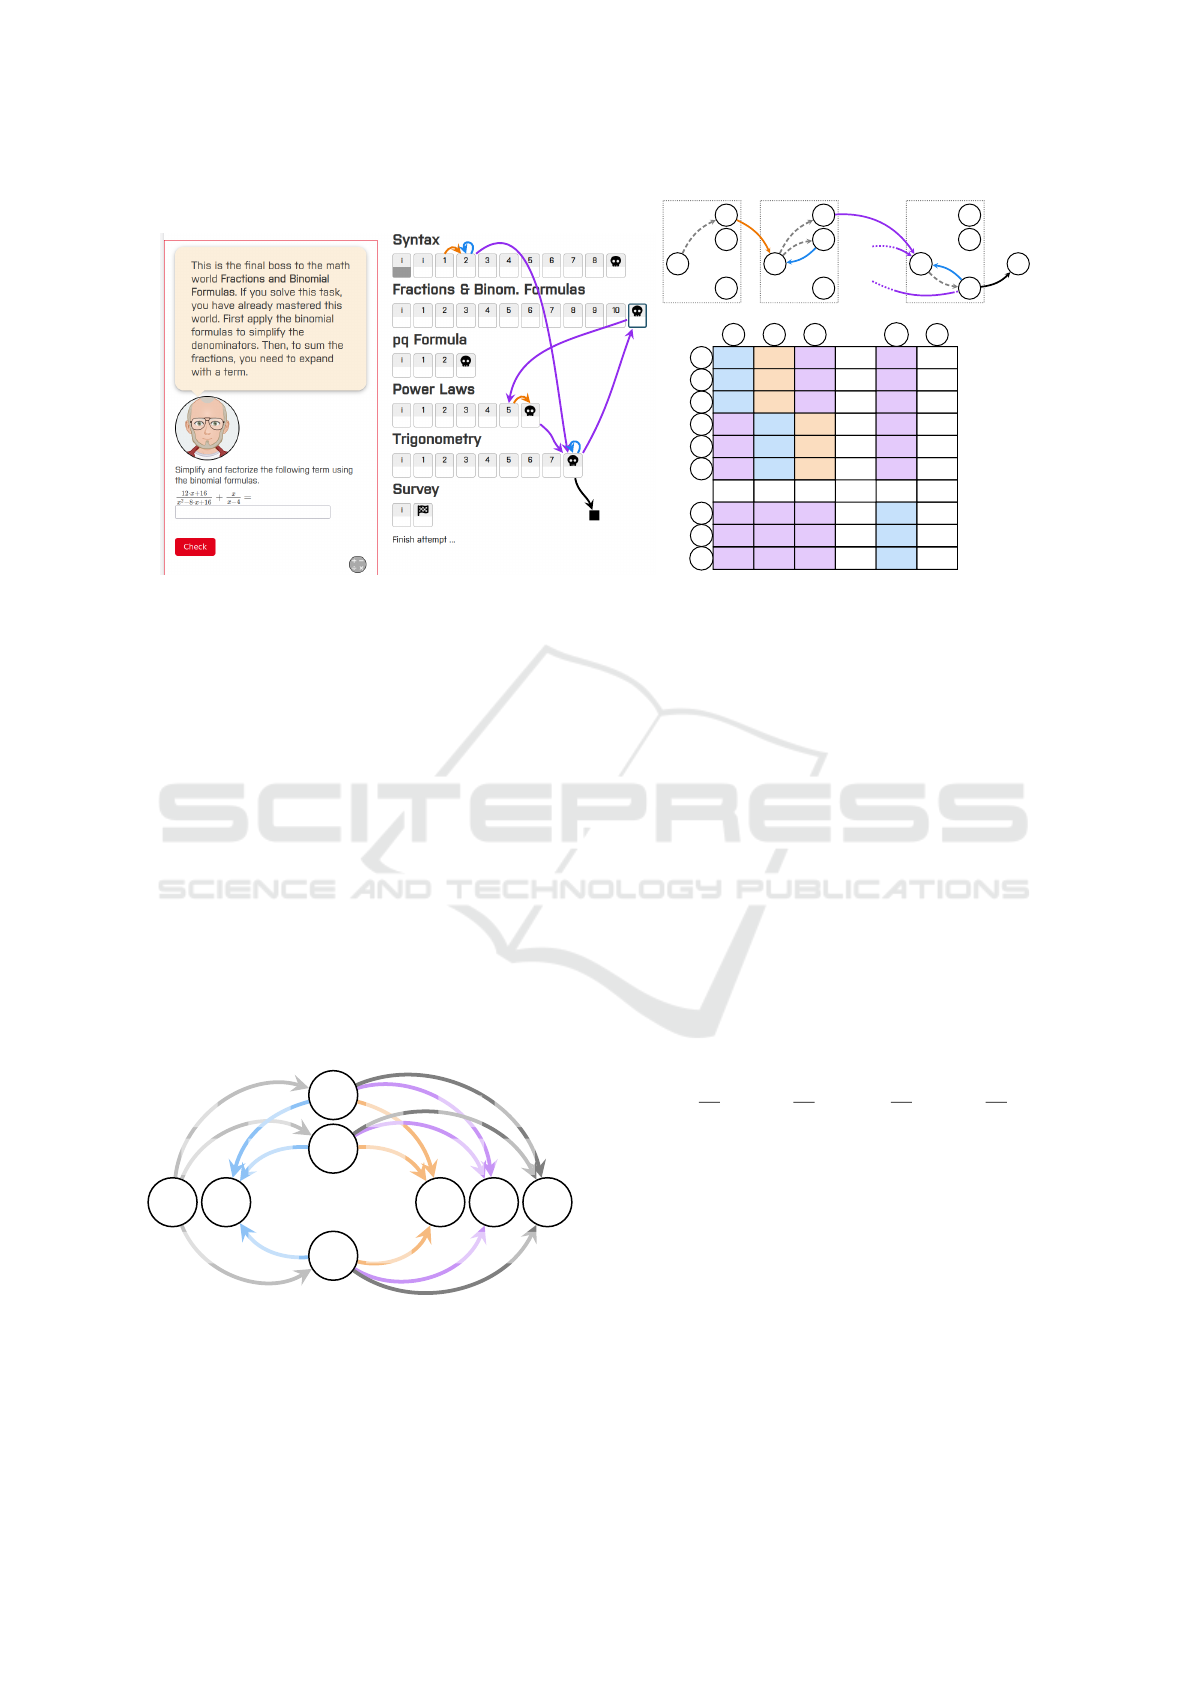
Figure 1: Screenshots of the tested versions. Left to right: Normal version (A), PA version (B), fantasy game version (C).
Figure 2: Feedback examples in design B. Left to right: Further simplification needed, naive addition, bad fraction expansion.
4.1 Learning Material
The exercises are worked on by the students in the
LMS Moodle. Learners can freely jump between the
exercises, with one semi-restriction in one exercise
design which is explained in more detail below. Each
of the tested exercise designs consists of the same set
of 61 exercises. The exercise content covers a basic
entry level for the start of the studies. The exercises
are grouped into six topics, namely (i) syntax, (ii)
fractions, (iii) binomial formulas, (iv) pq formula, (v)
power laws and (vi) derivations. The exercises within
each topic are sorted by difficulty.
After submitting a response, the students get im-
mediate feedback to their input. Each exercise can
be repeated with different numbers after at least one
response.
To showcase how the approach differentiates the
specific effects of an exercise design, one control
design (hereafter referred to as design A) is tested
against two different treatment designs (referred to as
designs B and C). The screenshots in Figure 1 give an
insight into the different designs.
Each exercise is of the STACK type (Sangwin,
2015). STACK is a plugin for LMS that allows to cre-
ate exercises where learners enter mathematical ex-
pressions with their keyboard or touchpad in the input
field as their answer. After submitting a response, the
LMS gives immediate feedback to the learners’ input,
i. e., whether correct or wrong. Thanks to the STACK
exercise type, the LMS also gives learners additional
feedback when they get trapped in a specific error pat-
tern, e. g., in case of a signage error or giving only one
possible solution where two were expected. In this
case, the exercise is counted as partially correct. How
three possible feedbacks appear in design B is shown
in Figure 2.
A JavaScript code inside the question texts of the
CSEDU 2024 - 16th International Conference on Computer Supported Education
470

Table 1: Differences in the Tested Designs.
A (LMS Default) B C
Appearance LMS default
Add PA icon to LMS
default
Wraps exercise in comic
fantasy design
Narrative None
“Solve the hardest
exercises!”
“Save the fairies!”
Feedback: Point of Time
After submitting a
response
After submitting an
intermediate step
After submitting a
response
Editable Response After
Submit
No Yes Yes
Prompt to Repeat
Exercise with Different
Numbers: Point of Time
Always after submitting
a response
Only after correct
response
Only after correct
response
Learning Path Decision Autonomous choice Autonomous choice Pay for skips with points
exercises enriches the exercises by adding design-
specific interactive elements. Thus, by making use
of a frontend-oriented software architecture (Neuge-
bauer et al., 2023), no additional plug-in is needed to
enrich the exercises. In the specific case of enriching
STACK exercises, as it is done in the present study,
the STACK plugin is needed, which is currently avail-
able for the LMS Moodle and ILIAS. See the project’s
repository (http://bit.ly/3HRpyu0) for further infor-
mation.
The exercise content as well as the feedback con-
tent is equal in the other designs. The differences with
special attention to the design and the feedback types
as described in Section 3 are described below.
4.1.1 Feedback
While the feedback content is consistent across the
designs, the ways in which it is presented differ. De-
sign A displays the feedback below the exercise text.
In contrast, design B features the feedback in a speech
bubble pinned to the PA, as shown in Figure 2. De-
sign C includes an accompanying fairy that hovers at
the bottom center of the screen and displays the feed-
back in a speech bubble attached to the fairy. All de-
signs cater to learners’ need for mastery, but while
the control design uses impersonal language, both ex-
perimental designs use personal language to create a
sense of relatedness.
Moreover, design B provides feedback after each
intermediate step, whereas designs A and C require
learners to input their mathematical answers directly.
This adds corrective feedback (F2) to design B, dis-
tinguishing it from designs A and C, which rely on
assistive feedback (F1).
4.1.2 System’s Behavior after Submit
By default (design A), the LMS gives a sample so-
lution after submitting an exercise, provides feed-
back, and allows for repeated submission with differ-
ent numbers. Once submitted, the beforehand entered
response is no longer editable. To address mastery,
the experimental designs (B & C) do not provide solu-
tions after submission. Instead, feedback is provided,
and responses remain editable, enabling learners to
adjust their responses. Mastery is addressed by pro-
viding immediate feedback that can be applied to the
still-editable response.
4.1.3 Prompt to Repeat Exercises
Consequently, the sample solution as well as the op-
portunity to repeat the exercise is not shown in the ex-
perimental designs (B & C) until learners have fully
completed the exercise. Presenting the sample solu-
tion and leaving the task editable at the same time is
unfavorable, as students could typewrite the solution.
The prompt for exercise repetition is personalized
in the experimental designs (B & C) and impersonal
in the control design (A). The LMS default is a but-
ton labeled “Try another question like this one.” In
design B, the PA suggests, “You can repeat this task
with other numbers if it gives you more confidence,”
linking to a similar exercise. In design C, a monster
turns into a fairy upon exercise completion, urging the
learner to “save my friends of the same kind before
proceeding into the forest,” aiming to fulfill learners’
need for purpose.
Efficient Learning Processes by Design: Analysis of Usage Patterns in Differently Designed Digital Self-Learning Environments
471

4.1.4 Learning Path Decision
Finally, the designs differ in how learners can move
through the exercises. In all designs learners can jump
to any of the 61 exercises, which addresses the learn-
ers’ need for autonomy. In design C learners have to
pay for each skip with points. This payment is more
symbolic in nature, as learners already have enough
points after completing the first world to be able to
reach almost all exercises. In summary, see Table 1
for the relevant differences.
4.2 Research Method
Data on learners’ usage patterns is collected and ana-
lyzed to evaluate the impact of different exercise de-
signs on their behavior. Exercises are first arranged
in a set, and then three different exercise designs are
applied to generate three separate quizzes. Each par-
ticipant is randomly assigned to one quiz, resulting in
three distinct datasets containing usage data for each
design (see Figure 3).
Version A
Quiz
Version B
Quiz
Version C
Quiz
Raw Exercise Information
Ver B
Info
Ver A
Info
Ver C
Info
Learning Data
Version C
Learning Data
Version B
Learning Data
Version A
Figure 3: By applying the designs to the tasks, three differ-
ent versions are created, which in turn results in three sets
of learning data.
In the present study, the data are automatically
collected by the LMS and are visible to the lectur-
ers by default. Just like the enrichment of exercises
as described in Section 4.1, the data extraction is also
possible without a plugin (see the project’s repository
http://bit.ly/3HRpyu0 for more information). This
data is used to visualize pathways taken inside the
quiz (Figure 4). Transition probabilities are calcu-
lated by cumulating and dividing transition amounts,
and expressed as Markov chains (Figures 5 and 7).
In order to analyze the effect of feedback and de-
signs on usage patterns, we distinguish the most obvi-
ous states and transition types. Firstly, we distinguish
transitions depending on the answer states correct,
partially correct or wrong. Moreover, we distinguish
the transition types: A transition to the sequentially
next exercise, a repetition of the same exercise or a
non-sequential transition to any other exercise (e. g.,
a later or a previous exercise). In the Markov chain
each transition is expressed as a probability, normal-
ized with respect to all outgoing transitions.
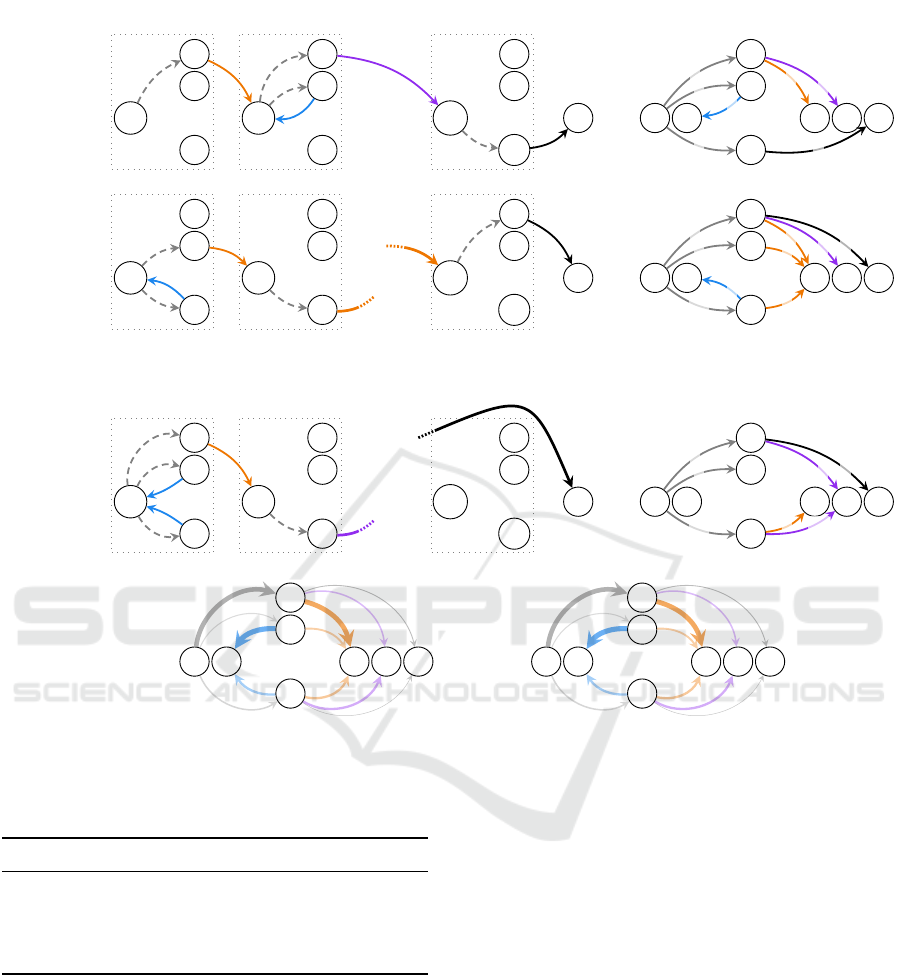
This results in a Markov chain with an input state,
three answer states and four additional states for the
transition types (Figure 5). While the three answer
states are visualized vertically as c, p and w for cor-
rect, partially correct and wrong respectively, the five
transition types are arranged horizontally, which are:
1. Initial transitions (gray) from the input node to
one of the states, mathematically referred to as T ,
2. a repetition (blue) of the same exercise, referred
to as R,
3. a movement to the sequentially next exercise (or-
ange), referred to as S,
4. a non-sequential transition (violet), called N,
5. finishing the practice session (black), referred to
as the finish state F.
To express this mathematically, let s be one of the
states c, p or w. Then A
(k)
s
i
,E
j
denotes the amount of
transitions of user k from exercise i to exercise j af-
ter leaving exercise E
i
with the state s (either c, p
or w for correct, partially correct or wrong, respec-
tively). An example of A for one user is shown in Fig-
ure 4. The total amount of correct, partially correct
or wrong responses can then be calculated by sum-
ming up all transitions from any exercise to any other
exercise with the given corresponding state s
i
, math-
ematically expressed as
∑
i, j
A
(k)
s
i
,E
j
. In doing this it is
crucial to consider a finish state F, with which the
last state is linked to. Otherwise, the last state is not
represented by an edge and thus not counted. This is
represented in Figure 4 by the link between the last
wrong state and the finish state, which corresponds to
the very last matrix entry A
(k)
w
n
,F
.
To gain the transition probabilities
¯
T
s
from the ex-
ercise input to one of the states, the absolute transi-
tions have to be summed up over all users and then
be divided by the overall amount of correct, partially
correct or wrong responses of all users. This can be
expressed by:
T
(k)
s
=
∑
i, j
A
(k)
s
i
,E
j
+
∑
i
A
(k)
s
i
,F
T
s
=
∑
k
T
(k)
s
¯
T
s
=
T
s
∑
˜s
T
˜s
(1)
We already defined that after this initial transition
the next question can take one of the following forms.
The mathematical expression is given respectively:
CSEDU 2024 - 16th International Conference on Computer Supported Education
472
E
1
c
1
p
1
w
1
E
2
c
2
p
2
w
2
E
n
c
n
p
n
w
n
F
· · ·
E
1
E
2
E
3
· · · E
n
F
c
1
0 1 0 . . . 0 0
p
1
0 0 0 . . . 0 0
w
1
0 0 0 . . . 0 0
c
2
0 0 0 . . . 1 0
p
2
0 3 0 . . . 0 0
w
2
0 0 0 . . . 0 0
.
.
.
.
.
.
.
.
.
.
.
.
.
.
.
.
.
.
c
n
0 0 0 . . . 0 0
p
n
0 0 0 . . . 0 0
w
n
0 0 0 . . . 1 1
A
(k)
=
Figure 4: Example of expressing transitions from one exercise to another for one learner. Left: state-independent as overlay
on the LMS frontend. Right: containing the different states – correct (green, c), partially correct (yellow, p) and wrong (red,
w) – and the transition types – sequential (orange), non-sequential (violet) and repetition (blue) – and the according table A
(k)
.
(R) The same question is visited again: Repetition,
mathematically expressed as A
(k)
s
i
,E
i
.
(S) Transition to the sequentially following exercise
of the given order: Sequential transition, ex-
pressed as A
(k)
s
i
,E
i+1
.
(N) Transition to another exercise, i. e., a previous
one or a later one, but not the next: Non-
sequential transition, expressed as A
(k)
s
i
,E
j
with
j ̸= i and j ̸= i + 1.
(F) Transiting to the absorbing finish state F, ex-
pressed as A
(k)
s
i
,F
.
To gain the overall transition counts we accumu-
late these expressions over all exercises and users as
mathematically expressed in the following equations.
T R
c
p
w
S N F
¯
T
c
¯
T
p
¯
T
w
¯
R
c
¯
S
c
¯
N
c
¯
F
c
¯
R
p
¯
S
p
¯
N
p
¯
F
p
¯
R
w
¯
S
w
¯
N
w
¯
F
w
Figure 5: Markov chain with transition probabilities as de-
fined in (1) and (6).
R
(k)
s
=
∑
i
A
(k)
s
i
,E
i
, R
s
=
∑
k
R
(k)
s
(2)
S
(k)
s
=
n−1
∑
i=1
A
(k)
s
i
,E
i+1
, S
s
=
∑
k
S
(k)
s
(3)
N
(k)
s
=
∑
i
∑
j̸=i
j̸=i+1
A
(k)
s
i
,E
j
, N
s
=
∑
k
N
(k)
s
(4)
F
(k)
s
=
∑
i
A
(k)
s
i
,F
, F
s
=
∑
k
F
(k)
s
(5)
By denoting O as all outgoing transitions from a
state s for all users, the overall transition counts from
(2)–(5) can be normalized to get the overall transition
probabilities (6):
O
s
= R
s
+ S
s
+ N
s
+ F
s
=
∑
i, j,k
A
(k)
s
i
,E
j
+
∑
i
A
(k)
s
i
,F
⇒
¯
R
s
=
R
s
O
s
,
¯
S
s
=
S
s
O
s
,
¯
N
s
=
N
s
O
s
,
¯
F
s
=
F
s
O
s
(6)
These probabilities are visualized using a Markov
chain (see Figure 5). Figure 6 displays the calcula-
tions visually.
4.3 Sampling & Measurement
The study took place in summer 2023 across three
universities in the same country (Bochum Univer-
sity of Applied Sciences (UAS), Westphalian UAS,
University of Wuppertal), involving n = 503 partici-
pants, primarily aged 18-21. Most were computer sci-
ence, engineering, economics, and mathematics edu-
cation backgrounds, and participants were randomly
assigned to a single design each.
Efficient Learning Processes by Design: Analysis of Usage Patterns in Differently Designed Digital Self-Learning Environments
473
E
1
c
1
p
1
w
1
E
2
c
2
p
2
w
2
E
n
c
n
p
n
w
n
FUser 1
+ + · · · +
=
E
1
c
1
p
1
w
1
E
2
c
2
p
2
w
2
E
n
c
n
p
n
w
n
FUser 2
+ + · · · +
=
E
1
c
1
p
1
w
1
E
2
c
2
p
2
w
2
E
n
c
n
p
n
w
n
FUser m
+ + · · · +
=
.
.
.
Exercise 1
.
.
.
Exercise 2
.
.
.
Exercise n
Finish
state
T R
c
p
w
S N F
T R
c
p
w
S N F
T R
c
p
w
S N F
+
+
.
.
.
+
Accumulated
2
3
1
3
1
1
1
8
2
16
9
6
2
7
2
1
6
2
20
4
6
16
1
T R
c
p
w
S N F
200
40
60
140 40 20
30 10
16 16 16 2
T R
c
p
w
S N F
.67
.13
.20
.70 .20 .10
.75 .25
.32 .32 .32 .04
m
X
k=1
· =
norm.
⇒
Figure 6: Example of summarizing exercise transitions for one design in a representative chain node by accumulating learners’
overall transitions. The summarized absolute values are used to create the resulting representative chain node.
Table 2: Overview of participant amounts.
A B C Total
Bochum UAS 52 38 49 139
Westphalian UAS 163 146 - 309
University of Wuppertal 21 21 13 55
Total 236 205 62 503
During the mathematics pre-courses the learners
were asked to practice with the learning material in a
given time slot from 20 to 30 minutes. To encourage
the universities involved to cooperate, the universities
were left to decide which of the available designs they
wanted to test. Since the university with the greatest
amount of participants decided to only test two of the
presented designs, there is far more data for the de-
signs A & B. Table 2 shows the amount of participants
by university and by design.
Before merging a single dataset out of the data
of the three universities, t-tests were performed for
each transition type to rule out significant differences
among the universities. 36 calculations were per-
formed (12 transition types respectively compared for
each university to each other) with 32 calculations
showing no significant difference (p > 0.05). Given
the few differences, the data sets were merged.
5 RESULTS
The usage patterns that emerged in three different
versions of the same mathematical exercises have
been analyzed with the help of a Markov chain based
method as presented in Section 4.2. The results are
visualized as Markov chains in Figure 7. To identify
significant differences among the designs, t-tests of
the respective transitions have been performed for the
CSEDU 2024 - 16th International Conference on Computer Supported Education
474

experimental groups against the control group
in the merged dataset.
Comparing the individual nodes with each other,
some significant differences become noticeable:
1. The experimental designs B (PA) and C (fantasy
game) show a significant rise in content repetition.
Learners are more inclined to revisit materials, es-
pecially if not initially mastered. This behavior
is especially marked in the fantasy game design,
where repetition rates are high even for correctly
solved tasks. Opting to redo exercises, learners
make fewer direct moves to the next question af-
ter a correct response, resulting in a higher total of
correct responses.
2. The occurrences of sequential transitions from
states categorized as wrong or partially correct to
the subsequent question are markedly reduced in
the experimental designs, with the fantasy game
design exhibiting the lowest such transitions.
3. Non-sequential transitions from partially correct
states to questions other than the immediate next
one are significantly diminished in both experi-
mental designs.
4. The application of assistive feedback in the PA
design leads to a significant increase in counts
of partially correct answer states. Remarkably,
learners persist in attempting to resolve questions
correctly and refrain from skipping questions at
this stage, in contrast to the plain control design
setting.
In design C exercises are repeated more often even
after correct responses. This design obviously sup-
ports a behavior that fosters automation of the tar-
geted skill. Design B allows for quicker progression
through materials, as only partially correct or incor-
rect responses trigger repetition. Furthermore, pro-
viding feedback on intermediate solutions potentially
fosters a deeper understanding here. Contrastingly,
in the control design (A), despite being Moodle’s de-
fault, an undesired behavior becomes noticeable in
comparison to the experimental designs: Learners’
skip to other exercises even after being provided with
feedback to their wrong or partially correct input.
6 DISCUSSION
The presented method may help lecturers to choose
appropriate learning materials according to their aims
throughout a semester. When introducing and train-
ing new skills, design C might be considered as a
good choice as it seems to motivate learners to deal
T R
c
p
w
S N F
.52
.14
.35
.00 .82 .14 .04
.37 .41 .16 .06
.49 .27 .17 .06
(a) Control
T R
c
p
w
S N F
.43
***
.29
***
.29
.05
***
.78 .14 .04
.88
***
.06
***
.04
***
.02
**
.71
***
.09
***
.13 .06
(b) Pedagogical Agent
T R
c
p
w
S N F
.69
***
.13
***
.18
***
.36
***
.44
***
.13
.06
**
.92
**
.01
***
.04
***
.03
**
.70
**
.07
***
.14
*
.09
(c) Fantasy Game
Figure 7: Consolidating all movements into a representa-
tive chain node per design. From T : distribution of cor-
rect / partially correct / wrong answers. To S (orange): ad-
vancing to the next sequential task. To R (blue): repeating
an exercise. To N (violet): jumping to a different exercise.
To F: ending the session. Asterisks denote significant de-
viations from the control design: * for p < 0.05, ** for
p < 0.01, *** for p < 0.001.
with similar problems several times, encouraging a
thorough acquisition of the new skills and methods.
When on the other hand lecturers aim to revisit skills
students acquired earlier, design B would be prefer-
able. By using design B, students tend to proceed
more quickly on correct responses and also repeat
when their answers do not fulfill the requirements.
This would be helpful, e. g., in preparing for an exam.
While this study sheds light on a PA design (B)
and a fantasy game (C) design – which causes multi-
ple design differences – the presented method could
also distinguish between single design changes in fu-
ture research. This could demonstrate more specifi-
Efficient Learning Processes by Design: Analysis of Usage Patterns in Differently Designed Digital Self-Learning Environments
475

cally which design difference causes what effect.
Besides this micro-testing of chosen features, fur-
ther investigation could also widen the scope by com-
paring different designs with the here presented de-
signs A, B and C. As long as it is taken into account
that learners are enabled to skip and repeat exercises,
the approach can be applied to other exercise designs
in LMS or even beyond that into other learning envi-
ronments, e. g., virtual reality learning rooms or learn-
ing games.
Our study’s findings should be cautiously inter-
preted due to its constraints. First, it was conducted
in a lecture hall under controlled conditions, akin to
a lab study, rather than in a natural self-learning set-
ting. Thus, learning materials faced no competition
from everyday distractions, leading to a more focused
engagement compared to a real-world scenario.
Second, participants had 20 to 30 minutes to com-
plete tasks, covering a syntax tutorial and some math
concepts. Therefore, the exercises set consisted of
new and probably already familiar knowledge at the
same time. For a more thorough research, longer us-
age periods that allow to distinguish between training
of new and existing skills is needed.
Additionally, exploring motivational factors is vi-
tal. The connection between our findings and specific
motivational triggers is still vague, highlighting the
need to consider students’ majors and expectations.
Continued research integrating the learning material
into actual teaching scenarios is necessary to further
clarify our knowledge in this area.
7 CONCLUSION
This work presented an approach based on Markov
chains that allows the comparison of specific effects
of different exercise designs on learners’ transitions
through a given set of exercises. The application
of the approach on usage data from students solving
mathematical exercises in LMS revealed significant
differences in the usage of two experimental designs
when compared to the use of a control design. The
specific differences in the usage patterns of the de-
signs qualify the designs to foster desired usage pat-
terns in different phases throughout a semester. While
design C supports a behavior where already acquired
knowledge is repeated, design B leads learners to pro-
ceed on correct responses while repeating exercises
more frequently when answers are partially correct or
incorrect. While the former usage pattern is desirable
when introducing new topics and skills, the latter us-
age patterns correspond to the desired behavior when
revisiting knowledge, e. g., for exam preparation.
Furthermore, the presented method has been
shown to be able to measure significant differences
between digital exercises’ designs while being robust
for use in different locations. Thus, measurement be-
yond the domain of mathematics or in systems other
than LMS are likely possible as well. Validating this
remains a task for future research.
ACKNOWLEDGEMENTS
This work is part of the Digital Mentoring project,
which is funded by the Stiftung Innovation in der
Hochschullehre under FBM2020-VA-219-2-05750.
Additionally this work was funded by Federal Min-
istry of Education and Research under 16DHB4023.
We thank all participating universities.
REFERENCES
AlQaheri, H. and Panda, M. (2022). An education process
mining framework: Unveiling meaningful informa-
tion for understanding students’ learning behavior and
improving teaching quality. Information, 13(1):29.
Anderson, L. W., Krathwohl, D. R., Airasian, P. W., Cruik-
shank, K. A., Mayer, R. E., Pintrich, P. R., Raths, J.,
and Wittrock, M. C. (2000). A Taxonomy for Learn-
ing, Teaching, and Assessing. Allyn & Bacon.
Asmussen, S. and Steffensen, M. (2020). Probability The-
ory and Stochastic Modelling, chapter 5, pages 113–
139. Springer.
Boelens, R., Voet, M., and De Wever, B. (2018). The design
of blended learning in response to student diversity in
higher education: Instructors’ views and use of differ-
entiated instruction in blended learning. Computers &
Education, 120:197–212.
Bogar
´
ın, A., Cerezo, R., and Romero, C. (2017). A survey
on educational process mining. WIREs Data Mining
and Knowledge Discovery, 8(1).
Castro-Alonso, J., Wong, R., Adesope, O., and Paas, F.
(2021). Effectiveness of multimedia pedagogical
agents predicted by diverse theories: a meta-analysis.
Educational Psychology Review, 33:1–27.
Choi, S., Lam, S., Li, K., and Wong, B. (2018). Learn-
ing analytics at low cost : At-risk student prediction
with clicker data and systematic proactive interven-
tions. Educational Technology & Society, 21(2):273.
Corbett, A. T. and Anderson, J. R. (1995). Knowledge trac-
ing: Modeling the acquisition of procedural knowl-
edge. User Modelling and User-Adapted Interaction,
4(4):253–278.
Elstner, T., Loebe, F., Ajjour, Y., Akiki, C., Bondarenko,
A., Fr
¨
obe, M., Gienapp, L., Kolyada, N., Mohr, J.,
Sandfuchs, S., Wiegmann, M., Frochte, J., Ferro, N.,
Hofmann, S., Stein, B., Hagen, M., and Potthast, M.
CSEDU 2024 - 16th International Conference on Computer Supported Education
476

(2023). Shared tasks as tutorials: A methodical ap-
proach. Proc. of the AAAI Conf. on Artificial Intelli-
gence, 37(13):15807–15815.
Emerson, A., Cloude, E. B., Azevedo, R., and Lester, J.
(2020). Multimodal learning analytics for game-based
learning. Educational Technology, 51(5):1505–1526.
Ga
ˇ
sevi
´
c, D., Dawson, S., Rogers, T., and Gasevic, D.
(2016). Learning analytics should not promote one
size fits all: The effects of instructional conditions in
predicting academic success. The Internet and Higher
Education, 28:68–84.
Guo, Y. and Goh, D. (2015). Affect in embodied pedagog-
ical agents: Meta-analytic review. Journal of Educa-
tional Computing Research, 53.
Hattie, J. and Timperley, H. (2007). The power of feedback.
Review of Educational Research, 77(1):81–112.
Irfan, M., Kusumaningrum, B., Yulia, Y., and Widodo, S. A.
(2020). Challenges during the pandemic: Use of e-
learning in mathematics learning in higher education.
Infinity Journal, 9(2):147.
Jeong, H., Biswas, G., Johnson, J., and Howard, L. (2010).
Analysis of productive learning behaviors in a struc-
tured inquiry cycle using hidden markov models. In
Educational Data Mining 2010, pages 81–90.
Kew, S. N. and Tasir, Z. (2021). Learning analytics in
online learning environment: A systematic review
on the focuses and the types of student-related an-
alytics data. Technology, Knowledge and Learning,
27(2):405–427.
Lisnani, L., Putri, R. I. I., Zulkardi, and Somakim (2020).
Designing moodle features as e-learning for learn-
ing mathematics in COVID-19 pandemic. Journal of
Physics: Conf. Series, 1657:012024.
Long, P. and Siemens, G. (2011). Penetrating the fog: An-
alytics in learning and education. Educause Review,
46(5):31–40.
Lowes, S., Lin, P., and Kinghorn, B. (2015). Exploring
the link between online behaviours and course per-
formance in asynchronous online high school courses.
Journal of Learning Analytics, 2(2):169–194.
Lu, O., Huang, A., Lin, A., Ogata, H., and Yang, S. (2018).
Applying learning analytics for the early prediction of
students’ academic performance in blended learning.
Educational Technology & Society, 21(2):220–232.
McKenzie, W. A., Perini, E., Rohlf, V., Toukhsati, S., Con-
duit, R., and Sanson, G. (2013). A blended learning
lecture delivery model for large & diverse undergrad-
uate cohorts. Computers & Education, 64:116–126.
Moraffah, B. and Papandreou-Suppappola, A. (2022). A
complete recipe for bayesian knowledge transfer: Ob-
ject tracking. Published via arXiv:2210.13232.
Neugebauer, M., Tousside, B., and Frochte, J. (2023). Suc-
cess factors for mathematical e-learning exercises fo-
cusing first-year students. In Proc. of the 15th Int’l
Conf. on Computer Supported Education.
Nguyen, T. (2015). The effectiveness of online learning:
Beyond no significant difference and future horizons.
Online Teaching and Learning, 11:309–319.
Niemiec, C. P. and Ryan, R. M. (2009). Autonomy, com-
petence, and relatedness in the classroom. Theory and
Research in Education, 7(2):133–144.
Rienties, B. and Toetenel, L. (2016). The impact of learning
design on student behaviour, satisfaction and perfor-
mance: A cross-institutional comparison across 151
modules. Computers in Human Behavior, 60:333–
341.
Ryan, R. M. and Deci, E. L. (2000). Self-determination the-
ory and the facilitation of intrinsic motivation, social
development, and well-being. American Psychologist,
55(1):68–78.
Sangwin, C. (2015). Computer aided assessment of math-
ematics using STACK. In Selected Regular Lectures
from the 12th Int’l Congress on Mathematical Educa-
tion, pages 695–713. Springer Int’l Publishing.
Schroeder, N., Adesope, O., and Barouch Gilbert, R.
(2013). How effective are pedagogical agents for
learning? A meta-analytic review. Journal of Edu-
cational Computing Research, 49:1–39.
Turnbull, D., Chugh, R., and Luck, J. (2021). Transition-
ing to e-learning during the covid-19 pandemic: How
have higher education institutions responded to the
challenge? Education and Information Technologies,
26(5):6401–6419.
Vanacore, K., Gurung, A., Mcreynolds, A., Liu, A., Shaw,
S., and Heffernan, N. (2023). Impact of non-cognitive
interventions on student learning behaviors and out-
comes: An analysis of seven large-scale experimental
inventions. In LAK23: 13th Int’l Learning Analytics
and Knowledge Conf. ACM.
Wang, Y., Gong, S., Cao, Y., Lang, Y., and Xu, X. (2022).
The effects of affective pedagogical agent in multime-
dia learning environments: A meta-analysis. Educa-
tional Research Review, 38:100506.
Wanner, T. and Palmer, E. (2015). Personalising learning:
Exploring student and teacher perceptions about flex-
ible learning and assessment in a flipped university
course. Computers & Education, 88:354–369.
Wisniewski, B., Zierer, K., and Hattie, J. (2020). The power
of feedback revisited: A meta-analysis of educational
feedback research. Frontiers in Psychology, 10.
Yudelson, M. V., Koedinger, K., and Gordon, G. J. (2013).
Individualized bayesian knowledge tracing models. In
Int’l Conf. on Artificial Intelligence in Education.
Efficient Learning Processes by Design: Analysis of Usage Patterns in Differently Designed Digital Self-Learning Environments
477
