
Oil Spill Detection Using Remote Sensing and GIS in Eastern Coast
of United Arab Emirates
Afra Al Teneiji
1,2
, Aaesha Al Mesafri
1,2
and Rami Al-Ruzouq
1,2
1
Department of Applied Physics and Astronomy, University of Sharjah, Sharjah 27272, U.A.E.
2
Civil and Environmental Engineering Department, University of Sharjah, Sharjah 27272, U.A.E.
Keywords: Remote Sensing, Geographic Information System, Oil Spill, United Arab Emirates.
Abstract: One of the most dangerous oceanic pollutions nowadays is marine oil spills, which occur when crude oil is
released into the oceanic water and must be contained quickly since they can extend to large areas and result
in serious ecological, economic, and health consequences. Places like the Gulf of Oman are highly vulnerable
to oil spill accidents due to the high marine activity there. Remote sensing and geographic information systems
(GIS) have proven their capabilities in countless fields, and detecting oil spills is one of them. This study
explores the potential of combining remote sensing and Geographic Information Systems (GIS) for oil spill
detection on the Eastern Coast of the United Arab Emirates. Leveraging Sentinel-1 SAR and Sentinel-2 optical
data, we develop and evaluate a methodology to identify oil spills. While specific accuracy assessments await
further testing, initial visual analysis indicates promising results. The study contributes to advancements in
oil spill detection by demonstrating the potential of using these remote sensing techniques in this region.
Additionally, it highlights the value of GIS integration for data analysis and visualization. This research holds
promise for improved oil spill monitoring and environmental protection efforts on the Eastern Coast of the
United Arab Emirates.
1 INTRODUCTION
Marine oil spills are a hot topic that concerns many
governments due to their comprehensive impacts.
This kind of pollution can not only disrupt wildlife
habitats, but it can also harm people's health and
affect the fishing and tourism industries as well. The
oil spill is harmful to ocean and shoreline
environments, especially in places like the Arabian
Gulf and Gulf of Oman that are exposed to such
threats due to the marine activities that take place
there. Desalination plants, fish farms, and tourism
suffer from economic drawbacks whenever an oil
spill incident occurs. To reduce the consequences of
this issue, quick and strategic solutions must be
obtained. Remote sensing and GIS are some of the
most reliable tools that are used in such
circumstances. Remote sensing is a very powerful
tool that can be employed in protecting the marine
environment and monitoring the oil spills that change
the physical and chemical qualities of the sea surface
due to its ability to cover large areas in a short amount
of time as well as functioning day and night during
different weather conditions (synthetic aperture
radars). Oil slicks form fewer rough surfaces than the
surrounding water; therefore, it is less likely for a
radar pulse to bounce back to the sensor, creating dark
spots in the images that represent the oil spill. But
these dark spots can also be caused by natural events
in the ocean, like areas with low wind speeds, weed
beds, or algae blooms. It is common to call these dark
areas "look-alikes."
Using satellite imagery to detect and monitor the
oil spill is not a new topic. Countless studies have
proven the role of remote sensing in this field. For
instance, Dhavalikar and Choudhari (2022) have
applied remote sensing techniques by using synthetic
aperture radar (SAR) images to capture, quantify, and
classify oil spills and lookalikes. They have found
that oil spills caused by moving platforms (ships or
rigs) over the Eastern Arabian Sea are greater than the
oil spill detected near the Bombay High Oil
Platforms. Evaluating the quality of the images
enables the locating of slicks and categorizing them
according to wind speed, known oil infrastructure,
and natural occurrences. Through this, Issa (2005)
was able to map marine oil pollution in the Arabian
Gulf and Gulf of Oman, create an oil spill atlas
Al Teneiji, A., Al Mesafri, A. and Al-Ruzouq, R.
Oil Spill Detection Using Remote Sensing and GIS in Eastern Coast of United Arab Emirates.
DOI: 10.5220/0012561300003696
Paper published under CC license (CC BY-NC-ND 4.0)
In Proceedings of the 10th International Conference on Geographical Information Systems Theory, Applications and Management (GISTAM 2024), pages 105-111
ISBN: 978-989-758-694-1; ISSN: 2184-500X
Proceedings Copyright © 2024 by SCITEPRESS – Science and Technology Publications, Lda.
105

offshore the United Arab Emirates, and identify over
six hundred potential spills between 1992 and 2003
using SAR and optical data. Chaturvedi et al. (2019)
demonstrated that Sentinel-1 VV polarization serves
as the most effective tool for oil spill detection.
Furthermore, Gafoor and Al Shehhi (2022) used
Sentinel-1 SAR and Sentinel-2 optical data, which
were pre-processed and analyzed using SNAP and
ArcGIS Pro software. The results of the study showed
that remote sensing and GIS are effective tools for
detecting and monitoring oil spills. The combination
of SAR and optical data was particularly effective,
and the use of band ratios from Sentinel-2 data was
useful in distinguishing oil spills from other
lookalikes. Also, Grimaldi et al. (2010) evaluated
AVHRR TIR channels 4 and 5 data and were able to
detect thin and old oil films with high sensitivity and
dependability. Kolokoussis & Karathanassi (2018)
use it in both known natural outflows and light oil
spill events. Researchers developed and evaluated
two object-based image analysis (OBIA) methods for
detecting oil spills from Sentinel-2 imagery: spectral
matching and texture analysis. Both methods were
able to detect oil spills in the Sentinel-2 imagery, with
the spectral matching method being more effective at
detecting thicker and more concentrated oil spills, and
the texture analysis method being more effective at
detecting thinner and more dispersed oil spills. Fahim
Abdul Gafoor and Maryam R. Al Shehhi (2022)
processed and analyzed Sentinel-1 SAR and Sentinel-
2 optical data using SNAP and ArcGIS Pro software.
The results of the study showed that remote sensing
and GIS are effective tools for detecting and
monitoring oil spills. The combination of SAR and
optical data was particularly effective, and the use of
band ratios from Sentinel-2 data was useful in
distinguishing oil spills from other lookalikes. Also,
Grimaldi and others (2010) evaluated AVHRR TIR
channels 4 and 5 data and were able to detect thin and
old oil films with high sensitivity and dependability.
Researchers Polychronis Kand Vassilia
Karathanassi (2018) utilized in both known natural
outflows and light oil spill events. Researchers
developed and evaluated two object-based image
analysis (OBIA) methods for detecting oil spills from
Sentinel-2 imagery: spectral matching and texture
analysis. Both methods were able to detect oil spills
in the Sentinel-2 imagery, with the spectral matching
method being more effective at detecting thicker and
more concentrated oil spills, and the texture analysis
method being more effective at detecting thinner and
more dispersed oil spills.
The eastern coast of the United Arab Emirates is an
active marine shipping area that overlooks the Gulf of
Oman, which has recorded several oil spills over the
past years; some of them were reported and others
were not. These frequent accidents must be taken into
consideration to reduce or avoid any drawbacks from
the situation. In this paper, we utilized some remote
sensing and GIS technologies that can significantly
contribute if such accidents occur. The main
objectives of this study are summarized in the
following points:
• Detection and identification of the oil spill using
Sentinel-1 SAR images.
• The oil spills were detected using Sentinel-2
band ratios.
• Indicating the size of the oil slicks.
2 STUDY AREA AND
MATERIALS
The study area covers the eastern coast of the UAE,
which has an extent of approximately 1747.6 km2,
with centroid coordinates of 56.4831371 Eo and
25.28068759 No (Figure 1). This area is known for
the marine transportation traffic that occurs there, and
this is due to the Fujairah and Khor Fakkan ports that
are located along the eastern coast. Fujairah Port is
considered the largest port in the Gulf of Oman and
the second largest bunkering hub globally (Port of
Fujairah, n.d.). In addition, Khor Fakkan Port, which
lies beyond the Strait of Hormuz on the UAE's Indian
Ocean shore, is a world leader in container
transshipment. Its advantageous location gives it the
perfect center for transhipping goods to locations in
East Africa, the Red Sea, and the upper Gulf (Ports &
Terminals, Sharjah Ports Authority, 2023). Due to
these conditions, this region is exposed to continuous
oil spill incidents that might occur from ship
accidents or intentional or unintentional oil leakage.
For instance, a large oil spill was reported on March
30, 1994, which resulted from a collision between
tanker Baynunah and tanker Seki and resulted in
16,000 metric tons spilling into the Gulf of Oman.
Then oil washed ashore about thirty kilometers of
shoreline north of the UAE port of Khor Fakkan due
to the wind and currents. The impact affected several
economically and ecologically delicate regions.
Moreover, in 2005, Fujairah Port was prohibited, and
in 2007, the UAE issued violations for pollution
caused by ships.
GISTAM 2024 - 10th International Conference on Geographical Information Systems Theory, Applications and Management
106
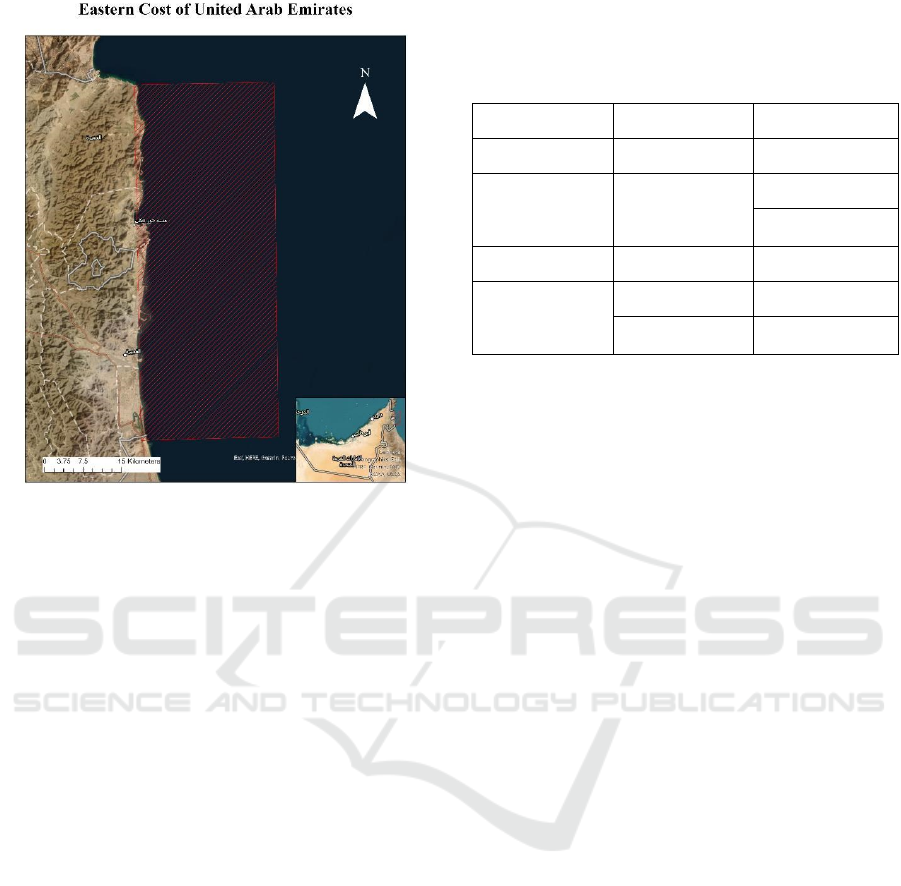
Figure 1: Study area.
3 DATA AND METHODOLOGY
3.1 Data Used
In this study, two different data sets were considered
to detect the oil spills, which are synthetic aperture
radar (SAR) and optical images from Sentinel-1 and
Sentinel-2. The data from the sites was acquired from
the Copernicus Open Access Hub and the Alaska
Satellite Facility (ASF) for different dates when the
oil spill incidents occurred. The SAR Level 1 Ground
Range data of the sites was acquired from Copernicus
Open Access Hub and Alaska Satellite Facility (ASF)
for different dates when the oil spill incidents
occurred. Detected products were used in this study
with medium resolution in IW (interferometric width)
mode, 10x10 m pixel resolution, 5.5 cm wavelength,
and 251.8 Km ground range coverage. The data was
provided in VV and VH polarization. Furthermore,
the Sentinel-2 data used was level-2A, which is
atmospherically corrected and provided in thirteen
spectral bands and different spatial resolutions (10m,
20m, and 60m), with 60m resolution bands used to
perform the analysis.
The images were collected on different dates,
depending on the date of the incident and their
availability. Table 1 shows the date when the oil
incident took place, according to the local news, and
the dates at which the available data was captured.
These incidents were caused by distinct reasons, such
as pipe leakage, ship collisions, and terrorist attacks.
Table 1: Data availability, dates, and types.
Reported Captured Type
2019-05-12 2019-05-14 Sentinel-2A
2019-10-28 2019-10-31
Sentinel-2A
Sentinel-1
2022-05-12 2022-05-13 Sentinel-2A
2022-08-22
2022-08-12 Sentinel-1
2022-08-16 Sentinel-1
Furthermore, digital elevation models of the study
area were collected from the USGS Earth Explorer,
which were used to apply the terrain corrections for
the SAR data. The DEM images are Shuttle Radar
Topography Mission Void. Filled data has a
resolution of 90 m. The images were enhanced to
complete missing data, thus providing a more
comprehensive dataset of the digital elevation model.
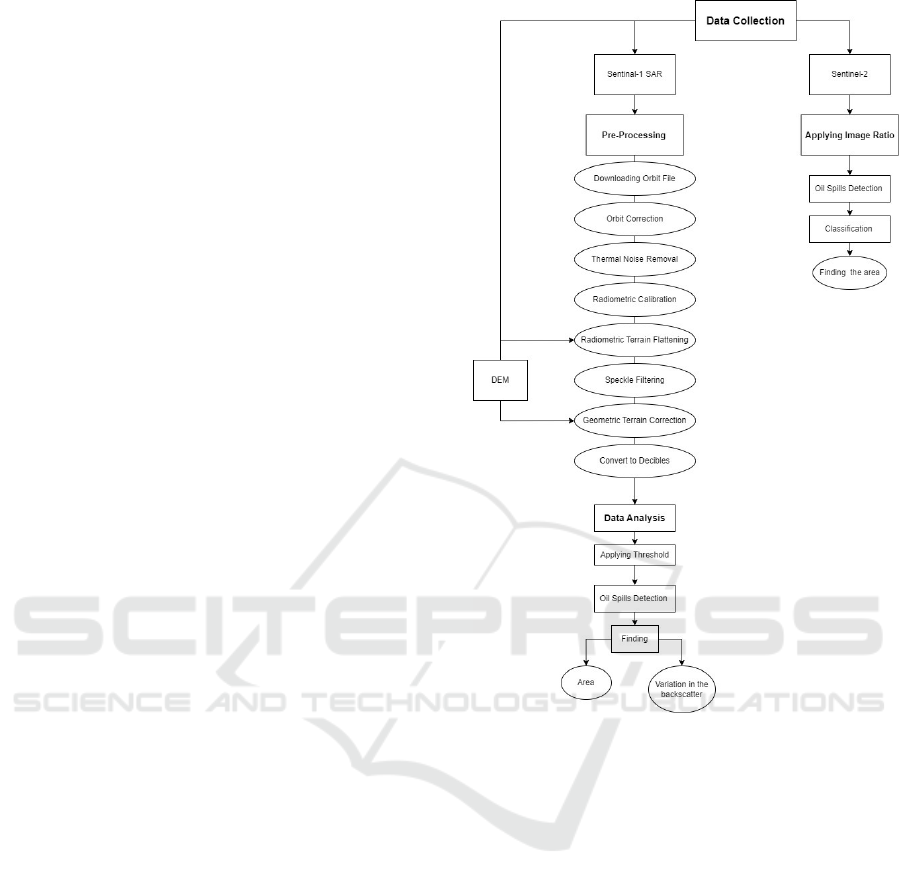
3.2 Sentinel-1 SAR Data Processing
The collected SAR images were pre-processed using
the Synthetic Aperture Radar toolset in ArcGIS Pro
software, which provides correction and processing
tools for the SAR data. The pre-processing stage
started with downloading the orbit file and applying
the orbit correction, which uses an orbit state vector
(OSV) file that is more precise for modifying the
orbital data in the SAR dataset. Then the thermal
noise will be removed to eliminate distortions caused
by noise in SAR imagery, creating a smoother and
more visually appealing image. Radiometric
calibration will be applied, where SAR reflectivity
will be transformed into calibrated normalized
backscatter values using a reference plane for
normalization. Radiometric terrain flattening will be
implemented to adjust SAR data to compensate for
radiometric variations caused by terrain variations.
Then speckle filtering will be applied using the
Despeckle tool to reduce speckle noise in SAR
imagery by eliminating the grainy or salt-and-pepper
appearance caused by coherent illumination. Next,
geometric terrain correction will be used that
transforms the distorted geometry of SAR imagery
into a map-projected coordinate system using a range-
Doppler backgeocoding algorithm. Finally, the SAR
data will be converted from linear to decibels (db).
The dB scale is the ideal choice for displaying SAR
Oil Spill Detection Using Remote Sensing and GIS in Eastern Coast of United Arab Emirates
107
images because of its logarithmic structure, which
allows it to manage big numerical values and wide
dynamic ranges with efficiency. Since SAR data
reduces the range of amplitude or intensity values,
converting it to dB units makes image interpretation
easier and improves the image's visual representation.
After the preprocessing stage is done, the data is
ready to be analysed. A threshold was implemented
on the VV band, in which the decibel values that
represent the oil slicks will be selected, which are
lower than -22 db. The pixels with these values will
be represented by a class, which will be converted
into a polygon, and further analysis will be executed,
such as measuring the surface area and the relative
variation in the backscatter intensity across the oil
slicks.
3.3 Sentinel-2A Data Processing
Next, Sentinel-2A band ratios help detect oil spills in
remote sensing imagery. We may divide two spectral
bands to show their respective intensities. This may
assist in identifying image features. First, create a
model builder to run two ratios. The first one is R:
B3/B2, G: (B11+B12)/B8, B: (B3+B4)/B2, and the
second one is R: b3/b2; G: (b3 + b4)/b2; B: (b6 +
b7)/b5. Separately, for each ratio, we will composite
three bands to get the false color or ratio band. And
for unsupervised classification, group pixels in a
picture by spectral or spatial similarity. It may extract
oil pixels from a picture by finding pixels with
comparable spectral properties to previous oil spills.
After that, convert the raster to a polygon to estimate
the size of the oil spill. The flowchart shows the
fundamental procedures used to identify oil spills
using satellite imagery.
4 RESULTS AND DISCUSSION
The oil spill incidents that were reported in the local
news were captured by the satellites either after a
number of days since the incidents occurred or before
they occurred. Some of the incidents were captured
by Sentinel 1, and others by Sentinel 2. Most of the
Sentinel-2 images contained clouds, which degraded
the quality of the image and affected the analysis.
4.1 SAR Products
The resulting SAR images were able to detect the oil
slicks very clearly in the image due to the low
backscattering intensity of the oil compared with the
features surrounding it, such as the water. Oil slicks
Figure 2: Methodology Framework.
appear as dark patches in radar imagery due to the
suppression of capillary waves, resulting in a flatter
ocean surface and reduced radar reflection (Figures
3–5) (Moreira et al., 2013). Figure 3 shows the oil
spill that resulted from the collision of two ships in
the Gulf of Oman on August 28, 2022. This accident
resulted in intensive pollution of the seawater in the
region. The resulting image shows how the oil slick
extends widely along the coast. Figure 4 shows the oil
leakage that occurred in Khor Fakkan Port; however,
there is another oil spill caused by a ship in the middle
right side of the image. Figure 5 shows the same
location as the previous image, but after four days. It
is noticeable how the extent of the oil spill increased
significantly, which creates doubts that this oil spill
was not caused by a simple leakage only, but there is
a probability that there are multiple agents in this
situation.
GISTAM 2024 - 10th International Conference on Geographical Information Systems Theory, Applications and Management
108
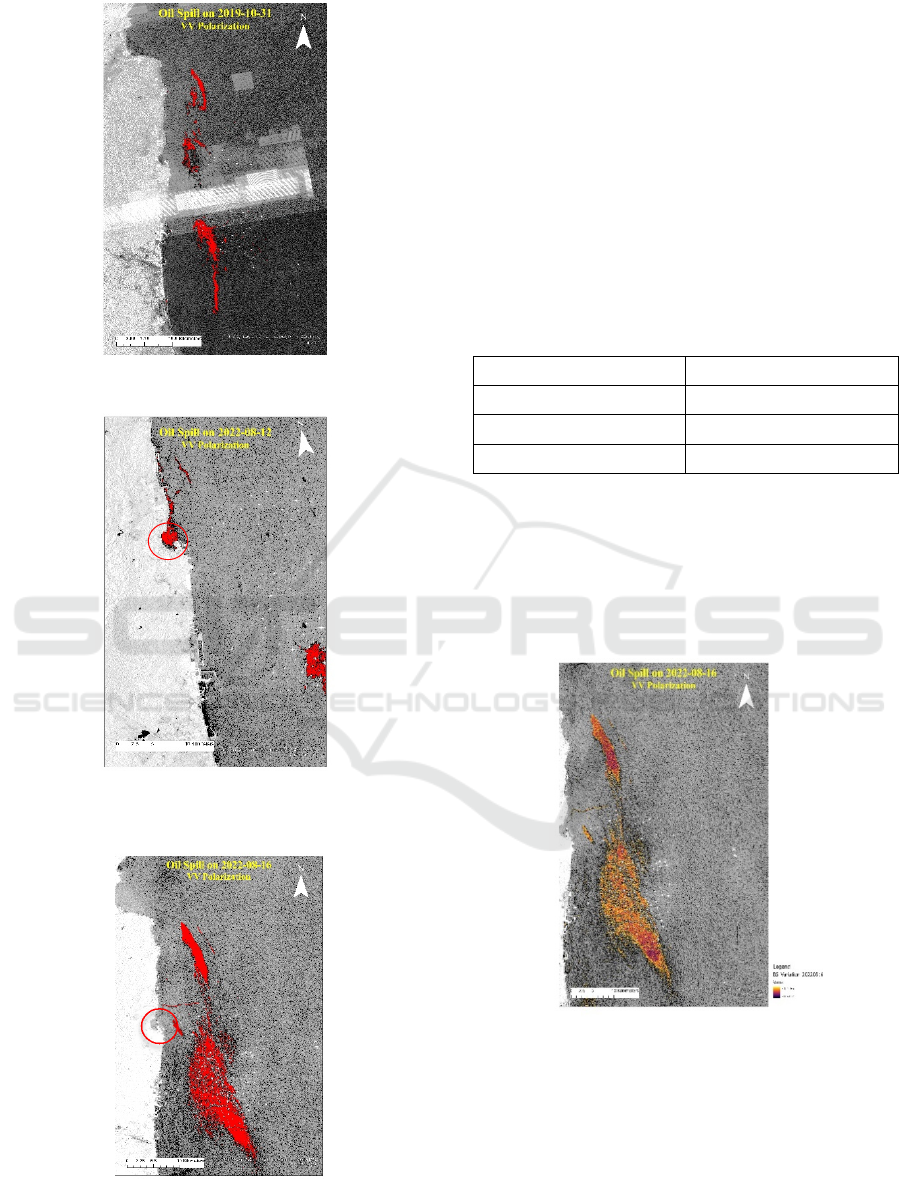
Figure 3: Oil spill detection and extraction on 2019-10-31.
Figure 4: Oil Spill detection and extraction on 2022-08-12.
The circle marks Khor Fakkan port location.
Figure 5: Oil Spill detection and extraction on 2022-08-16.
The circle marks Khor Fakkan port location.
After detecting the oil spill in the images, we
applied a binary threshold classification to extract the
oil spill features. This allowed us to estimate the
overall area of each oil slick, in which the largest
extent of oil spill was recorded on August 16, 2022,
with approximately 165 km2 of oil that extends in
front of the eastern coast of the UAE (Table 2).
Determining the extent of the oil spill can aid the
responsible authorities in creating strategies to clean
up the spills. Furthermore, the overall images show
that the oil slicks have unique shapes and textures, in
which they exhibit smooth, uniform, and continuous
texture with regular shapes (Al-Ruzouq et al., 2020).
Table 2: Overall area of each oil slick.
Incidents Area (Km
2
)
2019-10-31 54.8
2022-08-12 13.1
2022-08-16 164.9
Moreover, if the oil slick feature were extracted solely
in VV polarization, variation in the backscatter values
would be illustrated within the oil spills themselves
(Figure 6). This can pinpoint a very crucial fact: many
factors can affect the backscattering of the oil, such
as the type of oil, thickness, and weathering degree
(Garcia-Pineda et al., 2020).
Figure 6: The image shows the backscatter intensity
variation within the oil slicks.
4.2 Optical Products
According to Figure 7, the band ratio of the oil spill
on Fujairah's eastern coast shows that an oil spill was
there on October 31, 2019, May 14, 2019, and May
13, 2022. The ratio of B3/B2, (B11+B12)/B8, and
(B3+B4)/B2 shows the oil spill more clearly and
Oil Spill Detection Using Remote Sensing and GIS in Eastern Coast of United Arab Emirates
109
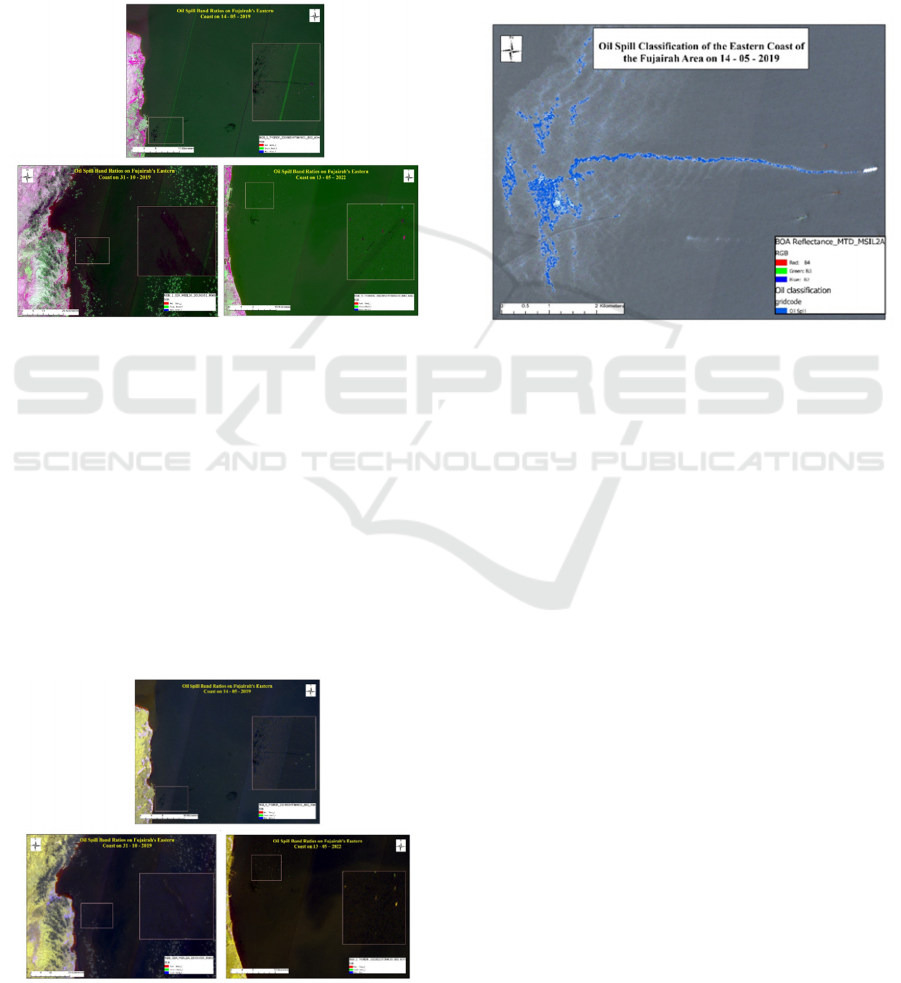
darker. These band ratios are more sensitive to oil
spills than others. It is good at reflecting near-infrared
light. Since water does not reflect much in the NIR
range, it is easy to tell the difference between oil and
water. Algae has a high reflection in the blue, green,
and red spectra, while oil has a low reflectivity in
those ranges. Also, it reflects more SWIR light in the
B11 and B12 bands than in the visible wavelengths,
and SWIR bands are less scattering-prone, making
them more vulnerable to oil spills (Diaz, 2023).
Figure 7: False Color Subset of Sentinel-2 Imagery.
While the band ratio in b3/b2; (b3 + b4)/b2; (b6 +
b7)/b5 was pale and less vulnerable to oil spills since
they are based on visible light reflectance at the same
dates, Cloud cover obstructed the determination of
the oil spill presence in the image captured on May
13, 2022. Water and suspended particles scatter
visible light, making oil spills more difficult to see.
The spectral response of the oil spill over the picture
is enhanced by using the ratio (b3 + b4)/b2, while the
ratio (b6 + b7)/b5 is used to display vegetation-related
information. Furthermore, an oil spill may be mapped
using a false-color composite of sentinel-2 (MSI), as
shown in Figure 8 (F. A. Gafoor et al., 2022).
Figure 8: False Color Subset of Sentinel-2 Imagery.
Then classify the oil spill by using the unsupervised
classification technique to identify and extract the
composite of oil pixels, which can then be utilized to
estimate the extent of surface area that has been
contaminated by the oil. The use of object-based
classifications and segmentation algorithms has the
potential to enhance the accuracy of oil slick
detection by mitigating the occurrence of false
negatives. The estimated extent of the oil leak spans
around 1.215676 square kilometres as of May 14,
2019, as presented in Figure 9.
Figure 9: Unsupervised classification technique.
5 CONCLUSIONS
Detecting oil spills on the Eastern Coast of the UAE
is a challenging task due to the intricate water
conditions, limited depth, and frequent occurrence of
cloudy weather. The careful processing and
segmentation of satellite photos are imperative to
enhance the detection of oil spills in each area. The
utilization of both synthetic aperture radar (SAR) and
optical data has proven to be effective in identifying
oil spills, with the application of band ratios derived
from Sentinel-2 data being particularly valuable in
distinguishing oil spills from similar phenomena.
According to the research findings, Sentinel-1 VV
polarization and Sentinel-2 band ratios, namely
B3/B2, (B11+B12)/B8, and (B3+B4)/B2, proved to
be very efficient in detecting oil spills. The use of
remote sensing and Geographic Information Systems
(GIS) in the realm of oil spill identification and
monitoring is gaining significance, given the
escalating occurrence of oil spills. The use of remote
sensing and Geographic Information Systems (GIS)
may provide significant insights to decision-makers
tasked with addressing oil spills and minimizing their
ecological ramifications. As a future plan, we believe
that the use of artificial intelligence and machine
GISTAM 2024 - 10th International Conference on Geographical Information Systems Theory, Applications and Management
110

learning techniques can significantly enhance the
results, generating more precise and accurate
outcomes. Furthermore, this technology can be used
to distinguish the oil spill from other lookalikes.
REFERENCES
Al-Ruzouq, R., Gibril, M. B., Shanableh, A., Kais, A.,
Hamed, O., Al-Mansoori, S., & Khalil, M. A. (2020).
Sensors, features, and machine learning for oil spill
detection and monitoring: A Review. Remote Sensing,
12(20), 3338. https://doi.org/10.3390/rs12203338
Chaturvedi, S. K., Banerjee, S., & Lele, S. (2019). An
assessment of oil spill detection using Sentinel 1 SAR-
C Images. Journal of Ocean Engineering and Science,
5(2), 116–135. https://doi.org/10.1016/j.joes.2019.09.0
04
Dhavalikar, A. S., & Choudhari, P. C. (2022). Detection
and quantification of daily marine oil pollution using
remote sensing. Water, Air, & Soil Pollution,
233(8). https://doi.org/10.1007/s11270-022-05752-0
Diaz, A. (2023, September 21). Visualizing a marine oil
spill with sentinel-2 MSI imagery. Medium. https://
medium.com/@anapau_diazg/visualizing-a-marine-
oil-spill-with-sentinel-2-msi-imagery-cb0aaa2045b
Gafoor, F. A., & Al Shehhi, M. R. (2022). Oil spill detection
and mapping using sentinel-1 and sentinel-2 in the
Arabian Gulf Coastal Waters. IGARSS 2022 - 2022
IEEE International Geoscience and Remote Sensing
Symposium. https://doi.org/10.1109/igarss46834.20
22.9883723
Garcia-Pineda, O., Staples, G., Jones, C. E., Hu, C., Holt,
B., Kourafalou, V., Graettinger, G., DiPinto, L.,
Ramirez, E., Streett, D., Cho, J., Swayze, G. A., Sun,
S., Garcia, D., & Haces-Garcia, F. (2020).
Classification of oil spill by thicknesses using multiple
remote sensors. Remote Sensing of Environment, 236,
111421. https://doi.org/10.1016/j.rse.2019.111421
Grimaldi, C. S. L., Casciello, D., Coviello, I., Lacava, T.,
Pergola, N., & Tramutoli, V. (2010). Satellite oil spill
detection and monitoring in the Optical Range. 2010
IEEE International Geoscience and Remote Sensing
Symposium. https://doi.org/10.1109/igarss.2010.5651
967
Issa, S. (2005, January). Monitoring oil spills offshore the
United Arab Emirates using multi ... Semantic Scholar.
https://www.semanticscholar.org/paper/Monitoring-Oi
l-Spills-Offshore-the-United-Arab-Data-Issa/0b17b82
d9fe8c41a4d57d6cb62d1bd3ac293c8c9
Kolokoussis, P., & Karathanassi, V. (2018). Oil spill
detection and mapping using Sentinel 2 imagery.
Journal of Marine Science and Engineering, 6(1), 4.
https://doi.org/10.3390/jmse6010004
Moreira, A., Prats-Iraola, P., Younis, M., Krieger, G.,
Hajnsek, I., & Papathanassiou, K. P. (2013, March). A
tutorial on Synthetic Aperture Radar | IEEE Journals
& Magazine IEEE Xplore. https://ieeexplore.ieee.org/
document/6504845
Port of Fujairah. (n.d.). https://fujairahport.ae/
Ports & Terminals - Sharjah Ports Authority. SPA -. (2023,
August 4). https://sharjahports.gov.ae/ports-terminals/
Oil Spill Detection Using Remote Sensing and GIS in Eastern Coast of United Arab Emirates
111
