
Squeezing the Lemon: Using Accident Analysis for Recommendations to
Improve the Resilience of Telecommunications Organizations
Hans C. A. Wienen
1
, Faiza A. Bukhsh
1
, Eelco Vriezekolk
2
, Luís Ferreira Pires
1
and Roel J. Wieringa
1
1
Faculty of Electrical Engineering. Mathematics and Computer Science, University of Twente, The Netherlands
2
Dutch Authority for Digital Infrastructure, The Netherlands
Keywords:
Accident Analysis, Telecommunications, Resilience.
Abstract:
Telecommunications networks form critical infrastructure, since accidents in these networks can severely im-
pact the functioning of society. Structured accident analysis methods can help draw lessons from accidents,
giving valuable information to improve the resilience of telecommunications networks. In this paper, we in-
troduce a method (TRAM) for accident analysis in the Telecommunication domain by improving AcciMap,
which is a popular method for analyzing accidents. The improvements have made AcciMap more efficient and
instructive by explicitly identifying ICT aspects of the accidents, extending the method to support the evalua-
tion of crisis organizations and introducing additional notation for feedback loops. This resulted in TRAM, a
method with a 25% improved efficiency over AcciMap, while also addressing ICT aspects, leading to concrete
actionable results that can help telecommunication organizations grow more resilient.
1 INTRODUCTION
Telecommunications networks are a vital part of our
society and form a critical infrastructure. Any ac-
cidents
1
that impact the availability of this infras-
tructure can have crippling effects on society, from
malfunctioning traffic control systems to unreachable
emergency services. The consequences of these acci-
dents may be broad, ranging from financial losses to
physical damage and damage to health. If emergency
services cannot be reached in time or cannot reach
their destination in time due to gridlock caused by
malfunctioning traffic control systems, this may even
result in casualties. Having resilient telecommunica-
tions infrastructure is therefore a concern of govern-
ments and they have established enforcement agen-
cies called regulators to ensure this resilience. In the
European Union, public operators of telecommunica-
tions networks and/or services are required by law to
report any large accident that results in service un-
availability to their regulator.
1
In Telecommunications, accidents are often called ‘in-
cidents’, even when they are damaging. As the common un-
derstanding in accident analysis is that anything that causes
harm (e.g. to service, hardware or people) is called an acci-
dent (Leveson, 2011; Harms-Ringdahl, 2013; U.S. Depart-
ment of Energy, 2000) and (Doytchev and Szwillus, 2009),
we use the term telecommunication accident in this paper.
Just reporting accidents does not prevent new ac-
cidents. To make sure an accident is well-understood
and appropriate measures are taken to prevent the ac-
cident from recurring, a thorough analysis must be
conducted. The results of this analysis need to be
taken into account when defining improvement ac-
tions for the appropriate organizations or organiza-
tional units concerned.
Accident analysis methods have been researched
and applied since at least 1941 (Heinrich, 1941). In
1997, Rasmussen introduced AcciMap (Rasmussen,
1997), which is an accident causation model and
analysis method that not only considers the techni-
cal aspects of an accident, but also the social con-
text. By also considering this aspect, the method ex-
plicitly recognizes that activities like training, human
resource management and organizational culture also
play a role in the development of an accident. The
combination of the technical and the social context is
called the socio-technical context. In 2009, Branford
introduced the Generic AcciMap Method (Branford
et al., 2009), which included a workflow for drawing
up AcciMap diagrams with the key players of the or-
ganization.
AcciMap has been applied in many different sec-
tors (Wienen et al., 2018), but to our knowledge not
in telecommunications. More generally, we found
few literature sources that even describe analyses of
Wienen, H., Bukhsh, F., Vriezekolk, E., Pires, L. and Wieringa, R.
Squeezing the Lemon: Using Accident Analysis for Recommendations to Improve the Resilience of Telecommunications Organizations.
DOI: 10.5220/0012562900003690
Paper published under CC license (CC BY-NC-ND 4.0)
In Proceedings of the 26th International Conference on Enterprise Information Systems (ICEIS 2024) - Volume 2, pages 149-158
ISBN: 978-989-758-692-7; ISSN: 2184-4992
Proceedings Copyright © 2024 by SCITEPRESS – Science and Technology Publications, Lda.
149

telecommunications incidents (Bukhsh et al., 2020).
We observed in a previous case study (Wienen et al.,
2019) that considering the socio-technical context to
telecommunication accidents is a useful addition to
the analysis of these accidents: by considering this
context, a company can identify latent factors that
can exacerbate accidents and malfunctioning coun-
termeasures that fail to inhibit accidents. We also
demonstrated that AcciMap, and more specifically the
Generic AcciMap Method, can be effectively applied
to telecommunications accidents. In (Wienen et al.,
2019), we reported on a case study on a DDOS attack
on a Telecommunications operator and we showed
that applying AcciMap to it yielded positive results.
That case study gave rise to improvements to the
method, resulting in an updated method that we called
TRAM (Telecommunications Related AcciMap). In
this paper we validate these improvements to the
method by applying TRAM to a second case study on
a telecommunications accident.
This paper is structured as follows: Section 2 dis-
cusses the background of this research, Section 3 in-
troduces the changes to AcciMap, resulting in TRAM,
Section 4 describes the steps in the method illustrated
by the application of the method in our case study,
Section 5 presents the results of the case study which
we discuss in Section 6, and Section 7 contains our
conclusions and suggestions for future research.
2 BACKGROUND
2.1 Telecommunications
The telecommunications domain is a highly technical
domain, under heavy competition and driven by tech-
nological progress as much as market forces (Meena
and Geng, 2022). Many telecommunications net-
works (most notably incumbent PTTs and cable oper-
ators) have been around for a long time and have been
going through many mergers, creating a large base
of legacy equipment and technology, which some-
times is not even compatible with each other. This
leads to specific problems that can render the network
more fragile than desirable. Telecommunications net-
works are strongly connected and issues propagate
very fast through that network (Pitsillides and Sek-
ercioglu, 2000). The domain is furthermore charac-
terized by strong competitiveness. Market pressure
leads to lower prices (Fernández and Usero, 2009)
and thus lower margins, and investment decisions are
driven by market share, putting stress on the distribu-
tion of scarce resources, e.g., where to invest money,
namely in maintenance or new services, or whether to
have cost reductions to provide cheaper services to the
customer. The decisions made in these circumstances
may have negative consequences for the robustness of
the services and they become visible during large ac-
cidents, so that these accidents may shed a light on
decisions made months or even years earlier.
2.2 Accident Analysis
Companies can have several reasons to analyze acci-
dents. A typical use case is improvement of stabil-
ity. This use case is concerned with preventing the
next accident, or at least preventing the previous ac-
cident from happening again (Underwood and Water-
son, 2013; Stringfellow, 2011).
There are three families of accident analysis mod-
els (Hollnagel, 2002; Hollnagel and Goteman, 2004):
Sequential, Epidemiological and Systemic. Sequen-
tial models describe accidents as a series of events;
epidemiological models add latent factors to the acci-
dent, which are factors that failed to prevent the acci-
dent or that aggravated the consequences of other fac-
tors; and systemic models finally add tight coupling to
the model, in which parts of the system are so tightly
linked that the propagation of errors or mistake can
go so swiftly that a run-away process may ensue or
a positive feedback loop can occur. Systemic models
start by modeling the context in which the accident
occurred and then describe the accident in terms of
organizational functions (Hollnagel et al., 2014) or a
systems theoretic model (Leveson, 2011).
We have selected an epidemiological model
(AcciMap) as a basis for the development of an ac-
cident analysis method that takes the specific needs
of the telecommunications domain into account.
3 TRAM
This section presents TRAM (the Telecom Related
AcciMap Method), which is the method for model-
ing and analyzing accidents in the telecom domain
that we developed by extending the Generic AcciMap
Method (Branford et al., 2009). This extension was a
result of our previous research (Wienen et al., 2019).
In this section, we also introduce the case study that
we performed to validate the method.
3.1 The Method
TRAM prescribes the steps defined in the Generic
AcciMap Method in (Branford et al., 2009), which are
shown in Figure 1, extending them with one step that
is indicated in green. We added more features to the
ICEIS 2024 - 26th International Conference on Enterprise Information Systems
150

Figure 1: TRAM steps (our addition to the Generic AcciMap
Method is in green).
method, which we describe in this section. In these
steps a diagram represents causal factors that con-
tributed to the accident, linked by arrows that denote a
causal connection, i.e. if A caused B, then an arrow is
drawn from A to B. The diagram is layered, denoting
different areas of influence for the company. The bot-
tom part of the diagram contains the outcomes, which
are the consequences of the accident. Figure 3 and
Figure 4 show an example.
Applying TRAM starts by studying the available
information and finding the relevant staff for the anal-
ysis workshops. Relevant staff have domain knowl-
edge of the different aspects of the accident, taking
the different functions in an organization into account.
Once these experts have been identified in the or-
ganization, they are invited to the accident analysis
workshop. In this workshop, the physical path (i.e.,
the technical failures that caused the accident), the
outcomes and the appropriate layer for analysis are
identified, after which the workshop participants iden-
tify causes and link them to effects, which are either
causes for further effects or outcomes. They fill the
gaps in and check the logic of the model that repre-
sents the accident. The ultimate goal of the analysis
is for the final model to generate enough insight so
that recommendations can be formulated.
Avoiding the Blame Game. In a previous case
study (Wienen et al., 2018), we spent a lot of time re-
assuring participants in the workshops that we would
not be assigning blame to them due to perceived or
actual errors they made. To prevent this from hap-
pening, we took time to address this issue at the be-
ginning of the workshop. Moreover, we also started
out by describing the physical events that led to the
accident. In this way, we started out with a discus-
sion about technical facts, which were perceived to
be neutral. This positively influenced the mood in the
session, after which discussing actions from partici-
pants became less of a threat.
Splitting up the Analysis. We observed that there
may be more than one phase in the development of
an accident. An accident can cause another accident
or a crisis that needs to be resolved. These differ-
ent phases can sometimes be described independent
of each other. If this becomes apparent during a work-
shop, it provides an opportunity to work in parallel:
divide the group into two subgroups that each treat
one of the phases. The results are then discussed
in the combined group, amended where necessary
and finalized. This parallellization makes the process
more efficient.
Describing Crisis Management. In our previous
research we also observed that a large part of the acci-
dent’s resolution time was spent managing the crisis
that ensued after the accident itself. This led us to
apply AcciMap to crisis management, trying to an-
swer the question ‘why did it take so long to resolve
the accident’. AcciMap turned out to help there as
well. After our previous work, we added a new Cate-
gory of Cause to the Organization layer, namely Cri-
sis Management, which covers the following aspects:
(i) crisis management organization absent; (ii) unclear
mandate during crisis; (iii) unclear roles and chain of
command; and (iv) inadequate facilities.
Add the ICT Layer. Telecommunications net-
works strongly depend on ICT. Both software, hard-
ware, configuration and data are relevant and sepa-
rate aspects of an IT system and they do not have
a dedicated place in the layers of the Generic Acci-
Map. Due to this strong dependence, they deserve
focus. Branford’s categories of cause only feature
hardware, which may be the most robust part of an
ICT network: software, configurations and data are
much more volatile than hardware. Hardware is only
mentioned as an aspect of Equipment and Design,
while the other aspects of that category (poor qual-
ity, defective, aging, untidy, missing or poorly main-
tained equipment or tools) strongly suggest that this
is aimed at machines and tools, not computer hard-
ware. So, these are good arguments for extending
Branford’s Categories of Cause. However, as errors
in the ICT layer lead to problems in the operational
(physical/actor) level and also influence decisions at
the organizational level, we have not added a new cat-
egory of cause to either layer, but rather introduced a
new layer with these categories of cause.
Improve Efficiency and Lead Time. Telecommu-
nications operators experience fierce competition, so
that efficiency of processes is a main business driver.
Therefore, in TRAM we aimed to make the accident
Squeezing the Lemon: Using Accident Analysis for Recommendations to Improve the Resilience of Telecommunications Organizations
151

analysis as efficient as possible. Most effort is put
into the workshops, due to their attendance. Minimiz-
ing the number of workshops has a large impact on
the total number of person-hours invested in the in-
vestigation. Splitting up the analysis and working in
parallel as mentioned before decreases the duration of
the workshop. Furthermore, by creating and review-
ing the diagrams offline (and between the sessions),
we were also able to improve the review process: the
analysts who run the analysis create the graphical rep-
resentation of the accident (the diagram) on their own
and send it out for review prior to the next workshop,
asking for review remarks before reconvening. The
researchers then process these remarks and have a re-
viewed version of the diagram available at the start of
the next workshop.
3.2 The Accident
In the accident we analysed to validate our method,
during routine maintenance on a power switch in a
telecom company in 2018, a system failure caused a
short interruption in the power supply. Power was re-
stored within a minute, but the interruption had a sig-
nificant follow-on effect.
During the accident, the power outage caused
some parts of the network to go down. Under nor-
mal circumstances, the network can deal with such
outages since it is designed with redundant parts to
compensate for them. However, due to planned main-
tenance elsewhere in the network, the fallback links
were not active. This caused a drop in capacity and
congestion in other parts of the network.
Many companies rely strongly on machine-to-
machine communication, i.e., communication be-
tween devices that runs over the GSM network. Ex-
amples are sensors for measuring water levels in
canals and rivers that send measurements from time
to time to a central control system. When a device
cannot send information, e.g., due to a network error,
it keeps retransmitting until it finally receives a confir-
mation that the information has been received by the
control system. These types of devices constitute part
of the Internet of Things (IoT) network that partially
runs over the GSM network.
The congestion caused information from the IoT
devices to be dropped, after which the devices tried
sending the information again, causing a positive
feedback loop that added even more traffic to the al-
ready congested network.
The only way to stop this cascade was to block all
devices and to release them one by one once the con-
gestion was resolved. Unfortunately, the company did
not have a clear administration, so they could not eas-
ily find which SIM cards belonged to which type of
device. Therefore, they had to disable all devices, in-
cluding regular mobile phones. This in turn caused
the roaming service to break down, so that customers
of the mobile network were not able to use the net-
work of other providers, resulting in complaints from
customers and roaming partners.
It took the company sixteen hours to completely
restore the service, with substantial financial and rep-
utation losses.
4 STEPS AND APPLICATION
This section describes the individual steps in TRAM
alongside their application to the accident.
The method uses a predefined structure for or-
dering causal factors that contributed to the accident.
This structure is drawn on a screen, whiteboard or
brown paper wall and serves as a foundation on which
the next steps are executed. The structure defines five
layers, which describe distinct types of causal factors:
1. The External Layer covers all factors external
to the organization that the organization cannot
change itself. It contains the following blocks:
(a) Government Block, covering factors like (inad-
equate) legislation or budgeting issues.
(b) Regulator Block, covering factors like (inade-
quate) enforcement of regulations.
(c) Society Block, covering factors like vandalism
and market pressure.
2. The Organizational Layer covers factors like in-
adequate risk management or training. These fac-
tors are under control of the organization.
3. The ICT Layer provides better visibility for the
critical role ICT plays in telecommunication, both
as an enabler and as a product or service. The
layer is one of our additions to the Generic Acci-
Map Method.
4. The Physical / Actor Layer describes immediate
actions and events leading to the outcomes, in-
cluding hardware malfunctioning and human er-
ror.
5. The Outcome Layer covers the (usually adverse)
outcomes of the accident, such as outage and fi-
nancial loss through missed revenue.
4.1 Workshop Preparation
To prepare for the workshop, we studied the acci-
dent reports created by the company so that we could
understand which departments were affected by or
ICEIS 2024 - 26th International Conference on Enterprise Information Systems
152

played a role in the accident. We invited 8 partici-
pants to the workshop, who were chosen to make sure
all relevant departments were represented in the work-
shop, as prescribed by the Generic AcciMap Method.
4.2 Workshop 1
In the beginning of the workshop, we introduced the
TRAM method to the participants.
Identify the Physical Path. As a first step, the
physical path of the accident was identified. The
group used notation taken from the Fault Tree Anal-
ysis method (FTA) (Lee et al., 1985) for this step
(seeFigure 2. The approach in this step is to only con-
sider the causal factors that are directly linked to the
accident and that are physical events, which means
that no actions performed by actors should be con-
sidered. The purpose of this exercise is to lay down
a common image of the accident without evoking dis-
cussions about blame. Everybody agreed on the phys-
ical events and this resulted in the diagram depicted in
Figure 2. This diagram showed that the accident ac-
tually could be considered as a combination of two
accidents: a power failure and a roaming service out-
age. This prompted us to divide the participants into
two groups, which has been another improvement
we made to the Generic AcciMap Method based on
our experience from our earlier research. After each
subgroup completed their respective diagrams on flip
over sheets, the diagrams were combined and the re-
sult was discussed with the entire group.
Identify Outcomes. In this step, the outcomes of
the accident are identified. Outcomes are the con-
sequences of the accident and they are mostly detri-
mental. The outcomes of this accident were customer
complaints and partner complaints, leading to extra
calls to the call center and reputation damage.
Identify Causal Factors. In this step, the Causal
Factors are identified. These are factors that directly
or indirectly contributed to the accident. The method
for identifying causal factors is to ask the partici-
pants to write down these factors on sticky notes. In
our workshop, we first asked the participants to write
down factors without any guidance. After around 10
minutes, we gave them a list of categories they could
use to jog their memory. TRAM uses the categories of
cause from the Generic AcciMap Method. We added
Crisis Management as an extra category since crisis
management played a crucial role in the validation of
Table 1: Categories of cause for identification of causal fac-
tors.
Government
Financial Issues
Communication & Information
Risk Management
Training
Actor Activities and Conditions
Human Resources
Physical events, Processes and Conditions
Regulatory Bodies
Equipment & Design
Auditing & Rules Enforcement
Manuals and Procedures
Crisis Management
Society
Defences
Organizational Culture
our previous research. Actually, it turned out that cri-
sis management played no role in this particular acci-
dent.
Identify Appropriate Layer. In this step, the ap-
propriate layer for the causal factor is identified by
sticking the notes to the appropriate places on the
brown paper wall. This is a physical activity that in-
vites the audience to already discuss the meaning of a
factor, increasing the quality of the factor.
Insert Causes and Links. In this step, a first draft
version of the AcciMap diagram is built by model-
ing the causal links between the different factors, e.g.,
factor A caused factor B, or factor C was one of the
contributors to factor D. After this step, the workshop
was finalized. The researchers then created the final
diagrams (Figures 3 and 4) based on the results of the
workshop.
Positive Feedback Loop. During the meeting, we
identified a positive feedback loop, as mentioned in
Section 3.2. We introduced new notation to represent
this loop and for breaking it, which we discuss in Sec-
tion 5.1.
4.3 Workshops 2 and 3
Fill Gaps and Check Logic. In this step, the re-
searchers presented the diagram they produced offline
based on the draft version created in the first work-
shop and discussed it with the participants. The aim
of this discussion was to verify the relations between
Squeezing the Lemon: Using Accident Analysis for Recommendations to Improve the Resilience of Telecommunications Organizations
153

Figure 2: The physical path of the accident.
the causal factors and the completeness of the dia-
gram. As a result, we changed some terminology and
rewrote part of the diagram to more adequately reflect
what happened. At the end of this step, we had iden-
tified 56 causal factors, resulting in the diagrams in
Figures 3 and 4.
Formulate Recommendations. After completing
the diagram, recommendations for each causal fac-
tor are formulated. This is done by considering how
to (i) prevent the causal factor from happening, com-
pletely preventing the consequence, and/or (ii) control
the causal factor during its development, diminishing
the consequence, and/or (iii) compensate for the con-
sequence of the causal factor.
We posed these questions for each causal factor,
resulting in a total of 60 recommendations.
5 RESULTS AND FINDINGS
As a result of the workshops, we drew one diagram.
Due to the size of the diagram, we split it up into
two parts, one (Figure 3) describing the power outage
and another (Figure 4) describing the roaming failure.
Due to company confidentiality, we are not allowed
to share the exact causal factors and use numbers in-
stead. The triangles are connectors which show where
the two parts need to be connected to form the com-
plete diagram of the accident.
Figure 3 shows the TRAM diagram of the power
failure. The newly added ICT layer only contains 1
causal factor, hardly justifying a layer of its own. One
causal factor (#13) can be included in two Categories
of Cause. One causal factor has a modest number
(5) of incoming links (#16). This may suggest that
it played a central role in the development of the ac-
cident, however, it is only one of four factors that link
the organization layer to the physical layer. This im-
plies that there is no clear central point of failure.
Figure 4 shows the TRAM diagram of the roaming
failure. One part of the diagram stood out: we found
a positive feedback loop which we discuss in the se-
quel. The roaming failure itself (#23) is the result of
a relatively simple cascade combined with the feed-
back mechanism. However, many factors contributed
to the long lead time of the accident (#25), which in-
dicates that solving this consequence may take a lot
of effort in different parts of the organization. The
ICT layer is much more populated that in the power
outage, namely 17 causal factors versus 1. This indi-
cates that the ICT environment played a large role in
the development (and the prolonged duration) of the
incident and the underlying data confirms this.
5.1 Feedback Loops
As part of the analysis of the roaming failure, we
discovered a positive feedback loop that exacerbated
the accident in the Company’s network. To indicate
this loop, we introduced additional notation: the loop
itself can be represented by joining the constituting
causal factors with arrows. However, in order to re-
solve the accident, an operator had to break the loop.
The link that was broken to stop the loop is indicated
with a valve symbol (▷◁). The action breaking that
link is indicated with a causal factor box (β) with a
pointer to the valve. This reparative action had its
own consequences, leading to the outcomes under γ.
Since breaking the loop was part of the resolution of
the accident (and not of the accident itself), we indi-
cate these factors with Greek letters.
5.2 ICT Layer
For the Power Outage, the addition of the ICT Layer
did not provide extra insight. For the Roaming Fail-
ure, however, the addition was very instructive, since
a large part of the diagram is related to that layer. This
also gave us the opportunity to formulate new cate-
gories of cause for this layer.
ICEIS 2024 - 26th International Conference on Enterprise Information Systems
154
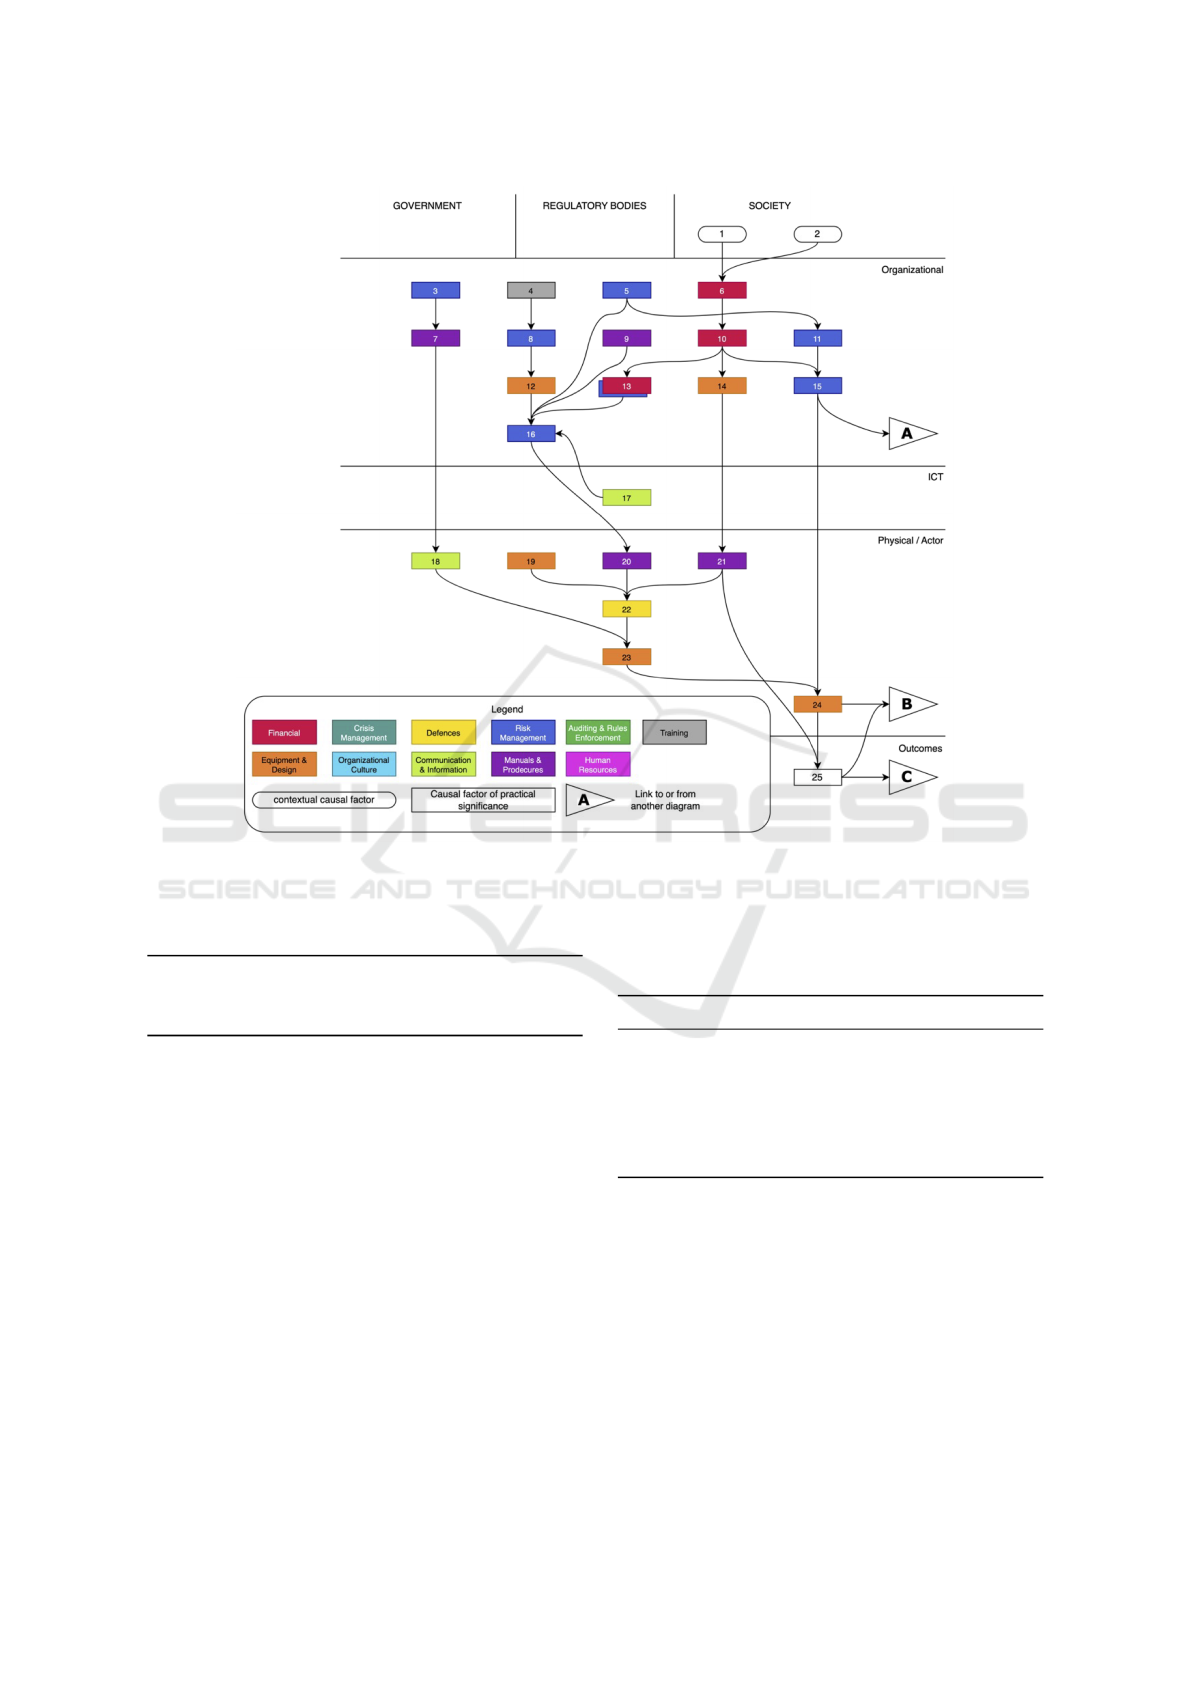
Figure 3: TRAM diagram of the power outage. Note that causal factor 13 has two colors: it fits in both categories. The
triangles labeled A, B and C are the connections to the TRAM diagram in Figure 4. The factors in both diagrams have been
numbered independent of one another. Number 13 in this diagram has no relation with number 13 in Figure 4.
Table 2: Categories of Cause for the ICT Layer.
Software Network
Hardware Configuration Management
System Management
5.3 Recommendations
For the power outage, we identified 38 recommenda-
tions. For the roaming service outage, we identified
22 recommendations. Tables 3, 4 and 5 provide more
detail about the causal factors and recommendations
we identified in our analysis. Branford’s Categories
of Cause (Branford et al., 2009) proved to be appro-
priate for our causal factors. Our proposed category
Crisis Management is absent, as this accident did not
call for an analysis of the crisis organization. The res-
olution was smooth, albeit time consuming, and did
not call for crisis management.
Table 3: Number of identified causal factors and recom-
mendations per stage and AcciMap level (Ext: External;
Org: Organizational; P/A: Physical/Actor).
Org Ext ICT P/A
Causal Factors
Power Outage 2 14 1 7
Roaming Failure 0 6 17 1
Recommendations
Power Outage 3 23 3 9
Roaming Failure 0 5 19 1
5.4 Effort and Lead Time
The total effort invested in the analysis was 114 per-
son hours (see Table 7), which is 53% of the effort
used for our previous research. This is at least in part
due to the efficiency gains we have introduced. This
brought the number of workshops and meetings down
from 5 to 3. If we measure the complexity of the acci-
dent analysis by the ratio of causal factors and causal
links between the two accidents, the improvement still
Squeezing the Lemon: Using Accident Analysis for Recommendations to Improve the Resilience of Telecommunications Organizations
155
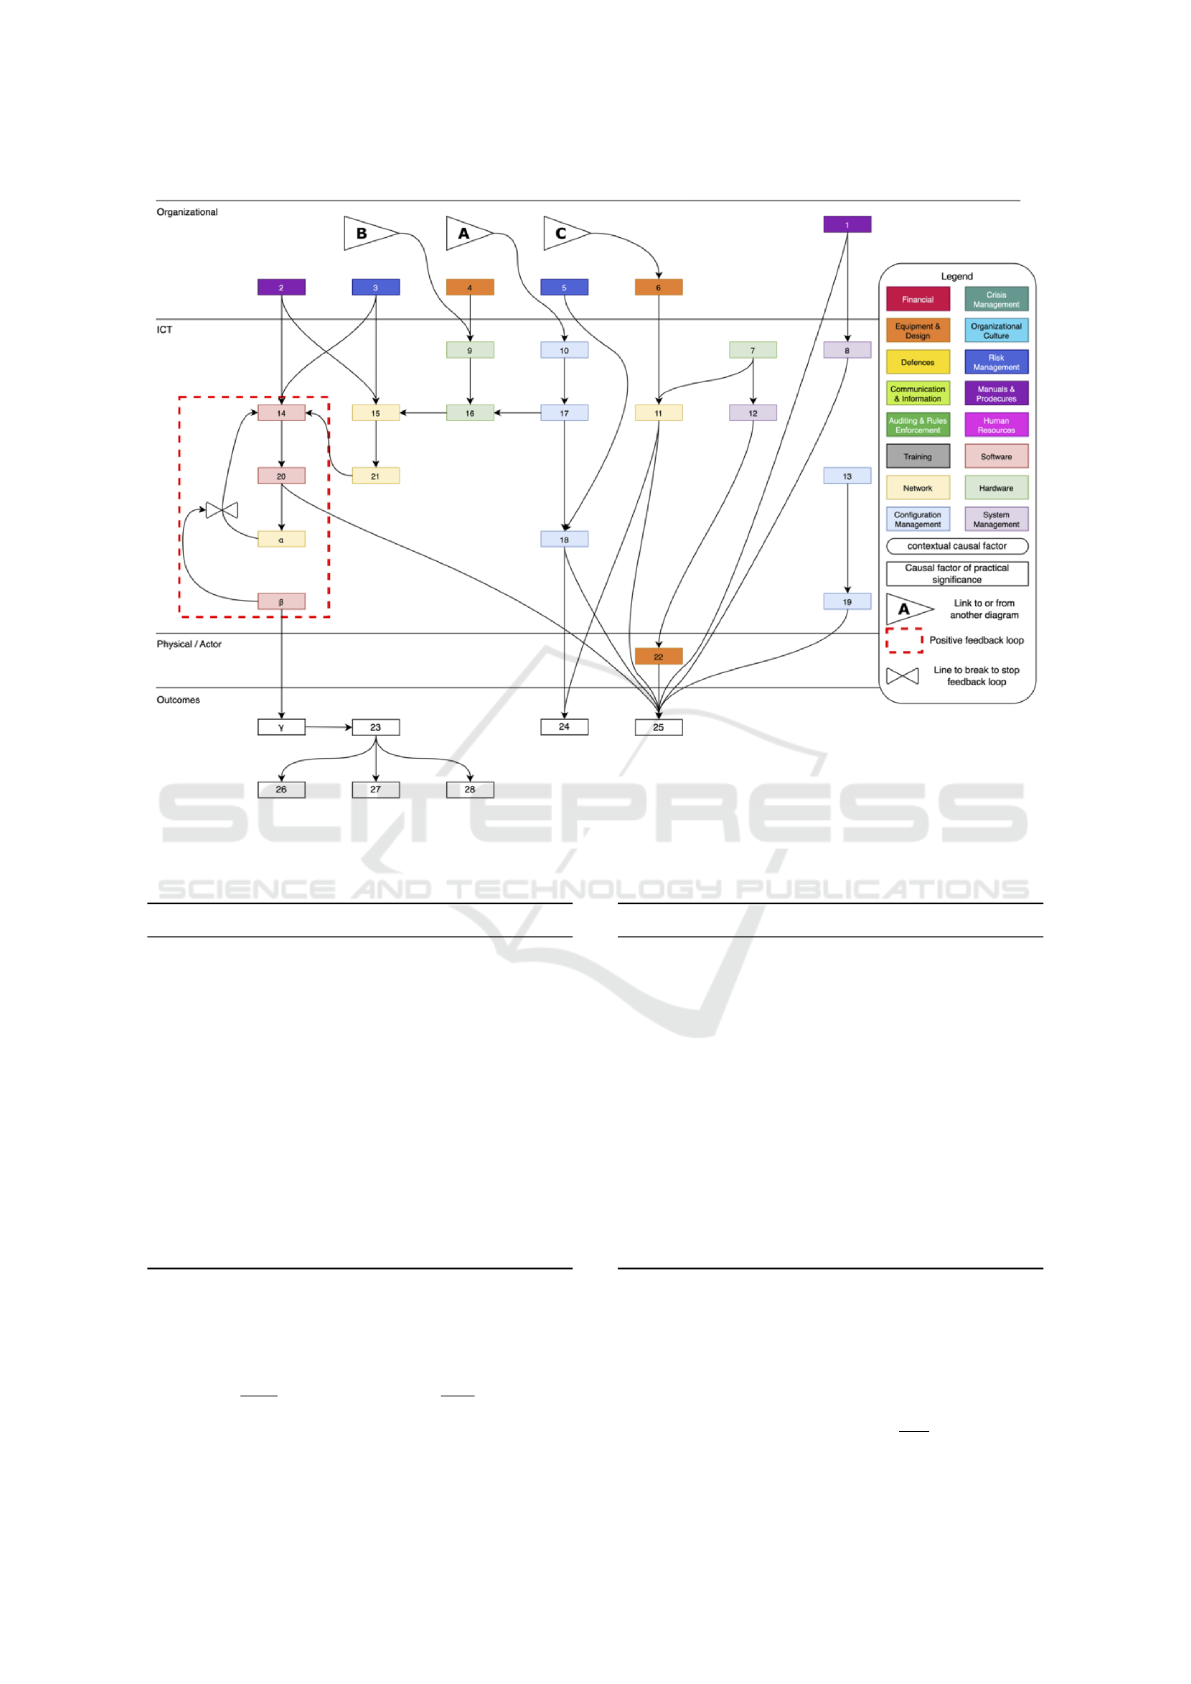
Figure 4: TRAM diagram of the roaming failure.
Table 4: Recommendations per category of cause for the
power outage (Org: Organizational; P/A: Physical/Actor).
Category of Cause Org ICT P/A
Financial 4 0 0
Equipment & Design 3 0 3
Defences 0 0 1
Communication & Information 0 0 1
Auditing & Rules Enforcement 0 0 0
Risk Management 9 0 0
Manuals & Procedures 6 0 4
Training 1 0 0
Software 0 0 0
Hardware 0 0 0
Configuration & Management 0 3 0
Systems Management 0 0 0
Network 0 0 0
Data 0 0 0
holds. If n
c f ,x
denotes the number of causal factors in
case study x and n
cl,x
the causal links, and with Q
y
the
ratio between the numbers of causal factors or causal
links (y), we have:
Q
c f
=
n
c f ,2
n
c f ,1
= 0.69; Q
cl
=
n
cl,2
n
cl,1
= 0.72
This would imply that case study 2 was about 30%
Table 5: Recommendations per category of cause for the
roaming failure (Org: Organizational; P/A: Physical/Actor).
Category of Cause Org ICT P/A
Financial 0 0 0
Equipment & Design 1 0 1
Defences 0 0 0
Communication & Information 0 0 0
Auditing & Rules Enforcement 0 0 0
Risk Management 1 0 0
Manuals & Procedures 3 0 0
Training 0 0 0
Software 0 0 0
Hardware 0 3 0
Configuration & Management 0 4 0
Systems Management 0 9 0
Network 0 3 0
Data 0 0 0
less complex than case study 1, but took 47% less
time. Correcting for the lower complexity by mul-
tiplying the time spent on case study 1 (t
1
) by 0.7 (the
factor by which accident 2 is less complex), this still
yields an improvement of 25%:
t
1,corr
= 0.7 · t
1
= 151 hrs;
114
151
= 0.75
ICEIS 2024 - 26th International Conference on Enterprise Information Systems
156

Table 6: Relevant measurements from the first case study as
reported in (Wienen et al., 2019) and this case study; t de-
notes the time invested in the case study; n
c f
is the number
of causal factors and n
cl
the number of causal links. For the
time invested in case study 2, See also Table 7.
case study t n
c f
n
cl
1 216 81 95
2 114 56 68
6 DISCUSSION
We introduced three new elements when designing
TRAM: the ICT layer (with its Categories of Cause),
the Physical Path and the Crisis Management Cat-
egory of Cause. We also introduced efficiency im-
provements. During the execution of the current case
study, we observed that the addition of the ICT layer
provided more insight into the accident. The high
number of causal factors show that ICT aspects play
a very important role in the roaming failure.
The addition of the ICT layer gave us the oppor-
tunity to formulate new Categories of Cause for this
layer. These categories are now determined by the
accident we analyzed. They were sufficient and not
too detailed for this accident. Based on our findings,
we anticipate they may prove equally useful for other
accidents. If this list is adequate or if it needs to be
adapted is a subject for future research.
Starting with the physical path helped in two as-
pects: it showed that the accident was actually a com-
bination of two accidents, enabling us to split up the
group and it set the scene for a constructive discus-
sion, since the group agreed on the physical steps for
the accident and thus had an early success. The dis-
cussions during the rest of the workshops were fo-
cused on substance and we only had to direct the dis-
cussion away from blame a small number of times.
This accident did not feature the Crisis Manage-
ment Category, so we were not able to assess its use-
fulness.
During the analysis, we identified a behaviour pat-
tern that TRAM had not yet taken into account: the
positive feedback loop. A result of the current case
study is additional notation to represent this pattern.
The efficiency measures (splitting the groups, do-
ing offline work) had a positive result on the effort put
into the analysis, since it took 25% less effort than
our previous research after correcting for complexity.
However, this conclusion is only based on the differ-
ence in these two case studies. More analyses need to
be done to get statistically significant results.
Experts’ Opinion
The company concluded that “This method is a good
method for accident analysis in the Telecommunica-
tions domain and that it contributes to finding im-
provements. The case study has led to a number of
changes in the company, under which the planning of
an annual Business Continuity Management (BCM)
test. The discussions in making the diagram itself
were essential in formulating the right improvements.
The explicit principle of no blame has led to the com-
plete set of insights and improvements.”
7 CONCLUSION
We performed this case study to validate the changes
we made to AcciMap when developing TRAM. Based
on this case study, we conclude that our improve-
ments to AcciMap are useful. By adopting the princi-
ple of no blame and by starting out from a pure phys-
ical perspective, the participants were able to steer
away from discussions about blame, leading to a com-
prehensive set of insights and improvements. The ad-
dition of the ICT layer led to more specific recom-
mendations in the ICT domain, which is pertinent to
telecommunications.
Splitting the group helped conducting the work-
shops more efficiently, as did the offline generation of
the diagram and review. This yielded an improvement
of 25% after correcting for complexity.
The recommendations from the method were ac-
tionable: several have already been implemented and
the company believes they have already led to re-
silience improvements.
We were able to improve TRAM itself as well,
since the addition of notation to represent the feed-
back loop gives more insight in runaway processes.
It provides insight into ways of breaking the loops.
Introducing these controls into the operation of an or-
ganization will enable that organization to break the
loop in a more controlled way, leading to a more ro-
bust and resilient operation.
Future research will determine whether and to
what extent we can enhance the method’s efficiency
even further. Gathering more data to fill out the cat-
egories of cause for the ICT layer is another area to
investigate.
Additionally, creating a systematic way to prior-
itize recommendations will help companies plan im-
provement programs more effectively. Recommenda-
tion prioritization is another open research direction.
The results of this research are limited by the vali-
dation being based on one case study, which makes it
Squeezing the Lemon: Using Accident Analysis for Recommendations to Improve the Resilience of Telecommunications Organizations
157

Table 7: Time invested in this case study was only 53% of the time invested in our previous case study: 114 person hours
versus 216 (Wienen et al., 2019).
activity duration (hrs) participants person hours
Company Researchers
workshop I 4 8 2 40
workshop II 4 7 2 36
workshop III 3 5 1 18
preparations 4 - 2 8
reporting 12 - 1 12
total 114
harder to generalize the conclusions. Another limita-
tion is that it is hard to compare accidents of different
complexities. We have chosen to measure the com-
plexity by comparing the numbers of causal factors
and causal links. Future research may show whether
this is an appropriate way of quantifying the complex-
ity of accidents.
REFERENCES
Branford, K., Naikar, N., and Hopkins, A. (2009). Guide-
lines for accimap analysis. In Hopkins, A., editor,
Learning from High Reliability Organisations. CCH
Australia Ltd.
Bukhsh, F. A., Vriezekolk, E., Wienen, H. C. A., and
Wieringa, R. J. (2020). Availability incidents in the
telecommunication domain: A literature review. Tech-
nical report, DSI.
Doytchev, D. E. and Szwillus, G. (2009). Combining task
analysis and fault tree analysis for accident and inci-
dent analysis: A case study from bulgaria. Accident
Analysis & Prevention, 41(6):1172—1179.
Fernández, Z. and Usero, B. (2009). Competitive behavior
in the european mobile telecommunications industry:
Pioneers vs. followers. Telecommunications Policy,
33(7):339–347.
Harms-Ringdahl, L. (2013). Guide to safety analysis for ac-
cident prevention. IRS Riskhantering AB, Stockholm.
Heinrich, H. W. (1941). Industrial accident prevention: a
scientific approach. New York & London: McGraw-
Hill Book Company, Inc., first edition edition.
Hollnagel, E. (2002). Understanding accidents-from root
causes to performance variability. In Proceedings of
the IEEE 7th Human Factors Meeting.
Hollnagel, E. and Goteman, O. (2004). The functional res-
onance accident model. Proceedings of cognitive sys-
tem engineering in process plant, 2004:155—161.
Hollnagel, E., Hounsgaard, J., and Colligan, L. (2014).
FRAM - the Functional Resonance Analysis Method :
a handbook for the practical use of the method. Centre
for Quality, Region of Southern Denmark.
Lee, W. S., Grosh, D. L., Tillman, F. A., and Lie, C. H.
(1985). Fault tree analysis, methods, and applica-
tions - a review. IEEE Transactions on Reliability,
R-34(3):194—203.
Leveson, N. G. (2011). Engineering a Safer World: Systems
Thinking Applied to Safety. Engineering Systems.
Meena, M. E. and Geng, J. (2022). Dynamic competition in
telecommunications: A systematic literature review.
SAGE Open, 12(2):21582440221094609.
Pitsillides, A. and Sekercioglu, A. (2000). Congestion con-
trol. In Computational Intelligence in Telecommuni-
cations Networks, pages 109–158. CRC Press.
Rasmussen, J. (1997). Risk management in a dynamic so-
ciety: A modelling problem. Safety Science, 27(2-
3):183–213.
Stringfellow, M. V. (2011). Accident Analysis and Hazard
Analysis for Human and Organizational Factors. PhD
thesis, Massachusetts Institute of Technology.
Underwood, P. J. and Waterson, P. E. (2013). Accident anal-
ysis models and methods: guidance for safety profes-
sionals. Technical report, Loughborough University.
U.S. Department of Energy (2000). Conducting accident
investigations - revision 2.
Wienen, H. C. A., Bukhsh, F. A., Vriezekolk, E., and
Wieringa, R. J. (2018). Learning from accidents: A
systematic review of accident analysis methods and
models. International Journal of Information Systems
for Crisis Response and Management (IJISCRAM),
10(3):42–62.
Wienen, H. C. A., Bukhsh, F. A., Vriezekolk, E., and
Wieringa, R. J. (2019). Applying generic accimap to
a ddos attack on a western-european telecom opera-
tor. In Proceedings of the 16th ISCRAM Conference,
pages 528–535.
ICEIS 2024 - 26th International Conference on Enterprise Information Systems
158
