
Seasonal Water Quality Assessment Using Remote Sensing in
Al Rafisah Dam, United Arab Emirates
Afra Bint Abdulla Alserkal
1
, Amel Ahmed Alblooshi
1
and Rami Al-Ruzouq
2
1
Department of Applied Physics and Astronomy, University of Sharjah, Sharjah, U.A.E.
2
Civil and Environmental Engineering Department, University of Sharjah, Sharjah 27272, U.A.E.
Keywords: Remote Sensing, Water Quality, Turbidity, Chlorophyll-a, Total Suspended Matter, Colour Dissolved
Organic Matter, Sentinel-2.
Abstract: Water bodies differ in their chemical, biological and physical properties. These properties determine their
quality, and sequentially, their applications. Conventional surface water quality analysis involves timely,
costly, and intensive field and laboratory work. Remote sensing coupled with a geographic information
management system (GIS) can offer an alternative to estimating water quality in remote or inaccessible
locations. The main objectives of this study are to estimate chlorophyll-a, colour dissolved organic matter
(CDOM), total suspended matter (TSM) and turbidity using remote sensing methods and to display them in
temporal distribution maps. In this research, quantitative methodology was used to calculate the four water
quality parameters using Sentinel-2 images of the Al Rafisah Dam in Sharjah, United Arab Emirates during
the months of February, April, August and December of 2021. The Case 2 Regional Coast Colour (C2RCC)
processor in the Sentinel Application Platform (SNAP) developed the equations and performed the
calculations for chl-a, CDOM and TSM. ArcGIS Pro software was used for estimating turbidity with the
normalized difference turbidity index (NDTI), as well as creating the spatio-temporal distribution maps.
Overall comparative evaluation of the concentration patterns showed that the parameters selected for the study
are interrelated, yet may vary depending on seasonal variations and human activities. Water quality research
using remote sensing and GIS plays an important role in encouraging researchers to conduct more studies in
unattainable sites or understudied areas such as the Al Rafisah Dam.
1 INTRODUCTION
Water bodies differ in their chemical, biological and
physical properties. These properties determine their
quality and their applications. Optical parameters of
water quality include chlorophyl-a, colour dissolved
organic matter, total suspended matter, and turbidity,
which can affect water clarity, colour or algal content.
Salinity, dissolved oxygen (DO), temperature, etc., on
the other hand are non-optical parameters that do not
necessarily affect the appearance (KC et al., 2019).
The main targets of this research are to (1) use
appropriate satellite data to monitor water quality
parameters of the study area, (2) to identify water
quality parameters to be studied as per the study site
and available data, and (3) to evaluate the results of
the parameters based on the seasonal variations.
Contamination of water bodies is rampant due to a
combination of natural and human-induced factors.
Monitoring water quality is critical to the continual
existence of flourishing life and healthy environments,
especially because water is largely utilised for
drinking, recreation and agriculture (Khan et al., 2021).
Since the emergence of remote sensing, there have
been various applications and usages of satellite-
retrieved images. A topic that is being increasingly
researched nowadays is the use of remote sensing in
assessing the quality of water. Satellite earth
observation data may be utilised to overcome the
constraints of traditional water quality
methodologies. Conventional surface water quality
analysis involves timely, costly, and intensive field
and laboratory work. Remote sensing coupled with
GIS offers an alternative method to the estimation of
water quality parameters in remote locations or where
field samples have not been gathered.
Remote sensing is beneficial for long term
investigations. Several studies have found that
charting and observing water quality can help
112
Alserkal, A., Alblooshi, A. and Al-Ruzouq, R.
Seasonal Water Quality Assessment Using Remote Sensing in Al Rafisah Dam, United Arab Emirates.
DOI: 10.5220/0012563900003696
Paper published under CC license (CC BY-NC-ND 4.0)
In Proceedings of the 10th International Conference on Geographical Information Systems Theory, Applications and Management (GISTAM 2024), pages 112-119
ISBN: 978-989-758-694-1; ISSN: 2184-500X
Proceedings Copyright © 2024 by SCITEPRESS – Science and Technology Publications, Lda.
improve regional and largescale assessments
(Abdullah et al., 2017; Acharya et al., 2019, Mucheye
et al.,2022; Suet al., 2008).
Seleem et al. (2022) adopted the Case 2 Regional
Coast Colour (C2CRR) atmospheric correction
method to monitor the physical features of various
water parameters such as chl-a, TSM and aquatic
reflectance. Satellite data was used to investigate
seasonal variance by comparing water quality over
the dry and wet seasons.
Furthermore, a new era of spaceborne
hyperspectral imaging has just begun with the recent
availability of data from PRISMA launched by ASI.
Niroumand-Jadidi et al. (2020) makes use of
PRISMA level 2D imagery that were tested for their
ability to retrieve typical water quality measures such
as TSM, chl-a and CDOM. In their findings, they
show that PRISMA level 2D imagery has a strong
potential for mapping water quality indicators.
Another study made use of Sentinel-3/2 and
Landsat-8 to retrieve chl-a, TSM, CDOM in various
water types in Egypt. The study validated the
usefulness of the visible and near-infrared (NIR)
bands in predicting chlorophyll-a in waters. Using the
C2RCC, the concentration of chl-a in the visible and
NIR wavelengths revealed the amount of algae in the
region (Masoud, 2022).
A paper by Ouma et al. (2020) also used Sentinel-
2 to determine the same water quality parameters for
the Chebara Dam in Kenya. They concluded that the
satellite is capable of monitoring inland waterways
and reservoirs for water quality.
Many studies have shown that the remote sensing
approach can be used to estimate and predict the
levels of turbidity, DO, chl-a, and heavy metals in
water using Machine Learning (ML) Algorithms.
These include the supervised processes; support
vector machine and artificial neural networks, and
unsupervised processes; principal component
analysis. Ma et al. (2021) investigated turbidity of
lakes by using Sentinel-2 satellite images with ML.
Water quality mapping utilising GIS and remote
sensing is critical in today's environment. It is an
effective instrument for environmental monitoring,
resource management, public health, and scientific
study. These technologies help to make educated
decisions, conserve ecosystems, provide clean
drinking water, respond to emergencies, and build
successful policies by delivering reliable, real-time
data on water quality. In an era when water resources
are being threatened by pollution, climate change, and
rising demands due to growing populations, the
capacity to map and analyse water quality geogra-
phically and temporally is critical for the long-term
management and protection of this crucial resource.
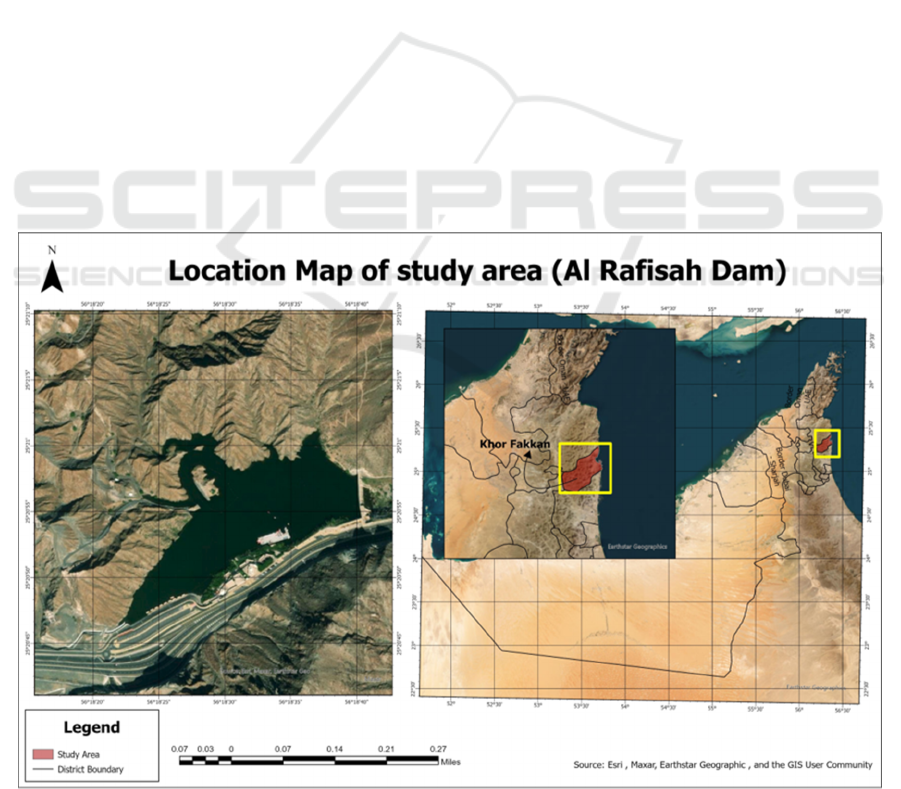
Figure 1: Study Area
Seasonal Water Quality Assessment Using Remote Sensing in Al Rafisah Dam, United Arab Emirates
113

The main objectives of this study are (1) to
estimate chlorophyll-a, colour dissolved organic
matter (CDOM), total suspended matter (TSM) and
turbidity from Sentinel-2 images of Al-Rafisah Dam
using ArcGIS Pro and Sentinel Application Platform
and (2) to display them in spatio-temporal distribution
maps for evaluation and comparison.
Water quality distribution maps will show the
spatial distribution and temporal results of chl-a,
CDOM, TSM and turbidity values in different months
of 2021. These parameters were chosen due to their
applicability and extensive use in remote sensing
applications (Bangira et al., 2024 ; Virdis et al., 2022).
2 STUDY AREA
The study area selected for the project is the Al
Rafisah Dam in Sharjah, United Arab Emirates,
shown in Figure 1. It is located along Sharjah-Khor
Fakkan highway between Al-Hajar Mountains that
runs down to the city of Khor Fakkan on the east coast
of Sharjah with coordinates 25° 21′ 0″ N, 56° 18′ 0″
E. It has an area of 10684 m2. Its elevation is roughly
at around 197 meter or 649 feet.
Al Rafisah Dam is an area rich in local flora and
fauna, and attracts many visitors during trips within
the country. Visitors of the dam can take part in a
number of touristic activities. Surrounding the site are
several eateries, archaeological spots, and a hiking
trail. Aside from offering spectacular views, the
waterbody is used for boating activities and kayaking.
This paper focuses on assessing water quality in
Al Rafisah Dam because it is an unprecedented
subject matter that has not yet been investigated.
3 DATA USED
Given that several previous studies relied on Sentinel-
2 satellite imagery to monitor and estimate water
quality parameters, it was chosen as the primary data
source for this research. Copernicus Open Access
Hub was used to download Sentinel-2 Level 1C
imagery containing the Al Rafisah Dam (Table 1).
The criteria used to locate images of the dam included
S2MSI1LC as product type and 5% of cloud coverage
within the year 2021. Four dates were used to
compare the results between the months of February,
April, August and December.
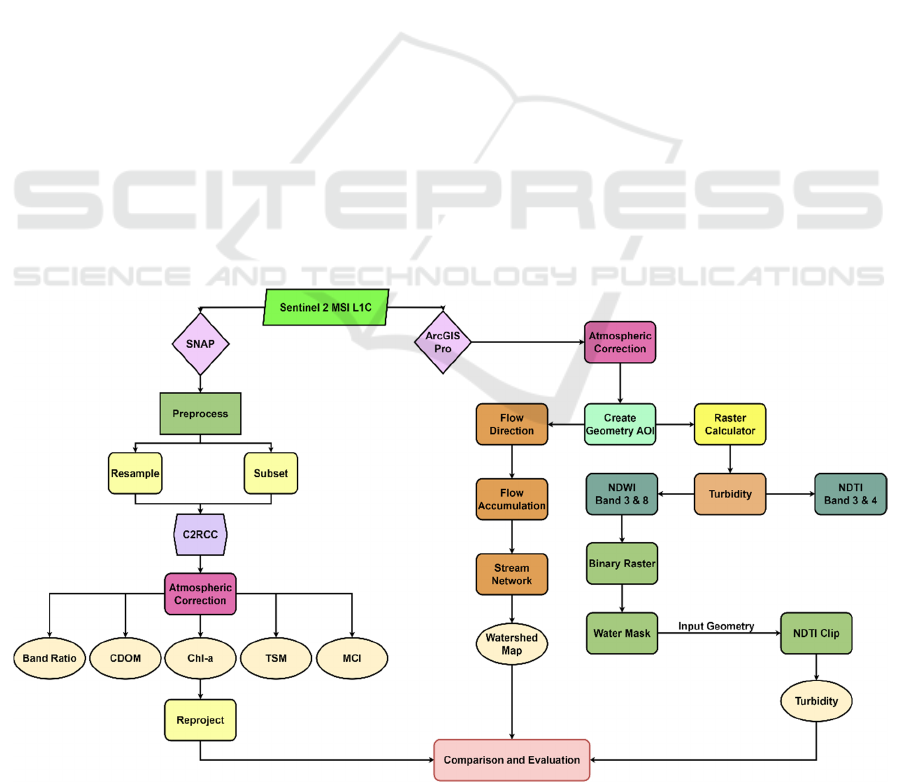
4 METHODOLOGY
In this research, quantitative methodology involving
deep learning equations and numerical indices were
used to evaluate the chlorophly-a, CDOM, TSM and
turbidity of Sentinel-2 images in Al Rafisah Dam.
The programs utilized were ArcGIS pro version 3.1.0
and Sentinel Application Platform (SNAP). The Case
2 Regional Coast Colour (C2RCC) processor in the
Sentinel Application Platform (SNAP) developed the
equations and performed the calculations for chl-a,
CDOM and TSM. ArcGIS Pro software was used for
estimating turbidity with the normalized difference
turbidity index (NDTI), as well as creating the spatio-
temporal distribution maps.
SNAP was used for processing and estimating
chl-a, CDOM, and TSM values. To start
preprocessing of the images, the resample operator
converted the spatial resolution of all satellite bands
to a single pixel size (10m). The geometric subset
operator was used to create a smaller image, and
therefore require less computational resources for
processing.
Next, atmospheric correction was applied; which
is crucial in order to be able to separate different
optically active constituents in water such as
chlorophyll-a, TSM and CDOM. The retrieval of the
optically active constituents is done in the form of
C2RCC S2MSI processor, an algorithm based on a
Table 1: Satellite and sensor data.
Satellite and Sensor Product Name Product Level Sensing Date
Sentinel 2 MSI
S2B_MSIL1C_20210217T064929_N0500_R020_T40R
DP_20230603T172352.SAFE
Level 1C February 17 2021
Sentinel 2 MSI
S2A_MSIL1C_20210423T064621_N0500_R020_T40R
DP_20230602T234425.SAFE
Level 1C April 23 2021
Sentinel 2 MSI
S2A_MSIL1C_20210821T064631_N0500_R020_T40R
DP_20230216T134509.SAFE
Level 1C Aug 21 2021
Sentinel 2 MSI
S2B_MSIL1C_20211224T065309_N0500_R020_T40R
DP_20221226T173342.SAFE
Level 1C December 24 2021
GISTAM 2024 - 10th International Conference on Geographical Information Systems Theory, Applications and Management
114
deep learning, neural networks approach. This
processor required Sentinel-2 level 1C as source
input.
With this, Sentinel-2 satellite imagery was
downloaded and processed by geometric, radiometric
and atmospheric correction within the
aforementioned softwares. The complete
methodology framework is illustrated in Figure 2.
4.1 Watershed
The pre-processing of the SRTM DEM (30m) from
USGS was completed using the following ArcGIS
Pro tools; fill, flow direction, flow accumulation,
stream order, stream segmentation, catchment
delineation, catchment polygon processing, snap pour
point and slope. All of these processes were applied
to the reconditioned DEM to increase the accuracy of
Al Rafisah watershed delineation utilizing stream
networks.
4.2 Water Quality
Sentinel 2 level 1C data was downloaded from
European state agency website with 5% cloud
coverage for four months in 2021; February, April,
August and December and input to SNAP.
Processing parameters such as the salinity was set
to 0.0001, since it is freshwater body, and the
elevation was set to 197m as per the study area. Other
parameters such as atmospheric ozone and air
pressure at sea level will be set in our brush script
specifically for each images as they changed in time.
Finally, three-output data sets were selected; which
are output normalized water leaving reflectance,
output irradiance attenuation coefficients and output
uncertainties. The following are the default equations
within the C2RCC processor that computed chl-a and
TSM (Doerffer, 2019):
Chl-a [mg m-3] = 21 x a_pig(443)
1.04
(1)
TSM = 1.7 x b_part(443) (2)
The water leaving reflectance resulting from the
C2RCC operator was also used to calculate chl-a
indices with two empirical models; the band ratio of
NIR over red and the maximum chlorophyll index
(MCI), where the peak is at around NIR 705nm
(Ansper & Alikas, 2019):
MCI = R705 – R665- 0.53 *(R740 – R665) (3)
In-situ data was not collected and no existing field
measurements were available for this study.
Therefore, validating results and calibrating based on
line regression for empirical models to extract the
chlorophyll concentration could not be done.
The results were reprojected and exported as tiff
format. Finally, these files were imported to ArcGIS
Pro to create the final distribution map layouts for chl-
a, CDOM and TSM.
Figure 2: Methodology framework.
Seasonal Water Quality Assessment Using Remote Sensing in Al Rafisah Dam, United Arab Emirates
115
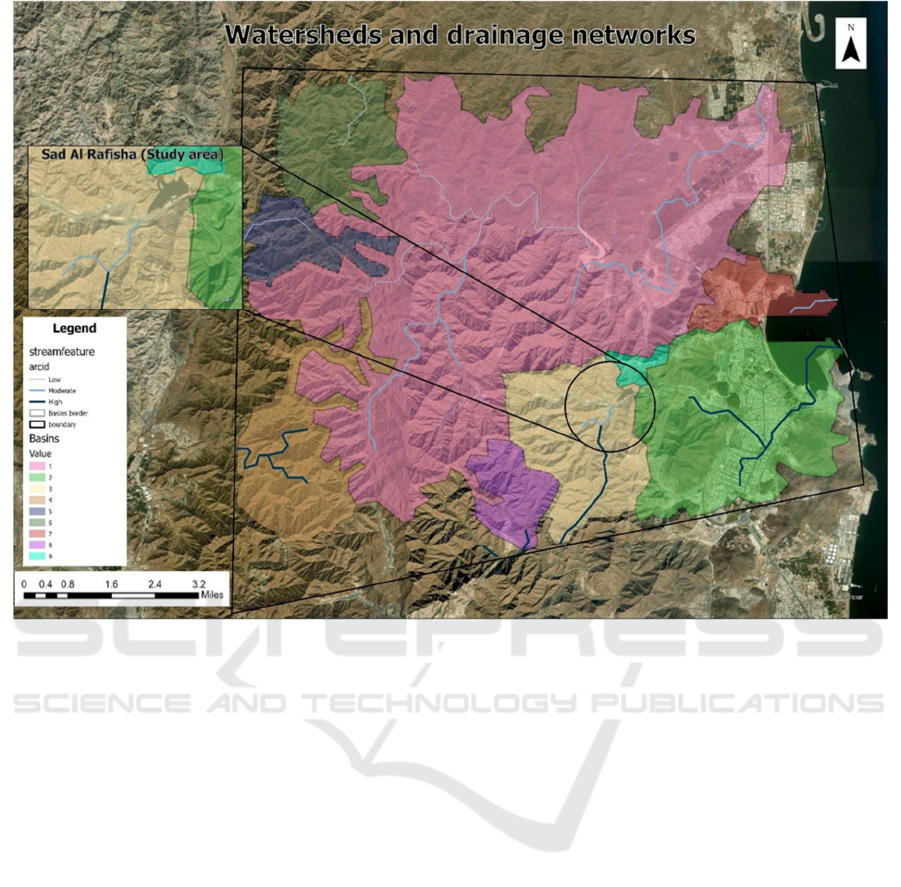
Figure 3: Watersheds and drainage networks map.
In ArcGIS Pro, Sentinel-2 level 1C data was
atmospherically corrected for the four months in
2021. Then, McFeeters (1996) normalized difference
water (NDWI) index was calculated to detect the
surface water bodies. Normalized difference turbidity
index (NDTI) was used to estimate the turbidity in
water bodies (Sankaran et al., 2023). The equation for
each are as follows:
NDWI= (Green-NIR/Green+NIR) (4)
NDTI= (Red-Green/Green+Red) (5)
Next, binary raster classification was created for
NDWI raster using the (greater_than) function to
differentiate between water and non-water pixels.
After that, a water body mask was created to extract
the boundaries of the Al Rafisah waterbody. Finally,
the NDTI raster was clipped with NDWI to extract
the intersect part between both of them to have the
turbidity product.
Final map layouts were produced to evaluate and
compare the water quality results.
5 RESULTS AND DISCUSSION
Sentinel-2 MSI was suitable as the data source for this
study considering its resolution and the area size of
Al Rafisah Dam.
5.1 Watershed
The watersheds and drainage networks map is shown
in Figure 3. The results of the watershed delineation
show that the dam location is perfect because high
and moderate streams end in the dam location, where
the water can be collected.
5.2 Water Quality
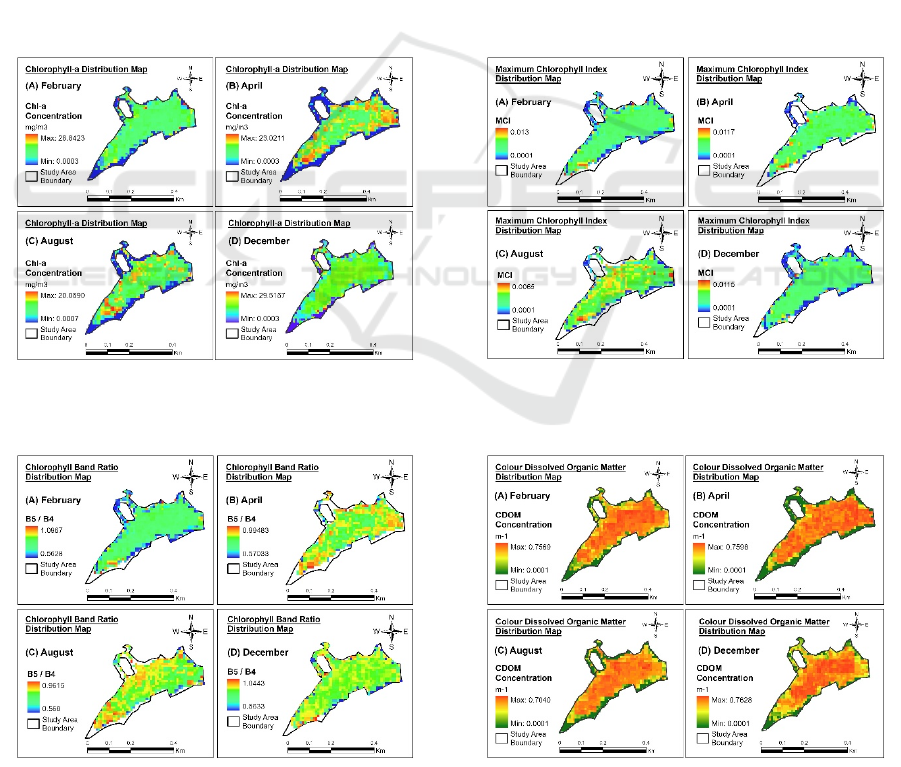
Chl-a concentrations predicted from Sentinel 2
satellite images were done by two approaches. The
first approach was from the C2RCC processing.
Concentrations ranged from 0.0003 mg/m3 up to
29.5157 mg/m3. Figure 4 shows that February and
December displayed higher maximum values, while
minimum values for all months were between 0.0003
GISTAM 2024 - 10th International Conference on Geographical Information Systems Theory, Applications and Management
116
mg/m
3
to 0.0007 mg/m
3
. In terms of the average
concentrations, they were highest during the summer
months of April and August. The lowest
concentration was in February and the highest in
April at 2.6936 mg/m
3
and 11.8809 mg/m
3
,
respectively. Maximum values can be seen towards
the edges of the waterbody for all Chl-a distribution
maps, as well as towards the dam in April. Higher
temperatures during summer can create increased
production and appearance of phytoplankton and Chl-
a containing organisms.
The second approach used empirical models; first
of which is the Band Ratios Model where Red Band
4 and NIR Band 5 are used (Figure 5). Mean values
resulting from this method ranged from 0.8003 to
0.8202. MCI was the other empirical model and
utilized Band 4 (Red), Band 5 (NIR) and Band 6
(NIR) (Figure 6). Mean values from MCI calculation
ranged from 0.0033 to 0.0049. Average
concentrations for these approaches followed similar
Figure 4: Chl-a distribution maps using C2RCC for (A)
February, (B) April, (C) August, and (D) December.
Figure 5: Chl-a distribution maps using band ratios for (A)
February, (B) April, (C) August, and (D) December.
trend with higher values in April and December and
lower values in February and August. Like the
C2RCC process, the highest average for both
empirical models was found to be for the month of
April.
The predicted concentrations of CDOM among all
months ranged from 0.0001 m
-1
to 0.763 m
-1
(Figure
7). The concentration pattern corresponds to that of
Chl-a. Higher average values were displayed for the
summer months. Similarly, the winter months
received the lowest values. The lowest mean
concentration was in December and the highest mean
in April at 0.1684 m
-1
and 0.5893 m
-1
, respectively.
The concentrations for TSM retrieved from the
satellite images ranged from 0.0101 g/m
3
to 37.6331
g/m
3
(Figure 8). February and December observed
higher maximum values. The highest average
concentrations were found in the cooler months of
February, April, and December which were over 5
g/m
3
. The highest average concentration was once
Figure 6: Chl-a distribution maps using MCI for (A)
February, (B) April, (C) August, and (D) December.
Figure 7: CDOM distribution maps for (A) February, (B)
April, (C) August, and (D) December.
Seasonal Water Quality Assessment Using Remote Sensing in Al Rafisah Dam, United Arab Emirates
117
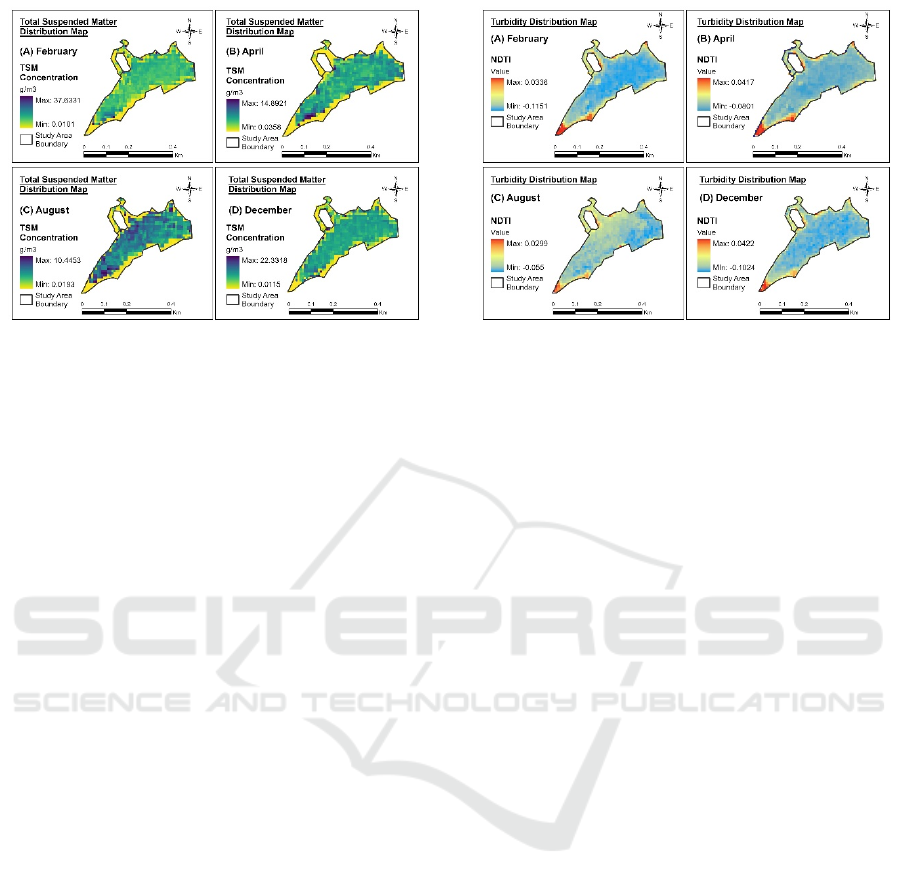
Figure 8: TSM distribution maps for (A) February, (B)
April, (C) August, and (D) December.
again in April at 5.7653 g/m
3
, whereas the drier,
hotter month of August had the lowest average value
at 3.9537 g/m
3
.
This trend could be a result of rainfall and tourist
activity at the dam during these cooler months. The
TSM maps display that maximum values are
collected in the middle of the waterbody away from
the edges.
The turbidity results shown in Figure 9 were
obtained from NDTI calculations on ArcGIS Pro.
Bands 3 (Green) and 4 (Red) from the satellite images
were utilized. Higher NDTI values closer to 1 indicate
turbid waters where reflectance is greater in the red
band. Lower values nearer to -1 indicate clearer
water. Turbidity values among all months ranged
from -0.1151 to 0.0422. The lowest mean value was
in February and the highest in August at -0.0848 and
-0.0366 m
-1
, respectively. The higher values were
located in the southern part of the dam, as well as
several spots towards the north, for all months. All
mean NDTI values were just under 0.
According to Garg et al. (2017), values from
around 0 to 0.2 are commonly categorized as
moderate turbidity. Clear waters display values from
0 to -0.2, and highly turbid waters greater than 0.25.
Turbidity increases with existence of suspended
and dissolved substances in fluids, thereby reducing
the clarity. The amalgamation of chl-a, TSM and
CDOM could be a cause for moderate turbidity in the
dam.
In their study, Ouma, Noor and Herbert (2020)
found that maps for chl-a concentrations and turbidity
values in the Chebara Dam followed similar patterns.
However, the concentrations for chl-a and TSM were
higher than those found in the Al Rafisah Dam. Using
Sentinel-2A and empirical models, concentrations for
Figure 9: Turbidity distribution maps for for (A) February,
(B) April, (C) August, and (D) December.
chl-a ranged from 11 to 222 mg/m
3
, while TSM
ranged from 35 to 574 g/m
3
.
A study on a Portuguese Estuary observed higher
concentrations for the same four parameters during
warmer months of 2020 compared to the winter
months (Sent et al., 2021). These results were
analogous to the average concentrations found at the
dam.
6 CONCLUSION
The principal aim of this paper was to use appropriate
remote sensing methods to monitor selected water
quality parameters in the Al Rafisah Dam over
several months in 2021. Specific targets were to
identify which water quality parameters were to be
studied. Additionally, to evaluate and compare the
results based on the distribution maps that were
created for each parameter and month. Sentinel-2
MSI was the chosen satellite and sensor due to its
high spatial resolution and wide use in water quality
monitoring. Chl-a, CDOM, TSM, and turbidity were
also selected for the study due to their wide use in
similar studies. The main objectives were achieved by
estimating values and displaying distribution maps
for the four water quality parameters.
Results showed that April had the highest average
values for chl-a, CDOM, and TSM. August received
the highest average for turbidity. Overall comparative
evaluation of the concentration patterns showed that
the parameters selected for the study are interrelated,
yet may vary due to environmental and human
influences.
This paper offered an unprecedented study on the
water quality of the Al Rafisah Dam. Despite this, the
GISTAM 2024 - 10th International Conference on Geographical Information Systems Theory, Applications and Management
118

study observed some limitations that can be addressed
in future works. It would be worthwhile to obtain
ground truth from in-situ data for calibration and
result validation. With these field measurements,
models for estimating chl-a, CDOM, TSM, and
turbidity can be tailored based on the requirements
and objectives of the study. Additionally, future
research could focus on a different selection of
parameters or on comparing various satellite sensors
as the data source. Water quality research using
remote sensing and GIS plays an important role in
encouraging researchers to conduct more studies in
unexplored or unattainable locations.
REFERENCES
Acharya, T. D., Subedi, A., Huang, H., & Lee, D. H. (2019).
Application of water indices in surface water change
detection using Landsat imagery in Nepal. Sensors and
Materials, 31(5).
Abdullah, H. S. A., Mahdi, M. S. M., & Ibrahim, H. M. I.
(2016). Water quality assessment models for Dokan
Lake using Landsat 8 OLI satellite images. Journal of
Zankoy Sulaimani, 19(3-4), 25–42. https://www.
researchgate.net/publication/322978901_Water_Qualit
y_Assessment_Models_for_Dokan_Lake_Using_Land
sat_8_OLI_Satellite_Images
Ansper, A. & Alikas, K. (2019) Retrieval of chlorophyll a
from Sentinel-2 MSI data for the European Union water
framework directive reporting purposes. Remote
Sensing, 11(1), 64. doi:10.3390/rs11010064.
Bangira, T., Matongera, T. N., Mabhaudhi, T., & Mutanga,
O. (2024). Remote sensing-based water quality
monitoring in African reservoirs, potential and
limitations of sensors and algorithms: A systematic
review. Physics and Chemistry of the Earth, 134,
103536. https://doi.org/10.1016/j.pce.2023.103536
Doerffer, R. (2015). Algorithm Theoretical Bases
Document (ATBD) for L2 processing of MERIS data
of case 2 waters, 4th reprocessing. Retrieved from
https://c2rcc.org/wp-content/uploads/2022/05/C2RCC
_MERIS_ATBD_4Reproc_20150319.pdf
KC, A., Chalise, A., Parajuli, D., Dhital, N., Shrestha, S., &
Kandel, T. (2019). Surface water quality assessment
using remote sensing, gis and artificial intelligence.
Technical Journal 1(1), 113-122.
Khan, R. M., Salehi, B., Mahdianpari, M., &
Mohammadimanesh, F. (2021). Water Quality
Monitoring Over Finger Lakes Region Using Sentinel-
2 Imagery On Google Earth Engine Cloud Computing
Platform, ISPRS Annals of the Photogrammetry.
Remote Sensing and Spatial Information Sciences, 3,
279 – 283. http://dx.doi.org/10.5194/isprs-annals-V-3-
2021-279-2021
Garg, V., Kumar, S., Aggarwal, S. P., Kumar, V., Dhote, P.
R., Thakur, P. K., Nikam, B. R., Sambare, R. S.,
Siddiqui, A., Muduli, P. R., & Rastogi, G. (2017).
Spectral similarity approach for mapping turbidity of an
inland waterbody. Journal of Hydrology, 550, 527-537.
https://doi.org/10.1016/j.jhydrol.2017.05.039
Ma, Y., Song, K., Wen, Z., Liu, G., Shang, Y., Lyu, L., Du,
J., Yang, Q., Li, S., Tao, H., & Hou, J. (2021). Remote
sensing of turbidity for lakes in northeast China using
sentinel-2 images with machine learning algorithms.
IEEE Journal of Selected Topics in Applied Earth
Observations and Remote Sensing, 14, 9132–9146.
https://doi.org/10.1109/jstars.2021.3109292
Masoud. A. A. (2022). On the retrieval of the water quality
parameters fromsentinel-3/2 and landsat-8 oli in the
Nile Delta’s coastal and inland waters. Water 14, 593.
Mucheye, T., Haro, S., Papasyrou, S., & Cabllero, I. (2022).
Water quality and water hyacinth monitoring with the
Sentinel-2A/B satellites in Lake Tana (Ethiopia).
Remote Sensing, 14, 4921
Niroumand-Jadidi, M., Bovolo, F., & Bruzzone, L. (2020)
Water Quality Retrieval from PRISMA hyperspectral
images: First experience in a turbid lake and
comparison with Sentinel-2. Remote Sensing, 12, 3984.
http://dx.doi.org/10.3390/rs12233984
Ouma, Y. O, Noor. K, & Hebert, K. (2020). Modelling
reservoir chlorophyll-a, tss, and turbidity using
sentinel-2A MSI and Landsat-8 OLI satellite sensors
with empirical multivariate regression.
Journal of
Sensors. https://www.researchgate.net/publication/344
332045_Modelling_Reservoir_Chlorophyll-a_TSS_an
d_Turbidity_Using_Sentinel-2A_MSI_and_Landsat-8
_OLI_Satellite_Sensors_with_Empirical_Multivariate
_Regression
Sankaran, R., Al-Khayat, J. A., Aravinth, J., Chatting, M.
E., Sadooni, F. N., Al-Kuwari, H. A. (2023). Retrieval
of suspended sediment concentration (SSC) in the
Arabian Gulf water of arid region by Sentinel-2 data.
Science of the Total Environment, 904.
https://doi.org/10.1016/j.scitotenv.2023.166875
Seleem, T., Bafi, D., & Parchardidis, I. (2022). Water
quality monitoring using Landsat 8 and Sentinel-2
satellite data (2014–2020) in Timsah Lake, Ismailia,
Suez Canal region (Egypt). Journal of the Indian
Society of Remote Sensing. https://doi.org/10.1007/
s12524-022-01613-9
Sent, G., Biguino, B., Favareto, L., Cruz, J., Sa, C.,
Dogliotti, A. I., Palma, C., Brotas, V., & Brito, A. C.
(2021). Deriving water quality parameters using
Sentinel-2 imagery: A case study in the Sado Estuary,
Portugal. Remote Sensing, 13(5) 1043.
https://doi.org/10.3390/rs13051043
Su, Y.-F., Liou, J.-J., Hou, J.-C., Hung, W.-C., Hsu, S.-M.,
Lien, Y.-T., Su, M.-D., Cheng, K.-S., & Wang, Y.-F.
(2008). A multivariate model for coastal water quality
mapping using satellite remote sensing images.
SENSORS, 8(10), 6321–6339. https://doi.org/10.3390/
s8106321
Virdis, S. G. P., Xue, W., Winijkul, E., Nitivattananon, V.,
& Punpukdee, P. (2022). Remote sensing of tropical
riverine water quality using Sentinel-2 MSI and field
observations. Ecological Indicators, 144, 109472.
https://doi.org/10.1016/j.ecolind.2022.109472
Seasonal Water Quality Assessment Using Remote Sensing in Al Rafisah Dam, United Arab Emirates
119
