
History-Based Road Traffic Anomaly Detection Using Deep Learning
and Real-World Data
Alexander Michielsen
a
, Mohammadmahdi Rahimiasl
b
, Ynte Vanderhoydonc
c
and
Siegfried Mercelis
d
University of Antwerp, imec IDLab, Faculty of Applied Engineering Sint-Pietersvliet 7, 2000 Antwerp, Belgium
Keywords:
Road Traffic, Anomaly Detection, Deep Learning, Detectors, Graph Neural Network, Traffic Prediction.
Abstract:
Detecting anomalies in road traffic, such as accidents and traffic jams, can provide various benefits to road
users and road infrastructure managers, including optimal route planning, redirecting traffic flows, and re-
ducing congestion caused by traffic accidents. Recently, many history-based traffic prediction deep learning
methods have been developed to perform this task. These methods detect anomalous traffic by comparing the
current traffic situation with a predicted one based on historical data. This paper investigates the possibility of
detecting traffic anomalies using a novel combination of traffic prediction and graph anomaly detection algo-
rithms, both using deep learning, in a real-world dataset of highways near Antwerp, Belgium. It first bench-
marks configurations with different time resolutions of prediction algorithms in terms of accuracy. Then, a
combined configuration including anomaly detection is benchmarked in terms of traffic anomaly detection ac-
curacy. Furthermore, it examines which traffic features can contribute to anomaly detection e.g. speed, vehicle
length. Finally, the entire system is tested on real-world traffic data containing anomalies. The results show
a decreased anomaly detection performance when using both vehicle speed and length as features instead of
only speed, and an increased performance when using larger time resolutions.
1 INTRODUCTION
Recently, advances in the Internet of Things (IoT)
and data gathering have greatly improved intelligent
transportation systems (ITS) and their traffic manage-
ment capabilities. One of their goals is traffic predic-
tion, i.e. using historical data to predict future road
usage(Tedjopurnomo et al., 2022).
By applying the insight gained from these predic-
tions, anomalies in road traffic can be detected, such
as traffic jams and accidents. Detecting these anoma-
lies provides benefits to road users as well as traffic
managers. The latter can respond quicker to incidents,
thus preventing more tragedy(Zhang et al., 2019),
while also identifying dangerous regions which in
turn can be adapted(Deng et al., 2022). For road
users, anomaly detection is used to improve route
planning services, resulting in more efficient travel
routes that avoid these anomalies, together with less
a
https://orcid.org/0009-0005-8957-3626
b
https://orcid.org/0000-0002-0421-8651
c
https://orcid.org/0000-0001-6835-3302
d
https://orcid.org/0000-0001-9355-6566
economic loss and stress due to congestion (Zhang
et al., 2019; Deng et al., 2022).
Traffic anomaly detection can be either history-
based or outlier-based (Sabour et al., 2021; Weil et al.,
1998). In the former method, aggregated historical
data is used to create a model of the expected traffic
situation at a certain place and time i.e. traffic pre-
diction, which is compared to the actual situation in
order to determine whether traffic is anomalous. Re-
cently, data-driven deep learning models have gained
popularity for performing such tasks since they often
outperform more conventional methods such as the
Bayesian method(Zhang et al., 2022; Ye et al., 2020)
or nonparametric regression(Tang and Gao, 2005).
They excel in their ability to capture more aspects of
the highly dynamic and spatial-temporally dependent
road traffic data, as well as provide a more complex
architecture. The development of graph neural net-
works (GNN) allowed the processing of graphs using
deep learning which are a more accurate representa-
tion of road networks compared to grids used in con-
volutional neural networks (CNN).
In this work, we present a comparative study
of different state-of-the-art traffic prediction and
Michielsen, A., Rahimiasl, M., Vanderhoydonc, Y. and Mercelis, S.
History-Based Road Traffic Anomaly Detection Using Deep Learning and Real-World Data.
DOI: 10.5220/0012565500003702
Paper published under CC license (CC BY-NC-ND 4.0)
In Proceedings of the 10th International Conference on Vehicle Technology and Intelligent Transport Systems (VEHITS 2024), pages 249-256
ISBN: 978-989-758-703-0; ISSN: 2184-495X
Proceedings Copyright © 2024 by SCITEPRESS – Science and Technology Publications, Lda.
249

anomaly detection algorithms applied to traffic data
from highways around the city of Antwerp, Belgium.
These highways are among the busiest in the country
with parts handling 130,000 vehicles a day on aver-
age. This also results in a high number of accidents
with over 3000 reported ones in the Antwerp area in
2022(Flemish Government, 2022).
We propose a novel approach for detecting road
traffic anomalies using traffic prediction. First, a com-
parison is made between the traffic predictions and
the actual traffic situation to create an anomaly score.
Second, these anomaly scores are fed through a graph
anomaly detection algorithm that determines whether
a node shows anomalous readings. The use of a graph
anomaly detection algorithm for this purpose has not
yet been explored in literature to the best of the au-
thor’s knowledge.
The overall objective of this paper is to investigate
the feasibility of our novel approach by first, bench-
marking different configurations of multiple state-of-
the-art traffic prediction algorithms. These need to
be as accurate as possible in order to correctly iden-
tify anomalous behaviour. Then, we combine these
different prediction algorithms with multiple anomaly
detection algorithms to find the optimal combination.
This is all done by studying the following questions:
• What influence do various time resolutions (3, 5,
10 and 15 minutes) have on the traffic prediction
capabilities of the benchmarked algorithms?
• What additional value can multiple traffic fea-
tures (speed and vehicle length) instead of just one
(speed) bring to traffic prediction algorithms?
• How do various state-of-the-art graph anomaly
detection algorithms perform in combination with
the different benchmarked traffic prediction meth-
ods in terms of anomaly detection capabilities?
The paper is structured as follows: Section 2
contains a literature review on history-based traffic
anomaly detection using deep learning with graphs.
Section 3 presents the applied methodology, while in
Section 4 the results of our benchmarking are pre-
sented and discussed. In Section 5 we perform a case
study of our proposed system. In Section 6, conclu-
sions are drawn. In Section 7, we discuss the chal-
lenges we faced during our research as well as future
work.
2 LITERATURE REVIEW
In this section, we provide a brief overview of recent
research within the field of history-based road traf-
fic anomaly detection using deep learning. The most
promising and novel choice for performing this task is
a graph-based one which excels in its ability to repre-
sent road networks(Tedjopurnomo et al., 2022). The
traffic state is modelled as a graph in which nodes
represent significant points, such as sensor locations
or intersections, and edges represent the road sections
between the nodes.
(Deng et al., 2022) applies a generative adversarial
network (GAN) method using a spatiotemporal GAN
(STGAN), which models normal traffic behaviour us-
ing three modules. The first module consists of a
graph convolutional gated recurrent unit (GCGRU)
that captures the correlation between neighbouring
nodes. The second module uses long short-term
memory (LSTM) to capture long-term trends in traf-
fic, such as differences between weekdays and week-
ends. The third module consists of a fully connected
feed forward network (FFN) and extracts features of
external events, such as time and weather. This data
is then fed through the discriminator that outputs an
anomaly score.
(Zhang et al., 2022) propose a graph-based
method consisting of four parts: Traffic Information
Embedding, Traffic State Spatial-Temporal Graph
Structure Learning, Traffic State Prediction and Traf-
fic Anomaly Detection. The first one combines the
information of different nodes into a single feature set
through a FFN. The second learns the relationship be-
tween nodes and creates a graph structure represent-
ing the node connections and locations. The third pre-
dicts future traffic behaviour through a Graph Atten-
tion Network (GAT Network). The fourth one calcu-
lates the error between the prediction and the actual
data and calculates an anomaly value from it. If the
anomaly value exceeds a certain threshold, the system
classifies the current situation as an anomaly. By us-
ing deep learning-based graph anomaly detection al-
gorithms, we avoid the need for a predefined thresh-
old, as described in (Zhang et al., 2022).
3 METHODOLOGY
This section describes the approach used to develop
our road traffic anomaly detection environment. First,
we will cover the data preparation which was exten-
sive due to the fact that the data had never been used
for such purposes before. This part is further divided
into a graph construction and data processing phase.
Next, we describe the different traffic prediction algo-
rithms and their implementations. Finally, we discuss
the graph anomaly detection algorithms used in our
experiments.
VEHITS 2024 - 10th International Conference on Vehicle Technology and Intelligent Transport Systems
250

Figure 1: Sensor locations of our dataset on highways around Antwerp (left) (via OpenStreetMap(OpenStreetMap, 2023)).
Sensor 42, used for our case study, is marked with an arrow.
3.1 Data Preparation
The data we used in this study originates from 403
inductive loop sensors on major highways around
Antwerp. These sensors detect the passages of ve-
hicles together with their speed and length. Our raw
data consists of individual vehicle passages in the pe-
riod from 1 January to 31 March 2021. The data was
made available to us by the Agency for Roads and
Traffic of the Flemish Government through a license
agreement(Agentschap Wegen en Verkeer, 2023).
From the different sensor locations, a graph struc-
ture was created as follows: First, we grouped to-
gether the different measuring points that were at the
same location but on different lanes into one node.
Points at the same location but on an on- or off-ramp
were kept separately. Figure 1 shows the result with
all sensors mapped to their respective locations. Af-
terwards, we connected nodes using a directed edge if
there was a road connection conforming to the legal
traffic direction between them that did not pass any
other nodes. Finally, we determined the road distance
between each node and its neighbours which repre-
sent the edge features of our graph.
Using averaging, the data readings at each node
were combined into four different resolution lengths
(3, 5, 10 and 15 minutes). In order to test different
configurations, we created a dataset with both speed
and length information, and one with only speed in-
formation. The reasoning behind this is that since
we are predicting speed for each node, vehicle length
could be an influence since longer vehicles (e.g.,
trucks and buses) tend drive more slowly under reg-
ular circumstances. In total, this left us with eight
novel datasets i.e. two versions per time resolution.
All datasets consisted of 119 nodes, representing sen-
sor locations, and 144 edges, representing road con-
nections.
3.2 Experimental Setup
In this section, we discuss our experimental setup
including the algorithms and workflow we applied.
First, we will go over the traffic prediction algorithms
we compared and how we implemented them. Sec-
ond, we will look at the processing of the predic-
tion results in order to use them with the considered
anomaly detection algorithms.
In our setup, we define an anomaly as an event,
such as an accident, that causes a significant deviation
from the predicted value. Therefore, we first investi-
gate which traffic prediction algorithm makes the best
predictions so that it is as close as possible to regular
traffic behaviour. Afterwards, we transform the re-
sults of this prediction into an anomaly score by com-
paring it with the actual situation and finally, feed this
score into an anomaly detection algorithm.
3.2.1 Traffic Prediction Algorithms
For our comparison, we used three different traf-
fic prediction algorithms that all optimised the mean
average error (MAE): GraphWavenet (GWNet)(Wu
et al., 2019), MTGNN (Multivariate Time Series
Forecasting with Graph Neural Network)(Wu et al.,
2020) and STID (Spatial-Temporal Identity)(Shao
et al., 2022). The first two were chosen because they
are common baselines in traffic prediction research in
which they have proven to be performing. The lat-
ter was chosen because it is a recently developed one
that has been shown to be very effective in the au-
thor’s comparative study. These algorithms are able to
learn normal traffic behaviour for different days of the
week and different times in a day by embedding this
additional information for each data point before us-
ing it as an input. In this way, for example, congestion
as a result of morning commutes during weekdays is
predicted as well because they are not anomalous be-
History-Based Road Traffic Anomaly Detection Using Deep Learning and Real-World Data
251

haviour.
Each algorithm would take a time series as an in-
put that totals to 1 hour in length. So, depending on
the time resolution of the data, i.e. 3, 5, 10 or 15 min-
utes, the input length was 20, 12, 6 and 4 data points
respectively for each node in our graph.
Each algorithm would predict the traffic speed for
each node in our graph one time step into the future.
We deliberately chose not to predict vehicle length be-
cause we are only interested in traffic anomalies such
as accidents, which we assume to be unrelated to the
length of vehicles on the road, i.e. if more long vehi-
cles are present than usual, it does not indicate that an
accident has occurred.
For each of these algorithms, we processed our
graph data to conform to the accepted input. This in-
cluded processing the node features at each time step
as well as constructing the adjacency matrix based on
the road distances between nodes. In addition, we cre-
ated a test setup that enabled us to test each algorithm
with the same test data while also providing us with
the metrics mean average error (MAE), mean average
percentage error (MAPE) and the root mean square
error (RMSE). For every training run, we timed the
process and applied the recommended settings pro-
vided in the algorithm’s original paper.
3.2.2 Anomaly Detection Algorithms
The output from the traffic prediction algorithms pro-
vided us with a predicted traffic speed for each node
in the graph one time step into the future. In order to
determine whether the current traffic state is anoma-
lous, we created an anomaly score for each node in
the graph by taking the absolute difference between
the predicted and actual speed for each node. Then,
we normalised all of these values similarly to (Zhang
et al., 2022) for robustness so that one node exhibiting
extreme anomalous readings did not have a dominant
influence.
The result from the aforementioned operation
provided us with a graph in which each node has
an anomaly score as its feature. In order to de-
termine whether the traffic situation at a certain
node is actually an anomalous situation, we ap-
plied four different graph anomaly detection al-
gorithms: DONE(Bandyopadhyay et al., 2020),
AdOne(Bandyopadhyay et al., 2020), Anomaly-
DAE(Fan et al., 2020) and DOMINANT(Ding et al.,
2019). Applying multiple anomaly detection algo-
rithms is worthwhile because it has been shown that
different algorithms better suit different graph struc-
tures(Liu et al., 2022b). These four algorithms were
chosen because of their strong performance in recent
benchmarks(Liu et al., 2022b). For their implemen-
tation, we used the PyGod library(Liu et al., 2022a)
which already includes all these algorithms making it
easy to swap them out and test them.
Initially, we applied labelled data that included
traffic events to enable the anomaly detection sys-
tem to distinguish between anomalies that indicate an
anomalous event from those that occur for other rea-
sons. However, we were unable to use this data for
our research for two reasons: First, regular conges-
tion, e.g. morning rush hour, which we do not want
to label as an anomaly since it is normal traffic be-
haviour, was present in the labelled data. Second, the
number of events included was too small for effec-
tive deep learning which relies on large amounts of
data. This is a common challenge in traffic anomaly
detection(Zhu et al., 2022; Liu et al., 2020; Sun et al.,
2018).
Therefore, we injected contextual anomalies into
the ground truth traffic data using the same PyGod
library in order to simulate anomalous traffic events.
A thorough explanation of this process can be found
in(Ding et al., 2019). Afterwards, we ran the imple-
mentation of our system for every traffic prediction
configuration, i.e. algorithm, number of features, time
resolution, and for every anomaly detection algorithm
1000 times. For performance measurement, we used
the receiver operation characteristic area under curve
score (ROC-AUC score). This score indicates how
well the algorithm can distinguish between different
classes, i.e. anomaly or no anomaly, with higher
scores indicating better performance on both positive
and negative examples. Additionally, we measured
the inference time for the anomaly detection algo-
rithm, which included fitting itself to the graph and
detecting anomalies.
4 RESULTS & DISCUSSION
In this section, we display the results of our experi-
ments. We discuss the benchmarked traffic prediction
algorithms for all different configurations as well as
the graph anomaly detection algorithms. All experi-
ments were run using a Nvidia Geforce 1080 Ti GPU
with 11GB of memory.
For the comparison of traffic prediction capa-
bilities, we used the following algorithms: Graph-
Wavenet, MTGNN, and STID. Our comparisons in-
clude the training time as well as the prediction per-
formance measured by MAE, MAPE and RMSE.
The trained models were tested on the same test
set for each resolution length. Since 1 hour of data is
used for each prediction, the input length differs for
each time resolution. The test set for 3, 5, 10 and
VEHITS 2024 - 10th International Conference on Vehicle Technology and Intelligent Transport Systems
252
15 minute resolution contains 8632, 5179, 2590, and
1727 data points respectively. The results of our test
showing MAE, MAPE and RMSE for different data
configurations can be found in Table 1.
When we compare the traffic prediction results for
different feature configurations, i.e. single vs. double,
we see that in each case, the prediction with double
features performs worse than the configuration with
single features when looking at the MAE. Besides two
configurations (3 minute double feature and 5 minute
double feature), this also holds for the RMSE. Only
in the 15 min double feature configuration does the
MAPE show an improvement over the single feature
configuration. Therefore, we can conclude that ve-
hicle length is not a good predictor of future traffic
situations and that using only speed is preferable. No
correlation was found between the decreased perfor-
mance and the presence of the extra feature.
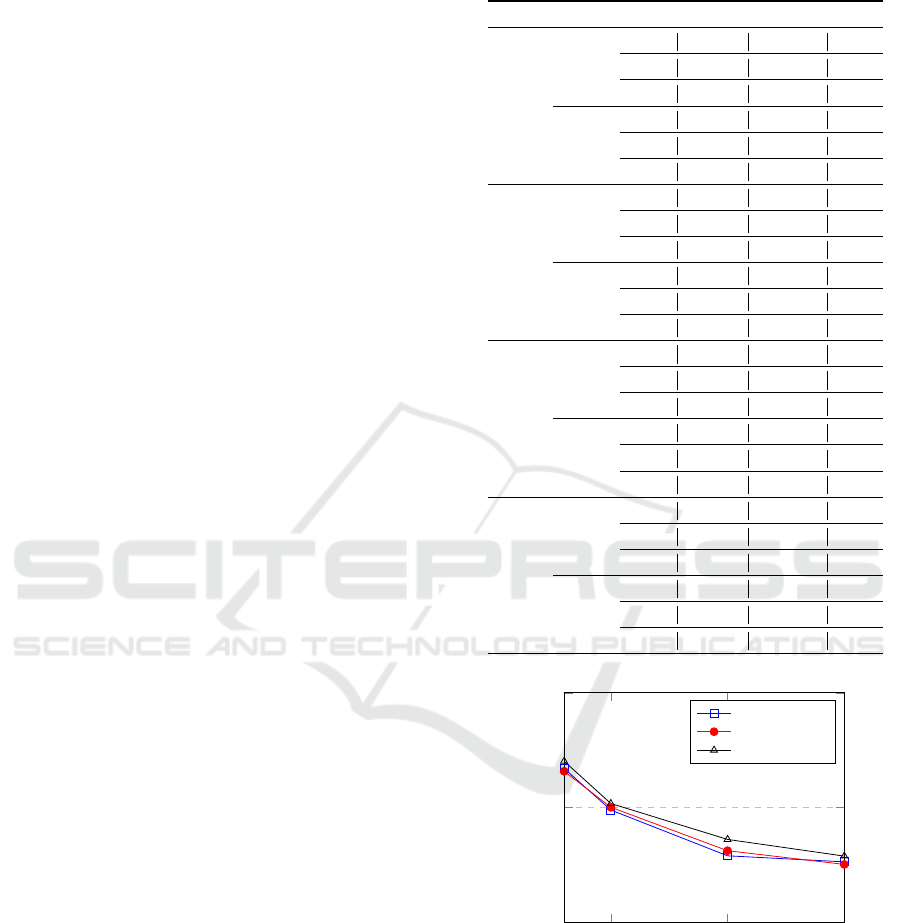
Looking at the different time resolutions, we see
a trend where the MAE decreases as the time resolu-
tion increases. This trend is visualised in Figure 2 for
the tested prediction algorithms using a single feature
configuration. This trend also applies to the double
feature configuration. In all, this means better traffic
prediction with fewer data inputs and shorter training
time. The latter could be especially interesting for
networks in which many changes occur e.g. due to
road works, because then the model would have to be
retrained to better fit the actual road layout.
However, a larger time resolution gives a less pre-
cise view of the traffic situation. If we were to use a
15 minute resolution in implementations, in the worst
case, we would only be able to detect an anomaly 15
minutes after it had occurred. Additionally, if for ex-
ample, an anomaly occurs near the end of a time res-
olution slot, it might not be detected since the traffic
data is averaged over the entire time interval. In future
work, this hypothesis should be further validated.
Comparing the different traffic prediction algo-
rithms, MTGNN shows the overall best performance
for a 3 minute time resolution in terms of MAE and
MAPE using a single feature configuration. For a 5
and 10 minute time resolution configuration, Graph-
Wavenet shows the best results and finally, for a 15
minute time configuration, MTGNN shows the best
results again. When looking at the RMSE, Graph-
Wavenet outperforms the others in the case of 3, 5
and 10 minute time resolutions using a double fea-
ture configuration. This contradicts the findings from
(Shao et al., 2022), possibly indicating that the spe-
cific graph structure is important for the effectiveness
of the traffic prediction algorithms.
The second part of our research, consisted of de-
tecting anomalous traffic occurrences using our pre-
Table 1: Testing results of traffic prediction algorithms. The
best results for each time resolution are in bold.
GWNet MTGNN STID
MAE 3.1702 3.1579 3.2019
MAPE 3.73% 3.72% 3.79%
Single
RMSE 5.7032 5.7139 5.8029
MAE 3.1896 3.4625 3.5031
MAPE 3.78% 4.17% 4.63%
3 Min
Double
RMSE 5.6906 5.6971 6.334
MAE 2.9889 3.001 3.0173
MAPE 3.55% 3.55% 3.58%
Single
RMSE 5.4873 5.5339 5.5797
MAE 2.9916 3.164 3.2439
MAPE 3.57% 3.73% 3.82%
5 Min
Double
RMSE 5.4408 5.7526 6.0051
MAE 2.7892 2.8114 2.8607
MAPE 3.31% 3.33% 3.40 %
Single
RMSE 5.436 5.3895 5.4892
MAE 2.8534 3.1009 2.9683
MAPE 3.36% 3.78% 3.41%
10 Min
Double
RMSE 5.4225 5.7528 5.6966
MAE 2.7628 2.7517 2.7879
MAPE 3.32% 3.31% 3.63%
Single
RMSE 5.4168 5.351 5.4631
MAE 2.8029 3.0811 2.8739
MAPE 3.35% 3.81% 3.34%
15 Min
Double
RMSE 5.4268 5.7976 6.8217
3
5
10
15
2.5
3
3.5
Time Resolution (min)
MAE
GraphWaveNet
MTGNN
STID
Figure 2: MAE vs Time Resolution for single feature setup.
dicted traffic data. In order to accomplish this, we im-
plemented four commonly used state-of-the-art graph
anomaly detection algorithms based on deep learning:
Done, AdOne, AnomalyDAE, and DOMINANT. We
measured performance by the ROC-AUC score and
inference time, which includes fitting the algorithm
to the graph and performing the detection step. We
took the average of these values over all the runs per-
History-Based Road Traffic Anomaly Detection Using Deep Learning and Real-World Data
253

Table 2: Test results of anomaly detection algorithms.
ROC-AUC Inference Time (s)
DONE 0
0
0.
.
.9
9
98
8
8 ±
±
± 0
0
0.
.
.0
0
01
1
18
8
8 0.0837
AdOne 0.81 ± 0.069 0.1048
AnomalyDAE 0.52 ± 0.158 0
0
0.
.
.0
0
06
6
61
1
10
0
0
DOMINANT
0.50 ± 0.094 0.0986
formed (24000 runs/algorithm). The results of these
experiments are summarised in Table 2.
The DONE algorithm shows the best ROC-AUC
score with 0.98 which is 0.17 higher than the second
place, AdOne. Looking at inference time, however,
DONE comes in at the third place with 0.0837 sec-
onds on average, while AnomalyDAE takes 0.0610
seconds. DOMINANT was only able to correctly
classify 50% of all traffic situations while having an
average inference time of 0.0986 seconds. Since, all
algorithms perform at an inference time that would
be acceptable whenever detecting anomalies in real-
world traffic situations, the DONE algorithm with the
highest ROC-AUC score is the most suitable.
5 CASE STUDY
Because of previously mentioned issues with our
event data, we were unable to train with actual traffic
anomalies and injected anomalies into the graph data
instead in order to simulate anomalous traffic events.
However, to gain insight into the effectiveness of our
proposed solution on real-world data, we conducted a
case study. For this study, we hand-picked an anoma-
lous traffic situation from our event dataset and put
them through our proposed solution i.e. MTGNN,
single feature, 5 minute resolution, anomaly detection
using DONE. Even though MTGNN shows the over-
all best performance at a 15 minute time resolution we
suggest a 5 minute time resolution with only speed
as a feature. We believe 5 minute intervals provide
a good trade-off between performance and detection
speed.
The goal of our test was to detect a traffic jam
with unknown cause on the ring road around Antwerp
(R2) that started at 12:01:34 on Wednesday 13 Jan-
uary 2021 and lasted until 13:56:26 that same day ac-
cording to the event data. Sensor 42 in our graph is
located within the segment associated with this event
and is marked on Figure 1 with an arrow. At the posi-
tion of this sensor, the highway consists of five lanes.
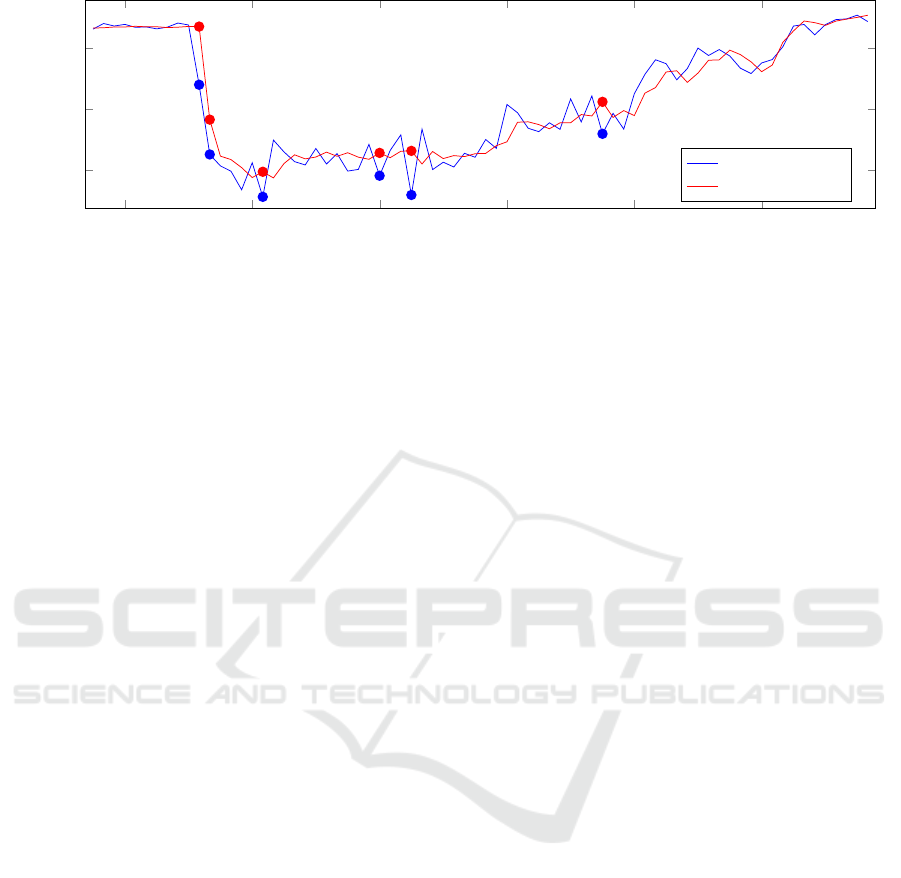
Figure 3 shows the predicted and actual speeds over a
six hour period at sensor 42, with the anomalous sit-
uations detected by our system marked. Note that we
only include a detected anomaly if the actual speed
value is lower than the predicted value. We are not
interested in the other case since this would indicate
that traffic is smoother than predicted.
As expected, an anomaly is detected when the ac-
tual speed value is significantly lower than the pre-
dicted one. Interestingly, as visible on the graph, the
prediction algorithm adapts itself to the changing sit-
uation and adjusts its predictions based on the incom-
ing data. Therefore, not every time step during the
anomalous event is marked as such, which is desir-
able because we only want to detect when an event
occurs, which is correctly done at 12:35 and 12:40.
However, while traffic is recovering from the
anomaly, a traffic wave pattern can be seen in the
actual values during which the system also detects
anomalies since the prediction algorithm has a hard
time following along with the wave, which is unde-
sirable. This shows a possible shortcoming of our
system in practice and the importance of real-world
calibration and validation which might mitigate these
effects.
6 CONCLUSIONS
In this paper, we conducted a comparative study of
various graph-based road traffic prediction algorithms
and graph anomaly detection algorithms using deep
learning. The overall goal was to determine the op-
timal combination of algorithms for detecting road
traffic anomalies, such as accidents or sudden traffic
jams, using our dataset consisting of inductive loop
readings from highways around Antwerp. In addition,
we investigated the effect of multiple traffic features
and the resolution length of input data on the traffic
prediction algorithms, whose accuracy is necessary
for correct anomaly detection.
From the benchmark of different traffic prediction
algorithms, we can conclude that using only speed as
a feature instead of both speed and vehicle length is
preferable since the combination of both shows a de-
creased performance across all tests. For time reso-
lution, we conclude that a larger time resolution im-
proves traffic prediction and therefore anomaly detec-
tion capabilities. However, a larger resolution also
negatively influences the detection speed since an
anomaly can only be detected after a time slot equal
to the resolution has passed in the worst case.
For the prediction step, we propose using the MT-
GNN algorithm with a single feature input using a
5 minute time resolution because it provides a good
trade-off between prediction capabilities, anomaly
detection speed, and necessary training resources. For
the anomaly detection step, we propose the DONE al-
gorithm since it significantly outperforms other tested
VEHITS 2024 - 10th International Conference on Vehicle Technology and Intelligent Transport Systems
254
12:00 13:00 14:00 15:00 16:00 17:00
40
60
80
(12:35,67.93)
(12:35,87.04)
(12:40,45.02)
(12:40,56.46)
Time of day
Speed (km/h)
Actual Speed
Predicted Speed
Figure 3: Predicted vs. actual speed on 13/01/2021 for sensor 42. The points at which our system detected anomalies are
marked. Correct detections also include their speed value and timestamp for the actual and predicted values.
algorithms on our dataset.
We tested our recommended configuration on a
real-world use case which shows that our proposed
system is able to detect anomalous traffic situations.
However, additional real-world calibration and vali-
dation is necessary to ensure correct behaviour.
7 CHALLENGES & FUTURE
WORK
In this section, we make suggestions for future work
based on the challenges we encountered. These chal-
lenges are related to data and deep learning and oc-
curred during the data processing as well as training
stage. We list these challenges together with future
work below.
• During research, the following challenges regard-
ing traffic events were encountered:
– Traffic accidents are relatively scarce in com-
parison to regular traffic which complicates
their use for deep learning applications since
they typically require a substantial amount of
data.
– The benchmarked traffic prediction algorithms
predict regular anomalous behaviour, such as
morning rush hour. These events are also
present in labelled data making making them
indistinguishable from actual anomalous traffic
events. This hinders the use of this data since
we do not want to detect regular anomalous be-
haviour.
The combined effect of these made it that we were
unable to use real-world traffic event data for our
training. As a result, we had to manually inject
anomalies which may not stroke with real traffic
situations. This could be improved by manually
injecting anomalies on multiple nodes based on
their vicinity/connectivity to simulate the effects
of real events. Real-world event data could form
the basis for these injected events to make them as
realistic as possible.
• Additional thorough training, calibration and val-
idation of our system could be done on real-world
event data to ensure its effectiveness.
• Data and tools for constructing graphs are spread
out across different sources and files impeding the
ease of this task. A single graph creation tool
for road networks from a standardised data format
could improve this process.
• More experiments could be performed using dif-
ferent sequence lengths for the same time resolu-
tions. In case additional traffic features are avail-
able, such as weather or number of vehicles, a
combination of them could be tested to determine
their effectiveness as predictors.
• During our research, a new framework for com-
paring traffic prediction algorithms was launched
by (Liang et al., 2023) which includes all the al-
gorithms we tested among others. Such a com-
mon framework could reduce some challenges we
faced and is therefore an interesting basis for fur-
ther research.
ACKNOWLEDGEMENTS
This research was made possible by the Traffic Cen-
tre Division of the Agency for Roads and Traffic of
the Flemish Government (Verkeerscentrum van het
Agentschap Wegen en Verkeer van de Vlaamse Over-
heid). Their traffic data was instrumental in the suc-
cessful realisation of this research.
Map data copyrighted Open-
StreetMap contributors and available from
https://www.openstreetmap.org.
History-Based Road Traffic Anomaly Detection Using Deep Learning and Real-World Data
255

REFERENCES
Agentschap Wegen en Verkeer (2023). Wegen en verkeer.
https://wegenenverkeer.be/. Accessed on 27 May
2023.
Bandyopadhyay, S., Lokesh, N., Vivek, S. V., and Murty,
M. N. (2020). Outlier resistant unsupervised deep ar-
chitectures for attributed network embedding. WSDM
2020 - Proceedings of the 13th International Confer-
ence on Web Search and Data Mining, pages 25–33.
Deng, L., Lian, D., Huang, Z., and Chen, E. (2022). Graph
convolutional adversarial networks for spatiotemporal
anomaly detection. IEEE Transactions on Neural Net-
works and Learning Systems, 33:2416–2428.
Ding, K., Li, J., Bhanushali, R., and Liu, H. (2019). Deep
anomaly detection on attributed networks. Proceed-
ings, pages 594–602.
Fan, H., Zhang, F., and Li, Z. (2020). Anomalydae: Dual
autoencoder for anomaly detection on attributed net-
works. ICASSP, IEEE International Conference on
Acoustics, Speech and Signal Processing - Proceed-
ings, 2020-May:5685–5689.
Flemish Government (2022). Rapport verkeersindicatoren
snelwegen vlaanderen 2022. https://www.verkeersce
ntrum.be/studies/rapport-verkeersindicatoren-snelw
egen-vlaanderen-2022. Accessed on 20 November
2023.
Liang, Y., Shao, Z., Wang, F., Zhang, Z., Sun, T., and Xu,
Y. (2023). Basicts: An open source fair multivariate
time series prediction benchmark. Lecture Notes in
Computer Science, pages 87–101.
Liu, K., Dou, Y., Zhao, Y., Ding, X., Hu, X., Zhang, R.,
Ding, K., Chen, C., Peng, H., Shu, K., Chen, G. H.,
Jia, Z., and Yu, P. S. (2022a). Pygod: A python
library for graph outlier detection. arXiv preprint
arXiv:2204.12095.
Liu, K., Dou, Y., Zhao, Y., Ding, X., Hu, X., Zhang, R.,
Ding, K., Chen, C., Peng, H., Shu, K., Sun, L., Li,
J., Chen, G. H., Jia, Z., and Yu, P. S. (2022b). Bond:
Benchmarking unsupervised outlier node detection on
static attributed graphs. Neural Information Process-
ing Systems.
Liu, R., Zhao, S., Cheng, B., Yang, H., Tang, H., and Yang,
F. (2020). St-mfm: A spatiotemporal multi-modal fu-
sion model for urban anomalies prediction. Frontiers
in Artificial Intelligence and Applications, 325:1922–
1929.
OpenStreetMap (2023). Openstreetmap. https://www.open
streetmap.org/. Accessed on 27 May 2023.
Sabour, S., Rao, S., and Ghaderi, M. (2021). Deepflow:
Abnormal traffic flow detection using siamese net-
works. 2021 IEEE International Smart Cities Con-
ference, ISC2 2021.
Shao, Z., Zhang, Z., Wang, F., Wei, W., and Xu, Y. (2022).
Spatial-temporal identity: A simple yet effective base-
line for multivariate time series forecasting; spatial-
temporal identity: A simple yet effective baseline for
multivariate time series forecasting. CIKM ’22: Pro-
ceedings of the 31st ACM International Conference on
Information & Knowledge Management.
Sun, F., Dubey, A., and White, J. (2018). Dxnat - deep
neural networks for explaining non-recurring traf-
fic congestion. Proceedings - 2017 IEEE Interna-
tional Conference on Big Data, Big Data 2017, 2018-
January:2141–2150.
Tang, S. and Gao, H. (2005). Traffic-incident detection-
algorithm based on nonparametric regression. IEEE
Transactions on Intelligent Transportation Systems,
6(1):38–42.
Tedjopurnomo, D. A., Bao, Z., Zheng, B., Choudhury,
F. M., and Qin, A. K. (2022). A survey on mod-
ern deep neural network for traffic prediction: Trends,
methods and challenges. IEEE Transactions on
Knowledge and Data Engineering, 34:1544–1561.
Weil, R., Wootton, J., and Garc
´
ıa-Ortiz, A. (1998). Traffic
incident detection: Sensors and algorithms. Mathe-
matical and Computer Modelling, 27(9):257–291.
Wu, Z., Pan, S., Long, G., Jiang, J., Chang, X., and Zhang,
C. (2020). Connecting the dots: Multivariate time se-
ries forecasting with graph neural networks. Proceed-
ings of the ACM SIGKDD International Conference
on Knowledge Discovery and Data Mining, 20:753–
763.
Wu, Z., Pan, S., Long, G., Jiang, J., and Zhang, C. (2019).
Graph wavenet for deep spatial-temporal graph mod-
eling. IJCAI International Joint Conference on Artifi-
cial Intelligence, 2019-August:1907–1913.
Ye, J., Zhao, J., Ye, K., and Xu, C. (2020). How to build a
graph-based deep learning architecture in traffic do-
main: A survey. IEEE Transactions on Intelligent
Transportation Systems, 23:3904–3924.
Zhang, H., Zhao, S., Liu, R., Wang, W., Hong, Y., and Hu,
R. (2022). Automatic traffic anomaly detection on the
road network with spatial-temporal graph neural net-
work representation learning. Wireless Communica-
tions & Mobile Computing.
Zhang, M., Li, T., Shi, H., Li, Y., and Hui, P. (2019).
A decomposition approach for urban anomaly de-
tection across spatiotemporal data. IJCAI Inter-
national Joint Conference on Artificial Intelligence,
2019-August:6043–6049.
Zhu, L., Wang, B., Yan, Y., Guo, S., and Tian, G. (2022). A
novel traffic accident detection method with compre-
hensive traffic flow features extraction. Signal, Image
and Video Processing.
VEHITS 2024 - 10th International Conference on Vehicle Technology and Intelligent Transport Systems
256
