
Enhancing Predictive Modeling in Emergency Departments
Mojgan Kouhounestani
a
, Long Song
b
, Ling Luo
c
and Uwe Aickelin
d
School of Computing and Information Systems, University of Melbourne, Grattan Street, Parkville, 3010, VIC, Australia
Keywords:
Electronic Health Records, Hospitalisation, Target Encoding, Nominal Features, Predictive Data Mining.
Abstract:
Increasing global Emergency Department (ED) visits, exacerbated by COVID-19, has presented multiple chal-
lenges in recent years. Electronic Health Records (EHRs) as comprehensive digital repositories of patient
health information offer a pathway to construct prediction systems to address these issues. However, the het-
erogeneity of EHRs complicates accurate predictions. A notable challenge is the prevalence of high-cardinality
nominal features (NFs) in EHRs. Due to their numerous distinct values, these features are often excluded from
the analysis, risking information loss, reduced accuracy, and interpretability. This study proposes a framework,
integrating a preprocessing technique with target encoding (TE-PrepNet) into machine learning (ML) models
to address challenges of NFs from MIMIC-IV-ED. We evaluate performance of TE-PrepNet in two specific
ED-based prediction tasks: triage-based hospital admissions and ED reattendance within 72 hours at discharge
time. Incorporating three NFs, our approach demonstrates improvements compared to the baseline and out-
performs previous research that overlooked NFs. Random forest model with TE-PrepNet in the prediction
of hospitalisation achieved an AUROC of 0.8458, compared to the baseline AUROC of 0.7520. For the pre-
diction of ED reattendance within 72 hours, the utilisation of XGBoost yielded an improvement, attaining an
AUROC of 0.6975, outperforming the baseline AUROC of 0.6166.
1 INTRODUCTION
In recent years, the application of artificial intelli-
gence has increased in various aspects of modern life,
including in medicine. The speed, superior perfor-
mance, and accuracy of machine learning (ML) mod-
els are motivators for their widespread use in the med-
ical and health fields. ML models serve as decision-
making aids to clinicians to enhance and support pa-
tient access to care. Furthermore, they can repli-
cate medical expertise and workflows in repetitive
tasks, allowing physicians to focus on higher-value
jobs (Liu et al., 2022). Therefore, ML has enor-
mous potential to improve the health and well-being
of the healthcare industry. The Emergency Depart-
ment (ED) is an important part of the healthcare sys-
tem that provides immediate medical attention to pa-
tients. The demand for ED services has increased in
recent years owing to an ageing population and lim-
ited access to primary care (Brownell et al., 2014),
further compounded by the emergence of the COVID-
a
https://orcid.org/0000-0001-7935-6410
b
https://orcid.org/0000-0001-8494-4364
c
https://orcid.org/0000-0002-1363-8308
d
https://orcid.org/0000-0002-2679-2275
19 pandemic. This escalating demand for emergency
care leads to overcrowding in the ED, extended ser-
vice delays, prolonged waiting times, and declined
quality of care. This ultimately affects the overall sat-
isfaction of patients (Kusumawati et al., 2019) and in-
creased in-hospital mortality (Guttmann et al., 2011).
Electronic Health Record (EHR) is a compre-
hensive digital repository of a patient’s health in-
formation generated through various encounters in
different healthcare settings. It is intended to im-
prove healthcare practitioners’ efficiency and work-
flow by producing a complete record of a patient’s
clinical interaction and assisting in other care-related
activities, such as providing evidence-based decision
support, maintaining quality, and tracking outcomes
(H
¨
ayrinen et al., 2008). Most Australian public hospi-
tals now implement an EHR system, enabling health-
care providers to gain easier access to critical patient
information (Mollart et al., 2020). EHRs have be-
come indispensable tools in ED, allowing clinicians
quick access to important patient information. Such
accessibility holds the potential to increase the qual-
ity of care and minimise the likelihood of errors. EHR
adoption also improves communication and coordina-
tion between EDs and other healthcare professionals,
Kouhounestani, M., Song, L., Luo, L. and Aickelin, U.
Enhancing Predictive Modeling in Emergency Departments.
DOI: 10.5220/0012568900003699
Paper published under CC license (CC BY-NC-ND 4.0)
In Proceedings of the 10th International Conference on Information and Communication Technologies for Ageing Well and e-Health (ICT4AWE 2024), pages 37-46
ISBN: 978-989-758-700-9; ISSN: 2184-4984
Proceedings Copyright © 2024 by SCITEPRESS – Science and Technology Publications, Lda.
37

ensuring patients’ continuity of treatment even if they
are moved to another facility.
EHRs encompass an expansive array of data types,
spanning from, numerical data - such as blood pres-
sure; categorical data like pain scale assessments;
textual information including prescription details- to
even temporal data, indicating the timing of mea-
surements. This extensive variety of data types con-
tributes to the heterogeneity of this dataset. On the
other hand, most ML algorithms are primarily de-
signed to handle numerical data and face difficulties
when dealing with non-numerical types like categor-
ical data, which can be categorised into nominal data
(without any inherent order) and ordinal data (char-
acterised by a specific order). Despite significance
of this information in enhancing the interpretability
of ML models, they pose challenges. Conventional
techniques can convert these features into numerical
variables; however, the increasing number of unique
values results in high-dimensional feature matrix and
computational challenges, especially when used with
computationally demanding models.
In recent studies, particularly in the field of
medicine, there is a growing trend of using a subset
of values extracted from nominal features (NFs) to a
harmonious balance between optimising data utility
and managing the dimension of the dataset. Nonethe-
less, this approach has potential downsides, including
the risk of losing valuable information and heavily
relying on domain expertise to select the most rel-
evant values. Therefore, in numerous applications,
these features are often disregarded or considered to
be leveraging domain knowledge, so only a subset of
their distinctive values is considered. In this study,
our contributions are to:
• Tackle the challenges associated with NFs in
EHRs by employing the proposed target encoding
preprocessing framework (TE-PrepNet).
• Optimise high-cardinality NFs handling by min-
imising dependency on domain experts, while
maximising the integration of embedded values.
This optimisation is accomplished through incor-
porating the TE-PrepNet.
• Assess two distinct ED-based prediction tasks:
prediction of hospital admissions at the time of
triage in the ED; prediction of reattendance to the
ED within 72 hours after discharge.
We applied the target encoding approach on a
set of chosen NFs (race, arrival transport mode, and
chief complaint), encompassing both high and low-
cardinality characteristics, which are extracted from
the Medical Information Mart for Intensive Care
IV Emergency Department (MIMIC-IV-ED) dataset
(Johnson et al., 2021). The results highlighted the
performance enhancements and effectiveness of us-
ing the TE-PrepNet on both of the aforementioned
prediction tasks. In particular, the implementation of
random forest with target encoding achieved an AU-
ROC of 0.8458, outperforming the baseline AUROC
of 0.7520. Furthermore, in predicting 72-hour reat-
tendance, the use of XGBoost with target encoding
achieved an AUROC of 0.6975, showing an improve-
ment from the baseline’s previous AUROC of 0.6166.
2 RELATED WORK
Given the continual influx of data into EHRs, the in-
tegration of ML holds promise in facilitating com-
prehensive analysis. By discerning trends, detecting
patterns, and offering predictions pertaining to a pa-
tient’s well-being, ML can play a pivotal role in en-
hancing healthcare. In recent years, ML models have
capitalised on the potential offered by EHRs to un-
dertake a spectrum of predictions pertinent to the ED.
These efforts contain predictions related to hospital
admission (Barak-Corren et al., 2017; Xie et al., 2022;
Hong et al., 2018; Graham et al., 2018; Al Shal-
abi et al., 2006), early prediction of sepsis or septic
shock in the ED (Wardi et al., 2021), predictions con-
cerning the length of stay within the ED (Gurazada
et al., 2022; Rahman et al., 2020), as well as fore-
casts regarding the length of stay for COVID-19 pa-
tients specifically within the ED (Etu et al., 2022). So,
implementing early prediction models for patient ad-
missions can be beneficial in addressing the problem
of long boarding times and expediting resource allo-
cation, and enhancing overall patient care efficiency.
Conventional techniques, such as one-hot encod-
ing (or dummy encoding), have been employed in the
handling of nominal variables with a limited number
of distinct values (Hancock and Khoshgoftaar, 2020).
These methods effectively convert a nominal variable
with N unique values into N new variables (or N − 1
variables in the case of dummy encoding) to cap-
ture its categorical nature. However, their effective-
ness significantly decreases when dealing with NFs
with many distinct values, primarily due to the inher-
ent challenge of high dimensionality. The escalation
in dimensionality poses computational and interpre-
tational difficulties, limiting the applicability of these
methods in scenarios where NFs exhibit a multitude
of unique values.
Apart from employing one-hot encoding, propos-
ing the use of clustering techniques is also an option.
These techniques involve grouping individual values
into K sets. Although this approach results in fewer
ICT4AWE 2024 - 10th International Conference on Information and Communication Technologies for Ageing Well and e-Health
38

introduced variables compared to one-hot encoding
(K << N) (Micci-Barreca, 2001), in cases involving
high-cardinality NFs, the challenge of high dimen-
sionality persists because the number of clusters, K,
remains relatively large.
Achieving the right balance between dimension-
ality reduction and information retention is essential,
guided by domain-specific insights (Xie et al., 2022;
Hong et al., 2018; Barak-Corren et al., 2017). In this
approach, domain knowledge is leveraged to select a
subset of distinctive values from NFs, which are then
incorporated as binary features into ML models.
Target-based techniques, which leverage informa-
tion pertaining to the target variable, often demon-
strate superior performance compared to approaches
that neglect such information, particularly when deal-
ing with high-cardinality NFs (Pargent et al., 2022).
The utilisation of score-based target encoding to pre-
dict unplanned hospitalisations among elderly pa-
tients has enhanced the performance of ML models
(Nazyrova et al., 2022). In addition to demographic
attributes, their analysis extended to encompass sub-
sets of drug and disease categories. Notably, the high-
est cardinality among the features was linked to 31
distinct values, significantly lower than what we in-
troduce as high-cardinality features with thousands of
distinct values.
3 METHODOLOGY
The primary objective of this approach is to con-
vert NFs into continuous scalar values, compatible
with ML models. This conversion is achieved while
preserving the original dimensionality of the dataset
without introducing additional attributes. Fig. 1 pro-
vides an overview of the training phase of the afore-
mentioned prediction tasks.
3.1 Target Encoding
The core concept involves assigning a probability (
ˆ
X
l
)
estimate to each value (l) of the nominal variable (X),
based on its association with the outcome attribute
(y
j
) on the training set, as depicted in Equation 1,
where n
l
represents the frequency of occurrence of
level l in the training set (Pargent et al., 2022).
ˆ
X
l
=
1
n
l
n
l
∑
j=1
y
j
(1)
By incorporating this probability estimate, nominal
values are effectively transformed into a format that
captures the likelihood of information pertaining to
the target attribute (Micci-Barreca, 2001). This en-
ables the utilisation of nominal data in ML algo-
rithms, enhancing their ability to leverage the proba-
bilistic characteristics of the data. The target variable
in this context can be associated with either binary
classification tasks or multi-class classification tasks.
3.2 Handling Nominal Features
This work centers on the incorporation of NFs, char-
acterised by a substantial prevalence of distinct val-
ues. The first and straightforward method involves re-
placing each nominal value with corresponding scores
generated through target encoding. However, this ini-
tial method is not robust enough to adequately address
the complexities of our data. In practical scenarios,
certain records in the dataset may exhibit multiple dis-
tinct values for specific nominal variables. Consider,
for instance, the inclusion of chief complaints as an
NF in the dataset, wherein a single record may en-
compass multiple distinct complaint names. There-
fore, an important challenge arises due to the exis-
tence of diverse values for specific NF during partic-
ular instances. Another challenge is that, when deal-
ing with high-cardinality nominal values, some values
may be unseen in the training set. Consequently, ad-
dressing previously unseen values in the test dataset
becomes imperative. To tackle these challenges, we
design TE-PrepNet with following two phases:
During the training phase, we handle NFs in four
steps:
I. Discern various expressions within each nomi-
nal value.
II. Apply target encoding to assign numerical
values to distinct expressions associated with
these features.
III. Establish a dictionary to facilitate the consol-
idation of these encoded values across all ex-
pressions within the training dataset.
IV. Compute cumulative sum of scores linked with
each expression in instances where patients ex-
hibit multiple complaints during their ED vis-
its. These The diverse values are characterised
by value separation via ‘,‘ resulting in the gen-
eration of unique expressions.
Then the testing phase is embarked upon:
• If expressions were previously seen during train-
ing, corresponding numeric values are directly as-
signed based on the established dictionary.
• If expressions were unseen during training, we
calculate the target score in two steps by compar-
ing the unseen new expression with the expression
in our dictionary:
Enhancing Predictive Modeling in Emergency Departments
39
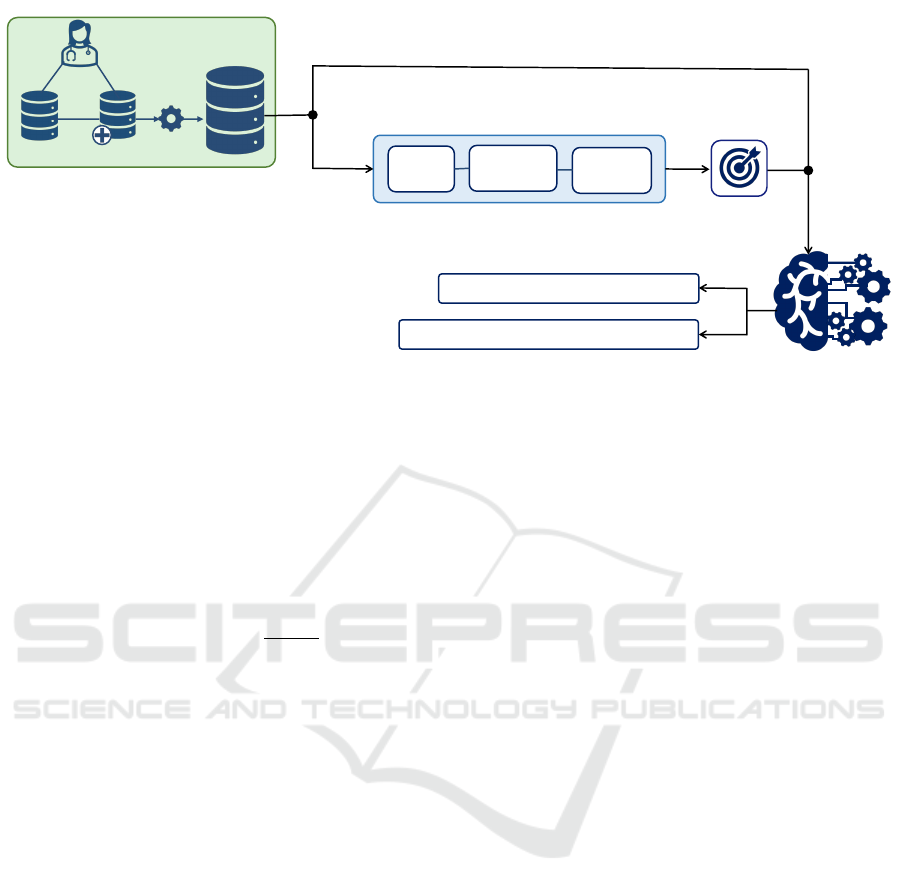
MIMIC-IV
MIMIC-IV-ED
Target Encoding
Splitting
Extracting
Expressions
Creating
Dictionary
NFs
Preprocessing NFs
Task 1. Hospital Admissions
Task 2. Reattendance at ED within 72 Hours
EHR
ED-MIMIC-Benchmark
ML Models
Prediction Tasks
Numerical Features
Figure 1: The schematic representation of the training phase. NFs refer to the nominal features. The preprocessing procedures
are specifically applied to high-cardinality NFs.
i. Find five most similar expressions based on
Jaccard similarity, which quantifies the simi-
larity between two expressions (A and B) by
assessing the fraction of the intersection of
their sets divided by the union of all values
belonging to the two expressions (Zahrotun,
2016).
J(A, B) =
|A ∩ B|
|A ∪ B|
(2)
ii. Calculate the mean of target scores for the
closest expressions.
These stages make a significant contribution to
mitigating challenges associated with both low- and
high-cardinality NFs, effectively addressing complex-
ities posed by previously unseen expressions. No-
tably, our approach demonstrates universal applicabil-
ity, proving effective for NFs with varying cardinali-
ties, including those with thousands of unique values.
4 EXPERIMENTS
4.1 Experimental Setup
A combination of two datasets, MIMIC-IV and
MIMIC-IV-ED, was employed in this study. Subse-
quent to this compound, various filters, detailed in
the following subsection, were applied. Post-filtering,
440, 285 instances representing unique ED visits for
the first task and 231, 868 instances corresponding to
ED episodes involving reattendance within a 72-hour
time frame were retained for further analysis.
We employed a diverse set of ML models, encom-
passing logistic regression (LR), gradient boosting
(GB), random forest (RF), and an XGBoost (XGB),
to make predictions for the two tasks under investi-
gation. The selection of these four ML models was
deliberate, with the aim of facilitating a compara-
tive analysis with previous research conducted on the
MIMIC-IV-ED dataset.
For assessing the model’s performance, we em-
ployed 4 key metrics: Area Under the Receiver Oper-
ating Characteristic (AUROC) (Bradley, 1997), Area
Under the Precision-Recall Curve (AUPRC), Sensi-
tivity, and Specificity (Sofaer et al., 2019).
To ensure the relevance and quality of the dataset,
a filtering method was applied to eliminate ED vis-
its made by patients below 18 years of age and those
lacking primary emergency triage category assign-
ments. Additionally, the MIMIC-EXTRACT (Wang
et al., 2020) was utilised for outlier detection. Each
patient visit to the ED is denoted by a unique sub ject
id
linked to a corresponding stay
id
. In cases where an
ED visit is followed by an inpatient stay, the stay
id
can be associated with an inpatient admission identi-
fied as hadm
id
in the edstays table.
4.2 Baseline
This study leveraged a standardised reference frame-
work denoted as the ”ED-MIMIC Benchmark” (Xie
et al., 2022). The benchmark incorporates a com-
prehensive dataset, encompassing variables derived
from the MIMIC-IV-ED (Johnson et al., 2021) and
MIMIC-IV (Johnson et al., 2020). Previous work
(Xie et al., 2022) utilised 64 numeric features, and
our endeavor involved the reproduction of its results.
In augmenting this benchmark, we introduced previ-
ously overlooked three NFs and implemented the con-
ICT4AWE 2024 - 10th International Conference on Information and Communication Technologies for Ageing Well and e-Health
40

ventional technique of one-hot encoding to address
the integration of these new NFs. Thus the baseline
was updated to ensure a consistent number of selected
features. This updated baseline serves as a founda-
tional reference point for our study, providing a stan-
dardised framework for comparison and evaluation.
It is noteworthy to mention that, in the process
of updating the benchmark encompassing 67 features,
various methods were explored, including the bitmap
technique. Initially, an attempt was made to trans-
form all extant features into a binary representation,
leading to a training dataset characterised by 25, 586
columns. Despite utilising a high-performance com-
puting system with 256 gigabytes of memory, the cho-
sen configuration proved to be computationally inop-
erable. Consequently, in order to address the compu-
tational challenges, the decision was made to adopt
one-hot encoding as the baseline technique to handle
NFs. This approach not only facilitates the handling
of high cardinality NFs but also remains computation-
ally feasible for the entire dataset.
4.3 Feature Overview
In our dataset, we incorporate three distinct sets of
selected NFs: race, arrival transport mode, and chief
complaint. These features encompass both low- and
high-cardinality characteristics. Specifically, we des-
ignate race and arrival transport modes as demo-
graphic features. Notably, in the training dataset, the
arrival transport mode feature comprises only five dis-
tinct values, while the race feature exhibits greater di-
versity with 34 unique values, enriching the dataset’s
variability. The chief complaint, with 52, 478 distinct
values, represents a high-cardinality NF integral to
our study.
Table 1 provides a comprehensive overview of
the features employed in the prediction tasks, en-
compassing demographic, medical characteristics, ar-
rival transport mode, primary concerns (10 binary fea-
tures), and history of patients’ visits to the ED, ICU
and hospitals. Due to the extensive number of dis-
tinct values in the chief complaint and the race vari-
ables, it is impractical to present all values in the table.
In alignment with the features previously employed
in the ED-MIMIC Benchmark, our ML models also
incorporate an set of 35 binary features, serving as
indicators for patients’ comorbidities. By including
these features, we aim to maintain consistency with
the benchmark’s established framework and leverage
the same set of attributes to ensure comparability and
coherence in our modeling approach.
Medical features, such as vital signs, may be
recorded multiple times during a single ED visit. For
the first prediction task, the ML models used the val-
ues from the first set of measurements. Conversely,
for the prediction of reattendance to the ED within 72
hours, the most recent measurements are taken into
consideration. Moreover, in the second task, three
additional features become available which were not
present at the time of triage, dedicated as 72-Hour
Reattendance Predictors in Table 1. These features,
namely length of stay at the ED, the number of med-
ications, and the count of medication reconciliations,
are specifically utilised for the second task.
5 RESULTS
Table 2 shown in the TE-PrepNet yields substan-
tially better results in the realm of predicting patient
hospitalisation within the ED at the time of triage.
The outcomes distinctly reflect that the integration
of nominal attributes, particularly those with high-
cardinality through the utilisation of TE-PrepNet,
substantially enhances the performance of all mod-
els. This table effectively underscores the pronounced
effectiveness of our proposed methodology in con-
trast to prior investigations involving the MIMIC-IV-
ED dataset, which inadvertently neglected these at-
tributes, and even with updated baseline that use tra-
ditional method of one-hot encoding for handle NFs.
The results show that RF model achieved notable
performance in predicting hospitalisation during the
triage process, boosting AUROC and AUPRC values
to 0.8459 and 0.8148, respectively.
Table 3 presents the results of TE-PrepNet, con-
sidering three additional NFs, in comparison to the
performance of the baseline for the prediction of reat-
tendance at ED within 72 hours. As delineated earlier,
this predictive task benefits from an extended feature
set, culminating in a total of 70 input features. The
XGBoost model exhibits superior predictive perfor-
mance for reattendance within 72 hours among dis-
charged patients, achieving an AUROC of 0.6975.
This performance surpasses other models and even
demonstrates an improvement compared to the base-
line.
6 DISCUSSION
We exploited the ED-MIMIC-Benchmark pipeline to
analyse the newly released MIMIC-IV-ED database,
focusing on NFs often overlooked in ML tasks. Our
findings demonstrate that the incorporation of both
low and high-cardinality NFs substantially enhances
the performance of ML models in predicting hospi-
Enhancing Predictive Modeling in Emergency Departments
41

Table 1: Basic characteristics of the dataset. Mean (SD) values are presented for the continuous variables; and count (%) is
presented for the binary or categorical variables. ED LOS: Length of stay at ED in minutes.
Feature name Overall Discharge Hospitalised 72-hour ED Reattendance
ED Visits 440285 231868 208417 15791
Age 52.8 (20.6) 46.3 (19.4) 60.0 (19.5) 50.5 (18.7)
Gender
Female 239305 (54.4 %) 133573 (57.6%) 105732 (50.7%) 7386 (46.8%)
Male 200980 (45.6%) 98295 (42.4%) 102685 (49.3%) 8405 (53.2%)
Arrival Transport Mode
Ambulance 158304 (36.0%) 52333 (22.6%) 105971 (50.8%) 5460 (34.6%)
Helicopter 560 (0.1%) 32 (0.0%) 528 (0.3%) 3 (0.0%)
Other 1351 (0.3%) 726 (0.3%) 625 (0.3%) 41 (0.3%)
Unknown 15180 (3.4%) 7861 (3.4%) 7319 (3.5%) 1008 (6.4%)
Walk 264890 (60.2%) 170916 (73.7%) 93974 (45.1%) 9279 (58.8%)
Triage Acuity
Level 1 25249 (5.7%) 5338 (2.3%) 19911 (9.6%) 478 (3.0%)
Level 2 146837 (33.4%) 45332 (19.5%) 101505 (48.7%) 3947 (25.0%)
Level 3 236958 (53.8%) 151458 (65.3%) 85500 (41.0%) 10183 (64.5%)
Level 4 30074 (6.8%) 28624 (12.3%) 1450 (0.7%) 1124 (7.1%)
Level 5 1167 (0.3%) 1116 (0.5%) 51 (0.0%) 59 (0.4%)
Pain Scale 4.2 (3.6) 4.7 (3.6) 3.6 (3.5) 4.8 (3.8)
Vital Signs
Temperature (Celsius) 36.7 (0.5) 36.7 (0.5) 36.7 (0.6) 36.7 (0.4)
Heart Rate (bpm) 85.0 (17.5) 83.9 (16.3) 86.3 (18.6) 79.9 (13.9)
Respiratory Rate (bpm) 17.6 (2.5) 17.3 (2.1) 17.9 (2.8) 17.0 (1.9)
Oxygen Saturation (%) 98.4 (2.4) 98.8 (2.0) 97.9 (2.7) 98.2 (2.9)
Systolic BP (mmHg) 134.8 (22.1) 135.1 (20.7) 134.5 (23.7) 128.8 (19.5)
Diastolic BP (mmHg) 77.5 (14.7) 78.8 (13.8) 76.0 (15.6) 76.0 (13.5)
Previous Visits
30-Day ED Visits 0.2 (0.8) 0.2 (0.8) 0.3 (0.8) 1.1 (2.3)
90-Day ED Visits 0.5 (1.6) 0.5 (1.6) 0.6 (1.6) 2.3 (4.8)
360-Day ED Visits 1.4 (4.2) 1.2 (4.1) 1.6 (4.2) 6.0 (12.6)
30-Day Hospitalisation 0.2 (0.5) 0.1 (0.4) 0.2 (0.6) 0.6 (1.3)
90-Day Hospitalisation 0.4 (1.0) 0.2 (0.8) 0.5 (1.2) 1.2 (2.7)
360-Day Hospitalisation 1.0 (2.7) 0.6 (2.2) 1.4 (3.1) 3.3 (7.6)
30-Day ICU Stays 0.0 (0.2) 0.0 (0.1) 0.0 (0.2) 0.0 (0.2)
90-Day ICU Stays 0.0 (0.3) 0.0 (0.2) 0.1 (0.3) 0.1 (0.3)
360-Day ICU Stays 0.1 (0.5) 0.0 (0.3) 0.2 (0.6) 0.2 (0.6)
Chest Pain
False 409599 (93.0) 218112 (94.1) 191487 (91.9) 14842 (94.0)
True 30686 (7.0) 13756 (5.9) 16930 (8.1) 949 (6.0)
Abdominal Pain
False 389515 (88.5) 206134 (88.9) 183381 (88.0) 13746 (87.0)
True 50770 (11.5) 25734 (11.1) 25036 (12.0) 2045 (13.0)
Headache
False 423730 (96.2) 219938 (94.9) 203792 (97.8) 15130 (95.8)
True 16555 (3.8) 11930 (5.1) 4625 (2.2) 661 (4.2)
Shortness of Breath
False 439002 (99.7) 231468 (99.8) 207534 (99.6) 15765 (99.8)
True 1283 (0.3) 400 (0.2) 883 (0.4) 26 (0.2)
Back Pain
False 422691 (96.0) 219524 (94.7) 203167 (97.5) 15144 (95.9)
True 17594 (4.0) 12344 (5.3) 5250 (2.5) 647 (4.1)
Cough
False 431030 (97.9) 226582 (97.7) 204448 (98.1) 15533 (98.4)
True 9255 (2.1) 5286 (2.3) 3969 (1.9) 258 (1.6)
ICT4AWE 2024 - 10th International Conference on Information and Communication Technologies for Ageing Well and e-Health
42

Table 1: Basic characteristics of the dataset. Mean (SD) values are presented for the continuous variables; and count (%) is
presented for the binary or categorical variables. ED LOS: Length of stay at ED in minutes (cont.).
Feature Name Overall Discharge Hospitalised 72-hour ED Reattendance
Nausea Vomiting
False 429639 (97.6) 226273 (97.6) 203366 (97.6) d 15379 (97.4)
True 10646 (2.4) 5595 (2.4) 5051 (2.4) 412 (2.6)
Fever Chills
False 425051 (96.5) 227233 (98.0) 197818 (94.9) 15377 (97.4)
True 15234 (3.5) 4635 (2.0) 10599 (5.1) 414 (2.6)
Syncope
False 432098 (98.1) 227467 (98.1) 204631 (98.2) 15615 (98.9)
True 8187 (1.9) 4401 (1.9) 3786 (1.8) 176 (1.1)
Dizziness
False 429377 (97.5) 225542 (97.3) 203835 (97.8) 15487 (98.1)
True 10908 (2.5) 6326 (2.7) 4582 (2.2) 304 (1.9)
72-Hour Reattendance Predictors
ED LOS (minutes) 385.4 (264.2) - - 407.6 (283.3)
# Medication 2.9 (3.3) - - 2.7 (3.2)
# Medication Reconcilation 6.1 (6.8) - - 5.2 (6.6)
Table 2: Performance comparison of TE-PrepNet approach
and baseline across different ML models for hospitalisa-
tion prediction at triage in the ED. Sens: Sensitivity. Spec:
Specificity.
Baseline (67 Features)
ML Model AUROC AUPRC Sens. Spec.
LR 0.7985 0.7751 0.7113 0.7274
RF 0.7520 0.7168 0.6908 0.7242
GB 0.7232 0.6755 0.6279 0.7147
XG Boost 0.7577 0.7183 0.6677 0.7162
TE-PrepNet (67 Features)
ML Model AUROC AUPRC Sens. Spec.
LR 0.8353 0.8030 0.7729 0.7440
RF 0.8458 0.8149 0.7736 0.7630
GB 0.8383 0.8103 0.7670 0.7560
XG Boost 0.8458 0.8142 0.7761 0.7624
tal admissions and reattendance at the ED within 72
hours following discharge. We successfully addressed
the challenge of handling these features with thou-
sands of unique values, all without relying on clinical
expertise to manually select important values for ML
tasks.
The establishment of a baseline through one-hot
encoding and the unsuccessful attempt using bitmap
highlight the inadequacy of solely adding features for
improved performance. This is especially notable for
NFs with numerous unique values. TE-PrepNet ex-
cels in addressing these challenges, efficiently man-
aging high-cardinality NFs to optimise performance
and mitigate the impact of unseen values in the test
set.
In high-cardinality NFs, such as the chief com-
plaint, it is greatly possible that during the testing
phase, numerous values emerge that did not appear in
Table 3: Performance comparison of TE-PrepNet and base-
line across different ML models for predicting ED reatten-
dance within 72 hours post triage. Sens: Sensitivity. Spec:
Specificity.
Baseline (70 Features)
ML Model AUROC AUPRC Sens. Spec.
LR 0.6267 0.0869 0.5816 0.5960
RF 0.5687 0.0679 0.5038 0.6026
GB 0.5730 0.0757 0.3822 0.7222
XGBoost 0.6166 0.0886 0.5812 0.5756
TE-PrepNet (70 Features)
ML Model AUROC AUPRC Sens. Spec.
LR 0.6888 0.1404 0.6137 0.6611
RF 0.6833 0.1441 0.6237 0.6447
GB 0.6905 0.1474 0.5997 0.6837
XGBoost 0.6975 0.1382 0.6224 0.6729
the training process. For instance, in both the first and
second prediction tasks, the chief complaint exhibits
9, 125 and 5, 092 previously unseen values in the re-
spective test sets. Methods like one-hot encoding tend
to ignore these unseen values during prediction. This
situation implies that a substantial amount of poten-
tially valuable information may be overlooked. Ad-
dressing the handling of high-cardinality NFs during
both the training and testing phases is crucial for im-
proving the model’s robustness and effectiveness in
capturing diverse and previously unseen data. Our
TE-PrepNet approach efficiently addresses this, max-
imising the use of all available information.
Variable Importance. Ten most predictive vari-
ables for both prediction tasks (based on RF feature
importance and LR coefficients) are shown in Figures
2 and 3, respectively. As depicted in Figure 2 for the
Enhancing Predictive Modeling in Emergency Departments
43
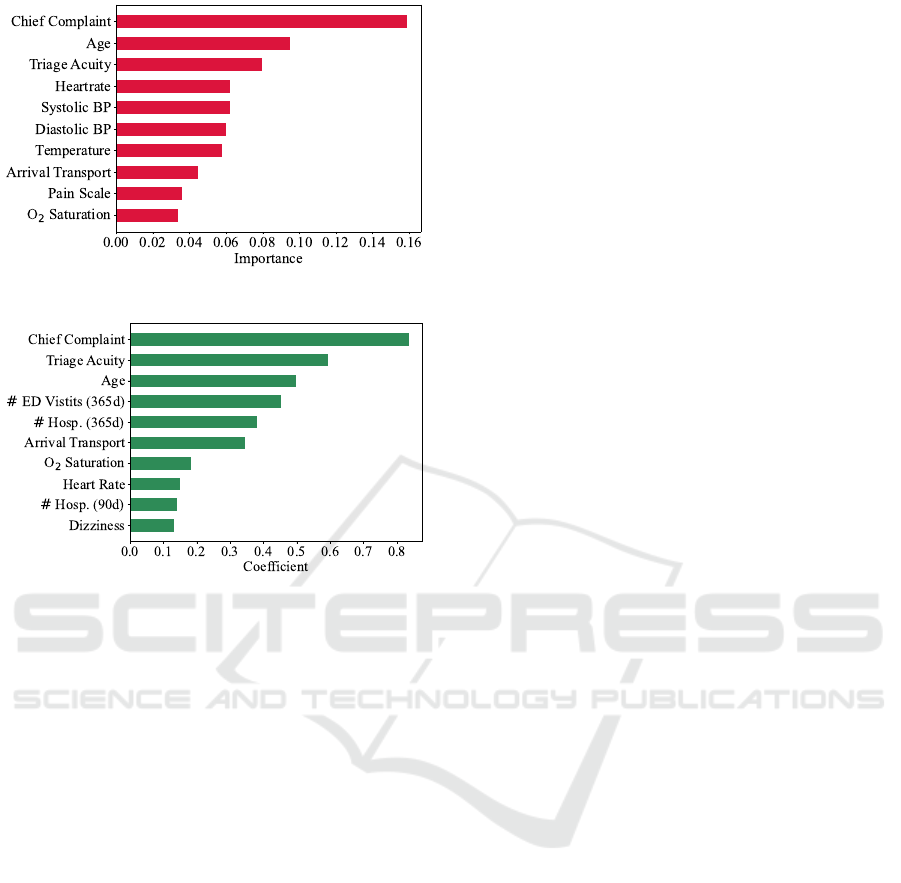
(a) Random Forest Feature Importance.
(b) Logistic Regression Coefficients.
Figure 2: Ten top important variables in the hospitalisa-
tion prediction task based on random forest variable im-
portance and logistic regression coefficients values. # ED
visits (365d): Number of ED visits within last year. # Hosp.
(365d): Number of hospitalisation within last year. # Hosp.
(90d): Number of hospitalisation within last 90 days.
prediction of hospitalisation at the time of the triage,
NFs — particularly chief complaint, encompassing a
substantial number of unique values, 52, 478 — con-
sistently rank at the top predictive variables. Impor-
tantly, these feature surpass the importance of triage
acuity and age. Moreover, the arrival transport mode
stands out as one of the ten most predictive variables,
as indicated by both RF feature importance and LR
coefficients. This signifies the great contribution of
the NFs to the predictive outcome. In Figure 2b it is
evident that the historical data pertaining to a patient’s
ED visits over the past year, along with the frequency
of hospitalisations within the last three months and
the last year, significantly contribute to the hospitali-
sation outcomes.
As previously mentioned, for the second predic-
tion task, emphasis is placed on utilising the most
recent values of all features for predictive analysis.
Figure 3 shows that for the prediction of ED reatten-
dance within 72 hours, chief complaint again is the
top most important feature. The utilisation of this fea-
ture became possible due to the implementation of the
TE-PrepNet, which allowed us to take advantage of
their entire valuable information. It is worth mention-
ing that conventional methods encounter significant
challenges when dealing with these features. These
features are incorporated into ML models, with no
dependence on clinician input, while preserving the
original dimensionality of the dataset. In Figure 3a,
the length of stay at the ED (ED LOS) stands out as
the second most influential predictive variable, as in-
dicated by the RF feature importance. ED LOS is ex-
clusively applicable to the second prediction task.
Imbalanced Dataset. In the context of the second
prediction task, there were a total of 15, 791 distinct
instances of reattendance at the ED within 72 hours.
This figure constitutes approximately 3.5% of the to-
tal episode count for the cohort. The dataset exhibited
a significant class imbalance, with instances of reat-
tendance being notably underrepresented. This im-
balance substantially contributed to a low AUPRC for
the task. Despite an enhancement in AUPRC com-
pared to the benchmark, the metric retained a rela-
tively modest value.
7 CONCLUSION
In this study, we highlight the efficacy of our tar-
get encoding preprocessing framework (TE-PrepNet)
in effectively managing nominal features inherent to
electronic health records in the context of two emer-
gency department based prediction tasks. While low-
cardinality nominal features can be managed using
various techniques, the handling of high-cardinality
nominal features, those encompassing thousands of
unique values, presents distinct challenges. These
challenges directly arise from two main issues: the
problem of high dimensionality, which becomes par-
ticularly problematic for particularly for computation-
ally expensive models, and the reliance on domain-
specific knowledge. The latter often results in either
overlooking valuable features or considering only a
subset of their potential values.
Our results reveal promising outcomes, with the
best predictive model for hospitalisation, random for-
est, achieving an AUROC of 0.8458. This perfor-
mance notably surpasses the baseline model that used
a conventional technique to handle these features and
achieved an AUROC of 0.7520 for this specific pre-
diction task. These findings highlight the contribution
of the nominal features in enhancing the predictive
accuracy of hospitalisation. In the prediction task for
reattendance at the emergency department within 72
ICT4AWE 2024 - 10th International Conference on Information and Communication Technologies for Ageing Well and e-Health
44
(a) Random Forest Feature Importance. (b) Logistic Regression Coefficients.
Figure 3: Ten top important variables for the prediction of ED reattendance within 72-hours. # Medication Recon. : Counts
of Medication Reconciliation. # ED Visits (30d): Number of ED visits within last month. ED LOS: Length of stay at ED. #
ED Visits (90d): Number of ED visits within last 90 days.
hours, it is noteworthy that the XGBoost emerged as
the top-performing model, achieving a AUROC score
of 0.6975. This represents an enhancement in predic-
tive performance compared to the baseline, where an
AUROC score of 0.6166 was reported for this model.
Future Work. In the next stage, we aim to tailor
target encoding techniques specifically for ED pre-
diction. This customisation will involve optimising
encoding methods to effectively capture unique pat-
terns in emergency data. We plan to integrate this
tailored target encoding seamlessly with our proposed
preprocessing steps, streamlining the data preparation
process and enhancing predictive accuracy.
REFERENCES
Al Shalabi, L., Shaaban, Z., and Kasasbeh, B. (2006). Data
mining: A preprocessing engine. Journal of Computer
Science, 2(9):735–739.
Barak-Corren, Y., Israelit, S. H., and Reis, B. Y. (2017).
Progressive prediction of hospitalisation in the emer-
gency department: uncovering hidden patterns to im-
prove patient flow. Emergency Medicine Journal,
34(5):308–314.
Bradley, A. P. (1997). The use of the area under the
roc curve in the evaluation of machine learning algo-
rithms. Pattern recognition, 30(7):1145–1159.
Brownell, J., Wang, J., Smith, A., Stephens, C., and Hsia,
R. Y. (2014). Trends in emergency department vis-
its for ambulatory care sensitive conditions by elderly
nursing home residents, 2001 to 2010. JAMA internal
medicine, 174(1):156–158.
Etu, E.-E., Monplaisir, L., Arslanturk, S., Masoud, S.,
Aguwa, C., Markevych, I., and Miller, J. (2022). Pre-
diction of length of stay in the emergency department
for covid-19 patients: A machine learning approach.
IEEE Access, 10:42243–42251.
Graham, B., Bond, R., Quinn, M., and Mulvenna, M.
(2018). Using data mining to predict hospital admis-
sions from the emergency department. IEEE Access,
6:10458–10469.
Gurazada, S. G., Gao, S., Burstein, F., and Buntine, P.
(2022). Predicting patient length of stay in australian
emergency departments using data mining. Sensors,
22(13):4968.
Guttmann, A., Schull, M. J., Vermeulen, M. J., and Stukel,
T. A. (2011). Association between waiting times
and short term mortality and hospital admission af-
ter departure from emergency department: population
based cohort study from ontario, canada. Bmj, 342.
Hancock, J. T. and Khoshgoftaar, T. M. (2020). Survey on
categorical data for neural networks. Journal of Big
Data, 7(1):1–41.
H
¨
ayrinen, K., Saranto, K., and Nyk
¨
anen, P. (2008). Def-
inition, structure, content, use and impacts of elec-
tronic health records: a review of the research liter-
ature. International journal of medical informatics,
77(5):291–304.
Hong, W. S., Haimovich, A. D., and Taylor, R. A. (2018).
Predicting hospital admission at emergency depart-
ment triage using machine learning. PloS one,
13(7):e0201016.
Johnson, A., Bulgarelli, L., Pollard, T., Celi, L. A., Mark,
R., and Horng IV, S. (2021). Mimic-iv-ed. PhysioNet.
Johnson, A., Bulgarelli, L., Pollard, T., Horng, S.,
Celi, L. A., and Mark, R. (2020). Mimic-iv.
PhysioNet. Available online at: https://physionet.
org/content/mimiciv/1.0/(accessed August 23, 2021).
Kusumawati, H. I., Magarey, J., and Rasmussen, P. (2019).
Analysis of factors influencing length of stay in the
emergency department in public hospital, yogyakarta,
indonesia. Australasian emergency care, 22(3):174–
179.
Liu, C., Tan, Z., and He, M. (2022). Overview of artificial
intelligence in medicine. In Artificial Intelligence in
Medicine: Applications, Limitations and Future Di-
rections, pages 23–34. Springer.
Micci-Barreca, D. (2001). A preprocessing scheme for
Enhancing Predictive Modeling in Emergency Departments
45

high-cardinality categorical attributes in classification
and prediction problems. ACM SIGKDD Explorations
Newsletter, 3(1):27–32.
Mollart, L., Newell, R., Geale, S. K., Noble, D., Norton,
C., and O’Brien, A. P. (2020). Introduction of pa-
tient electronic medical records (emr) into undergrad-
uate nursing education: an integrated literature review.
Nurse Education Today, 94:104517.
Nazyrova, N., Chaussalet, T. J., and Chahed, S. (2022).
Machine learning models for predicting 30-day read-
mission of elderly patients using custom target en-
coding approach. In Computational Science–ICCS
2022: 22nd International Conference, London, UK,
June 21–23, 2022, Proceedings, Part III, pages 122–
136. Springer.
Pargent, F., Pfisterer, F., Thomas, J., and Bischl, B.
(2022). Regularized target encoding outperforms tra-
ditional methods in supervised machine learning with
high cardinality features. Computational Statistics,
37(5):2671–2692.
Rahman, M. A., Honan, B., Glanville, T., Hough, P., and
Walker, K. (2020). Using data mining to predict
emergency department length of stay greater than 4
hours: Derivation and single-site validation of a deci-
sion tree algorithm. Emergency Medicine Australasia,
32(3):416–421.
Sofaer, H. R., Hoeting, J. A., and Jarnevich, C. S. (2019).
The area under the precision-recall curve as a perfor-
mance metric for rare binary events. Methods in Ecol-
ogy and Evolution, 10(4):565–577.
Wang, S., McDermott, M. B., Chauhan, G., Ghassemi, M.,
Hughes, M. C., and Naumann, T. (2020). Mimic-
extract: A data extraction, preprocessing, and repre-
sentation pipeline for mimic-iii. In Proceedings of the
ACM conference on health, inference, and learning,
pages 222–235.
Wardi, G., Carlile, M., Holder, A., Shashikumar, S., Hay-
den, S. R., and Nemati, S. (2021). Predicting pro-
gression to septic shock in the emergency department
using an externally generalizable machine-learning al-
gorithm. Annals of emergency medicine, 77(4):395–
406.
Xie, F., Zhou, J., Lee, J. W., Tan, M., Li, S., Rajnthern,
L. S., Chee, M. L., Chakraborty, B., Wong, A.-K. I.,
Dagan, A., et al. (2022). Benchmarking emergency
department prediction models with machine learning
and public electronic health records. Scientific Data,
9(1):658.
Zahrotun, L. (2016). Comparison jaccard similarity, cosine
similarity and combined both of the data clustering
with shared nearest neighbor method. Computer En-
gineering and Applications Journal, 5(1):11.
ICT4AWE 2024 - 10th International Conference on Information and Communication Technologies for Ageing Well and e-Health
46
