
An Integrated Decision Support System for Intra-Logistics Management
with Peripheral Storage and Centralized Distribution
Giulia Dotti
1 a
, Manuel Iori
2 b
, Anand Subramanian
3 c
and Marco Taccini
2 d
1
Department of Economics ”Marco Biagi”, University of Modena and Reggio Emilia, 41122, Modena, Italy
2
Department of Sciences and Methods for Engineering, University of Modena and Reggio Emilia,
42122, Reggio Emilia, Italy
3
Departmento de Sistemas de Computac¸
˜
ao, Universidade Federal da Para
´
ıba, 58055-000, Mangabeira Jo
˜
ao Pessoa, Brazil
Keywords:
Decision Support System, Intra-Logistics, Digitalization, Optimization.
Abstract:
Intra-logistics optimization plays a crucial role in ensuring efficiency and reducing non-value added activities,
especially in scenarios with a central shipping point and multiple peripheral warehouses. The goal of this study
is to create an automated and optimized Decision Support System (DSS) using an integer linear programming
(ILP) model. The DSS optimizes the order management process by determining optimal load configurations
from peripheral warehouses onto transport vehicles. The resulting transportation plan, generated through this
approach, aims to meet customer demands while minimizing overall costs. Computational tests, conducted on
a real-world case study, validated the efficiency of the proposed system.
1 INTRODUCTION
One of the critical challenges faced by industries is
intra-logistics, the logistics component that take place
within the company. Intra-logistics involves two main
functions: internal transport of materials, and infor-
mation flow management. The former includes the
movement of products between different production
plants and warehouses, while the latter refers to soft-
ware systems that tracks the movements of the phys-
ical goods. Both functions are essential to ensure lo-
gistics efficiency and must be effectively integrated.
In addition, in a large number of companies products
are handled between different warehouses, consum-
ing valuable space and operational time. Therefore,
warehouse management plays a crucial role in ensur-
ing efficiency and reducing logistics expenses.
This study focuses on order management in a busi-
ness context characterized by a central shipping site
for orders consolidation and various peripheral stor-
age sites for production and stocking. Similar ex-
amples can be found in the literature related to the
transshipment problem (Chiou, 2008), where models
a
https://orcid.org/0009-0002-1407-8258
b
https://orcid.org/0000-0003-2097-6572
c
https://orcid.org/0000-0002-9244-9969
d
https://orcid.org/0009-0004-7257-473X
are used to decide how to move stocks between ware-
houses of the same company to satisfy the demand
(Patil et al., 2021). Particular attention to this topic
is given in the online retailing context, in which indi-
vidual stock units are shipped to central warehouses
to consolidate orders (Zhang et al., 2021). Some au-
thors also incorporate the selection of transportation
modes in the model (Mishra et al., 2023). Moreover,
studies have explored the profitability of integrating
package selection into the shipping decisions by inte-
grating different unit configurations (Li et al., 2020).
Despite the primary focus on product transship-
ment in this study, the presence of a central shipping
point and distributed warehouses makes our problem
similar to the supplier selection problem (Chai et al.,
2013). In this scenario, the central depot and the dis-
tributed warehouses can be viewed as the plant and
the individual suppliers, respectively. Many stud-
ies address the issue of supplier selection and or-
der quantity allocation in multi-stage supply chain
(Pazhani et al., 2016), more precisely, for those com-
panies with many potential suppliers (Mendoza and
Ventura, 2008). Some authors also consider how to
assign shipment to different modes of transportation
(Glickman and White, 2008). However, to the best of
our knowledge no study integrates simultaneous de-
cisions about warehouses, optional feature, stock unit
configuration, and transportation modes.
612
Dotti, G., Iori, M., Subramanian, A. and Taccini, M.
An Integrated Decision Support System for Intra-Logistics Management with Peripheral Storage and Centralized Distribution.
DOI: 10.5220/0012581600003690
Paper published under CC license (CC BY-NC-ND 4.0)
In Proceedings of the 26th International Conference on Enterprise Information Systems (ICEIS 2024) - Volume 1, pages 612-619
ISBN: 978-989-758-692-7; ISSN: 2184-4992
Proceedings Copyright © 2024 by SCITEPRESS – Science and Technology Publications, Lda.

Also, in many companies, order management is
manual, involving stages that slow down the process
and consume resources in non-value added activities.
Human decisions in the process may lead to errors
or sub-optimal outcomes. Hence, a Decision Support
System (DSS) for supplier selection was proposed in
the literature (Scott et al., 2015), as well as for order
allocation problems (Erdem and G
¨
oc¸en, 2012).
This study proposes an automated and optimized
DSS to enhance order management in production
companies. Automation is achieved by fully integrat-
ing the proposed software architecture into the com-
pany’s existing procedures, thereby eliminating inef-
ficiencies associated with non-value-added activities.
Optimized decisions are achieved by means of an in-
teger linear programming (ILP) model, which selects
goods from peripheral warehouses and arranges loads
on transport vehicles, reducing inefficiencies related
to human decisions and minimizing total order man-
agement costs. The research is inspired by a real-
world case study arising in the ceramic tile production
(discussed in detail in Section 5 below), but it is very
general and can encompass a variety of applications.
The remainder of this paper is structured as fol-
lows. Section 2 presents a complete problem de-
scription. Section 3 focuses on detailing the decision
support system. Section 4 outlines the mathematical
model used for optimization. Section 5 presents the
real-world case study and Section 6 discusses the re-
sults obtained. Lastly, Section 7 summarizes the study
and presents future research directions.
2 PROBLEM DESCRIPTION
This section provides a comprehensive overview of
the problem by exploring both functions of intra-
logistics. It delves into materials flow in Section 2.1
and information flow in Section 2.2.
2.1 Material Flow
The primary challenge is efficiently fulfilling incom-
ing orders, requiring goods transportation from pe-
ripheral warehouses to a central facility for order con-
solidation and customer shipment.
Each order requests a single item along with a
specified number of boxes. Multi-line orders can be
simplified by preprocessing and segmenting them into
separate orders, each with a single order line. Or-
ders may also specify additional product features. In
this context, a feature refers to a distinguishable at-
tribute or characteristic of the products, such as their
color or shade, that the client can specify when plac-
ing an order. If the feature is specified by the client,
the preference must be respected throughout the or-
der fulfillment. On the other hand, when a client does
not explicitly request a specific feature for the order,
the company has the flexibility to select it. Neverthe-
less, in both scenarios, it is essential to ensure that all
boxes shipped for the same order have not only the
same item, but also the same chosen feature to ensure
order homogeneity.
Furthermore, each item and feature may have var-
ious pallet configurations, each containing a specific
number of boxes. It should be noted that pallets can-
not be divided into smaller units.
Items are stored in various warehouses, each with
different travel times from the central depot and
stocked with specific pallet configurations for items
with certain features. Picking each box incurs a cost
depending on the warehouse. In addition, peripheral
warehouses can be accessed via different transporta-
tion options, each with an hourly cost and weight ca-
pacity. Each box contains copies of a single item, with
its weight depending on the item’s weight. The set of
boxes loaded onto a mode of transport must adhere to
its capacity, and each mode can only serve one ware-
house per transfer order release.
The optimization process involves several deci-
sions: (i) assigning a feature to orders without specifi-
cations; (ii) determining the number of pallets of each
configuration to pick from each warehouse; (iii) allo-
cating each mode of transportation to a single ware-
house; and (iv) designing how to load the picked pal-
lets onto modes of transportation to respect the capac-
ity. In some companies, the decision-making process
is entirely manual, with an operator deciding based
on their judgment. This study aims to meet demand
while minimizing total transport and retrieval costs
and enhancing system performance.
2.2 Information Flow
The material flow outlined in Subsection 2.1 requires
a cohesive information flow to track operations and
order status. Typically, the information flow involves
manual steps carried out by various stakeholders:
• sales representatives initiate the process by email-
ing logistics operators for goods transportation;
• logistics operators aggregate requests, waiting un-
til they have enough to fill at least one transfer ca-
pacity. Once the threshold is reached, they manu-
ally organize transportation logistics, making de-
cisions based on their expertise;
• decisions are communicated via email to the com-
mercial department;
An Integrated Decision Support System for Intra-Logistics Management with Peripheral Storage and Centralized Distribution
613
• upon items reaching the centralized distribution
center, the logistics department manually notify
sales representatives;
• sales representatives input the newly arrived item
into the order management software to progress
order fulfillment.
The described process is costly, resulting in slow
and repetitive operations that consume valuable time
and resources and ultimately provide little added
value to the end customer. Some of the most prevalent
issues include:
• the fulfillment of each order requires numerous
manual steps, resulting in time inefficiencies;
• since each sales representative initiates an inde-
pendent information flow, visibility on available
items is compromised. This lack of awareness
among sales representatives may lead to the same
pallet in stock being requested for two distinct
orders, as representatives are unaware of each
other’s requests;
• as previously indicated, the picking process exclu-
sively accommodates orders for complete pallets.
Consequently, order quantities must be rounded
up. In a situation where two operators require the
same product in quantities less than a full pallet,
they may have the option to combine their orders,
approximating to one pallet instead of two. How-
ever, the lack of mutual awareness among oper-
ators about each other’s orders precludes the ef-
fective aggregation of quantities, resulting in the
costly picking of unnecessary products;
• the process is highly dependent on both total loads
and operators availability, making it inherently
non-scalable;
• as a significant amount of time elapses from the
initial request, the sales department may repeti-
tively solicit the logistics team via email, placing
an additional workload on the operators.
In response to the identified challenges, this study
aims to automate and digitalize the process, with the
goal of reducing logistic operator overhead, improv-
ing response time, and improving process scalability.
3 DIGITALIZATION
3.1 Process Overview
As outlined in Section 2.2, the digitalization of the
information flow is designed to reduce the workload
overhead for both sales representatives and logistics
operators. To address this issue, we developed a DSS,
which is extensively described in this section.
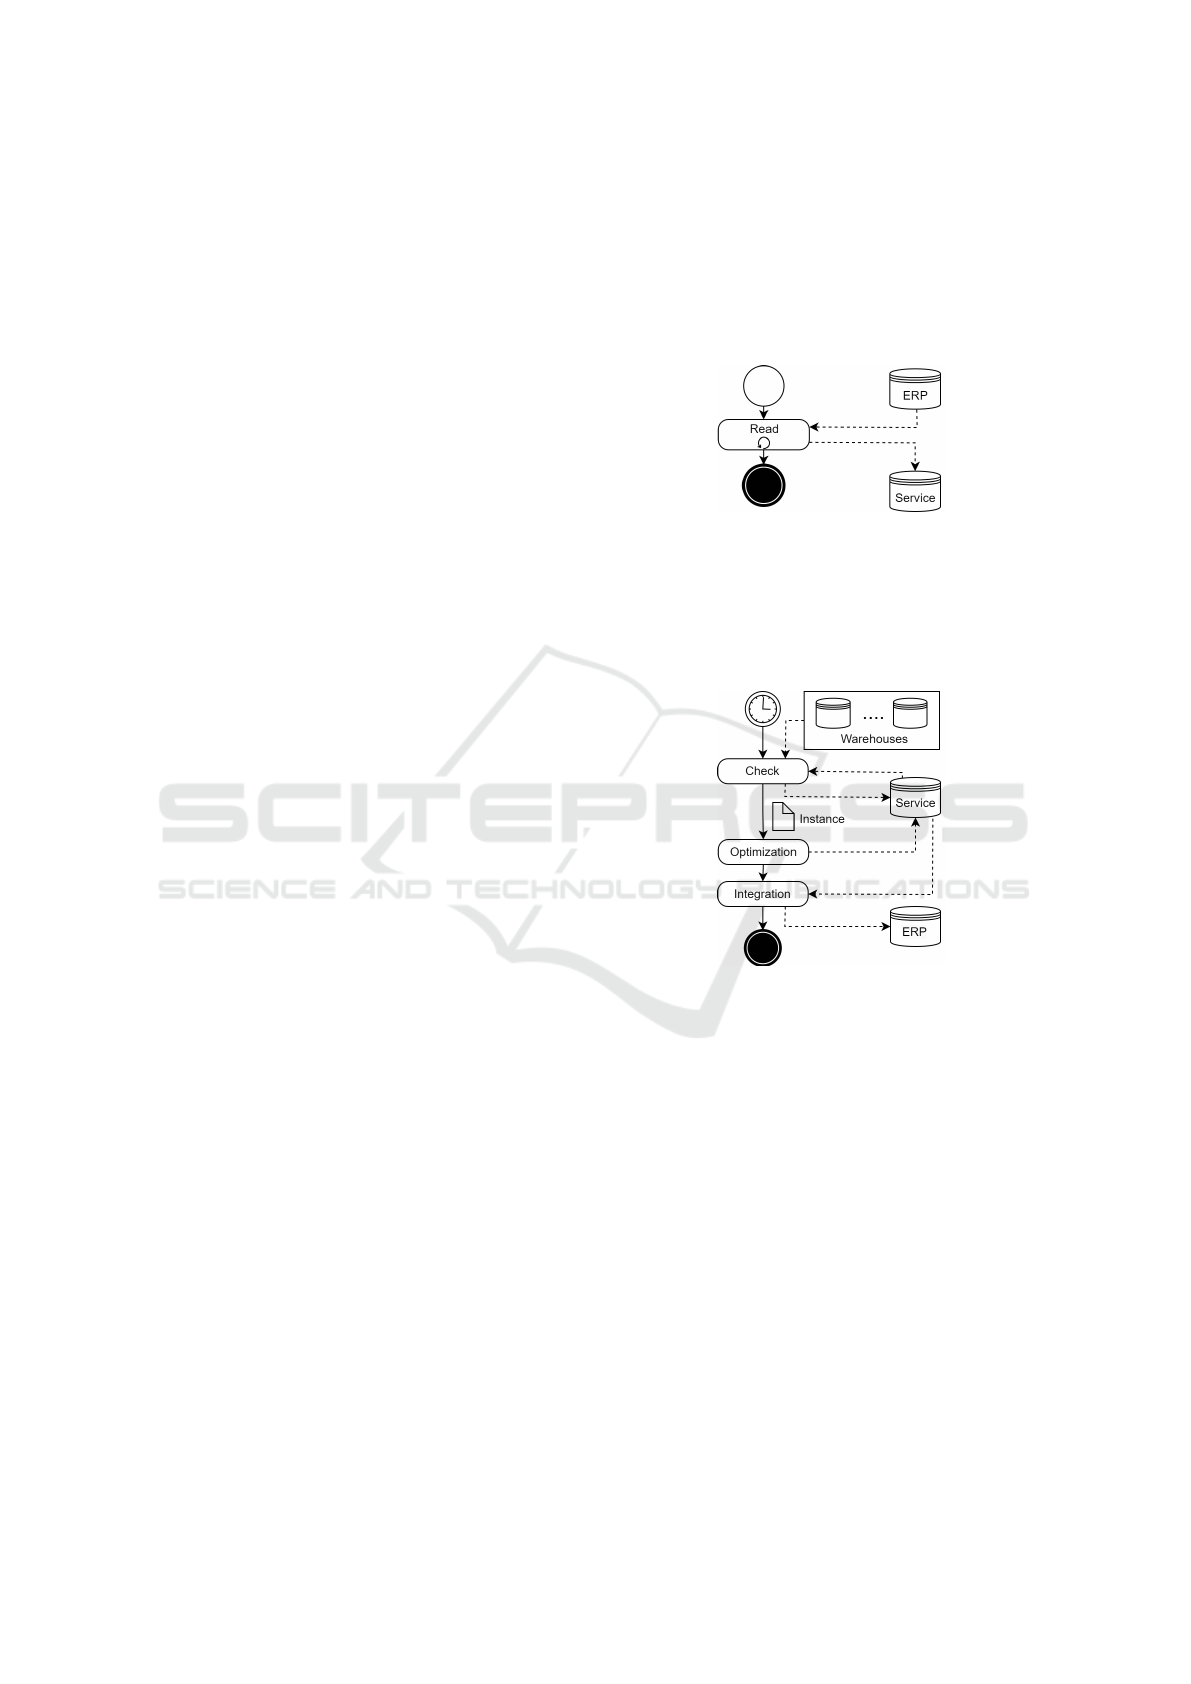
The new digitalized flow follows four main steps.
The first step, schematized in Figure 1, is executed
periodically and involves reading orders from the En-
terprise Resource Planning (ERP) system to populate
the database. Such orders contain the required infor-
Figure 1: Reading component of DSS architecture.
mation and are manually added to the ERP system by
sales representatives.
The second, third, and fourth steps, schematized
in Figure 2, are executed consecutively when the op-
timization time is reached. The second step performs
Figure 2: Control, optimization, and integration compo-
nents of DSS architecture.
a check to ensure that there is enough stock in the
peripheral warehouses to fulfill all orders. If inade-
quacies are identified, unsatisfiable orders are flagged
in the service database and excluded from subsequent
steps. Moreover, notifications are dispatched to the
respective sales representatives who added these un-
satisfiable orders. On the contrary, if the orders are
satisfiable, the software generates an instance for the
optimization step.
Subsequently, the third step involves the execu-
tion of the optimization model, described in Section
4. Upon completion of the optimization step, the
database is updated with new decisions, such as se-
lected features, chosen warehouses, pallet types, and
transportation configurations.
Finally, the fourth step is integrated into the ERP
system. Specifically, this step considers all deci-
sions made by the optimization step from the service
ICEIS 2024 - 26th International Conference on Enterprise Information Systems
614

database and, through APIs, transmits them to the
ERP system. Once this integration is completed, the
operators of the peripheral warehouses gain visibility
into the items they need to prepare for transportation.
3.2 Technologies
We have designed a user-friendly DSS to help compa-
nies manage customer orders efficiently and make op-
timization algorithms accessible to non-experts. Our
DSS runs on Docker, a software platform for devel-
oping and deploying applications in isolated contain-
ers. Docker ensures future scalability, portability and
accelerates deployment, keeping the hosting machine
unmodified.
In particular, three distinct containers have been
developed:
• Service container, that hosts the MySql service
database for storing transfer requests and moni-
toring their progression through different stages.
• Job orchestrator container, equipped with
database connection drivers, Python and Node-
RED. It includes different Python-based jobs used
to build the new digitalized flow that is scheduled
directly by Node-RED. If necessary, this flow
can also be run manually to ensure flexibility.
This flexibility proves beneficial, especially when
the daily volume of requests is low, allowing the
logistics department to defer optimization until
subsequent days to accumulate more orders and
efficiently plan material transportation.
• User interface container, to assist sales repre-
sentatives in monitoring their orders we devel-
oped an intuitive and user-friendly web interface.
The interface is built on Flask micro-web frame-
work, written in Python, which encompasses both
a back-end and a front-end.
4 OPTIMIZATION
This section provides a formal definition of the opti-
mization problem addressed in this work, as well as
an ILP-based mathematical model.
4.1 Problem Definition
The problem we face can be formalized as follows.
A set I includes different items, each characterized
by its weight w
i
. The set J represents orders, each re-
quiring one item i in quantity d
i j
. Additionally, orders
may specify a desired feature from the features set K:
if feature k is chosen for order j, the corresponding
parameter f
jk
is set to 1; otherwise, it is set to 0.
Set H represents peripheral warehouses, each de-
fined by the travel time r
h
from the central depot and
the processing cost u
h
per box. Items can be arranged
in different pallet configurations, contained in set P,
each counting q
ip
boxes. Pallet configurations cannot
be split into smaller units. Each warehouse h main-
tains a stock s
hpik
of item i with feature k in pallet
configuration p.
Finally, set T denotes the modes of transport, each
characterized by a capacity c
t
and an hourly cost m
t
.
A feasible solution for the problem must satisfy
the following constraints: (i) each feasible order re-
quest is fulfilled, providing items with uniform fea-
tures; (ii) if specified, the feature must respect cus-
tomers’ choice; (iii) pallets of items must be picked
from the warehouses according to their stock; (iv)
picked pallets must be loaded into modes of trans-
portation according to their capacity; (v) each mode
of transportation can perform only one route in a sin-
gle day, visiting a single warehouse. The objective of
the problem is to obtain a feasible solution that min-
imizes the total cost of order management, including
transportation and internal movement costs.
Note that the problem described above general-
izes the well-know bin packing problem, which is NP-
hard, when we consider a single warehouse (|H| = 1),
no optional features (|K| = 0), no pallet configurations
(|P| = 0), transports with identical capacities (c
t
is
constant, ∀t ∈ T ), unitary transportation costs (m
t
=
1
r
h
, ∀t ∈ T , ∀h ∈ H), and no retrieval costs (u
h
= 0,
∀h ∈ H). Therefore, our problem is also NP-hard.
4.2 Mathematical Formulation
Let x
jk
be a binary variable that takes the value 1 if
feature k is assigned to order j and 0 otherwise. An in-
teger variable y
hpik
identifies the number of pallets of
item i in feature k with pallet configuration p picked
from warehouse h. An integer variable z
hpit
speci-
fies the number of pallets of item i in pallet configura-
tion p loaded onto modes of transport t departing from
warehouse h. Lastly, let v
ht
be a binary variable that
is equal to 1 if mode of transportation t is assigned to
warehouse h and 0 otherwise. An ILP formulation for
the problem can be expressed as:
min
∑
h∈H
∑
t∈T
m
t
r
h
v
ht
+
∑
h∈H
∑
p∈P
∑
i∈I
∑
k∈K
u
h
q
ip
y
hpik
(1)
∑
k∈K
x
jk
= 1, j ∈ J (2)
An Integrated Decision Support System for Intra-Logistics Management with Peripheral Storage and Centralized Distribution
615

x
jk
≥ 1, j ∈ J,
k ∈ K : f
jk
= 1 (3)
∑
h∈H
∑
p∈P
q
ip
y
hpik
≥
∑
j∈J
d
i j
x
jk
, i ∈ I, k ∈ K (4)
y
hpik
≤ s
hpik
, i ∈ I, k ∈ K,
h ∈ H, p ∈ P (5)
∑
k∈K
y
hpik
=
∑
t∈T
z
hpit
,
i ∈ I,
h ∈ H, p ∈ P (6)
∑
h∈H
v
ht
≤ 1, t ∈ T (7)
∑
i∈I
∑
p∈P
q
ip
w
i
z
hpit
≤ c
t
v
ht
, t ∈ T, h ∈ H (8)
x
jk
∈ {0, 1}, j ∈ J, k ∈ K (9)
v
ht
∈ {0, 1}, h ∈ H, t ∈ T. (10)
y
hpik
≥ 0, integer, h ∈ H, p ∈ P,
i ∈ I, k ∈ K (11)
z
hpit
≥ 0, integer, h ∈ H, p ∈ P,
i ∈ I, t ∈ T. (12)
The objective function (1) minimizes the transport
and picking costs. Constrains (2) impose that only
one feature is chosen for each order. Constraints (3)
ensure that the requested feature of a line is respected,
keeping consistency with customer requests when in-
dicated. Constrains (4) state that the demand of each
order is satisfied. Constraints (5) prevent the pick-
ing of items from warehouses in amounts that exceed
their actual stock levels, maintaining the integrity of
the inventory. Constraints (6) ensure that every picked
pallet is shipped. Constraints (7) impose that each
mode of transport is associated with at most one ware-
house, and constraints (8) guarantee that the capacity
of the modes of transport is not exceeded. Constraints
(9)–(12) describe the domain of the variables.
5 CASE STUDY: THE CERAMIC
TILE INDUSTRY
The research was conducted in collaboration with an
international ceramic tile company headquartered in
Italy. Over the last decade, the global tile market
has experienced significant growth and increasing im-
portance, with global tile production reaching 16.8
billion square meters worldwide (ACIMAC Research
Department, 2023). Focusing on Italy, the coun-
try stands out as the leading global exporter by rev-
enue and ranks seventh in production volume. Italy
produced 431 million square meters of tiles, gener-
ating C7.2 billion in revenue, highlighting the sec-
tor’s significance for the country. Consequently, intra-
logistics optimization in the sector is crucial for effec-
tively controlling non-value-added costs.
A notable issue within the ceramic sector is the
Lack of Homogeneity in the Product (LHP), a phe-
nomenon arising from uncertain production processes
(Alemany et al., 2013). Consequently, despite the uti-
lization of homogeneous inputs, these processes gen-
erate heterogeneity in the outputs. This characteristic
is particularly relevant in the ceramic industry, due to
the use of clays and stochastic elements such as hu-
midity and temperature. Specifically, one of the main
tile characteristics affected by LPH is shade, which
in this context refers to the variation in color within
a particular batch or set of tiles. In industrial manu-
facturing processes, due to LHP, achieving tiles with
the same color shade can be challenging. To address
this, manufacturers group tiles based on shade unifor-
mity before packaging to ensure a consistent appear-
ance upon installation. As a result, shade can be ad-
dressed as the optional feature outlined in the model:
customers have the option to request a specific shade
if needed (i.e., to match a previous order). However,
even when the shade is not specified, every tile within
of the order must be shipped in the same shade to
guarantee aesthetic homogeneity.
The ceramic tile company studied has a structure
consisting of a central shipping center and two pe-
ripheral warehouses. The DSS, outlined in Section
3, was implemented and tested using real-world in-
stances collected from the company over a month. It
retrieves data from various databases that include in-
formation about warehouses, orders, and transporta-
tion resources. The aim is to generate an optimized
transportation plan that specifies the most efficient
load configuration from each warehouse to meet cus-
tomer demands while minimizing overall costs. This
plan is intended to be provided daily or weekly, de-
pending on the number of orders that can be aggre-
gated for efficiency.
6 COMPUTATIONAL RESULTS
The optimization model was solved using three dis-
tinct solvers: Gurobi, CBC, and HiGHS. This ap-
proach was chosen to facilitate a comprehensive per-
formance comparison, considering Gurobi’s supe-
rior performance, as well as the advantageous open-
source licenses of HiGHS and CBC. In fact, the com-
pany is inclined to purchase the solver license only if
the results exhibit significant improvement compared
to those provided by the open-source solvers.
ICEIS 2024 - 26th International Conference on Enterprise Information Systems
616

Computational experiments were conducted on an
Intel(R) Xeon(R) CPU E5-2640 v3 at 2.60 GHz with
64 GB of RAM, running Microsoft Windows 10 and
using up to 32 threads. A time limit of 600 s was set,
and a relative MIP tolerance of 10
−4
was imposed.
Table 1 presents the computational results for 23
real-world instances, solved with the three different
proposed solvers. Since the optimization interval is
determined by the company, the number of orders in
the instances can be controlled. Therefore, the in-
stances in the table are ordered based on the number
of orders, denoted as |J|.
For Gurobi we report the objective value ex-
pressed as the total cost in euros, the total comput-
ing time in seconds, and the time elapsed to find the
incumbent solution. Regarding HiGHS and CBC,
we provide the gap between the incumbent solution
and the lower bound found by the respective solver
(Gap
a
), as well as the gap between the incumbent so-
lution found by the open-source solvers and the best
primal solution found by Gurobi (Gap
b
). Specifically,
Gap
a
and Gap
b
are computed as in (13) and (14), re-
spectively, where i is the incumbent solution value,
lb is the lower bound, gs is Gurobi’s solution value
and glb is Gurobi’s lower bound. We also report the
computing time and time to achieve the incumbent so-
lution.
Gap
a
=
i − lb
i
(13)
Gap
b
=
i − gs
glb
(14)
As depicted in the table, Gurobi consistently exhib-
ited rapid convergence to optimality across all in-
stances, except for instances 16 and 23, where it
reached the predefined time limit, with a gap of 0.02%
for instance 16 and 1.3% for instance 23.
Although open-source solvers HiGHS and CBC
may not guarantee optimality within the time limit, a
comparison with Gurobi reveals that they often find
the optimal solution value. For instance 16, HiGHS
and CBC provide identical solutions, whereas HiGHS
outperforms CBC on instance 19, 20, 21, and 23.
However, in instance 18, CBC achieves the optimal
solution value while HiGHS reaches a Gap
b
of 0.08%.
Comparing HiGHS with CBC, HiGHS reaches the
incumbent solution faster for more than half of the
instances. Moreover, HiGHS finds the optimal so-
lution in 20 instances, while CBC achieves this in
17 instances, consistently with a better internal gap.
Overall, considering the minimal difference between
commercial and open-source solvers on the reported
instances, exploring the utilization of open-source
solvers could lead to potential cost savings for the
company.
Given that the process in the case study is carried
out manually by operators, the solutions generated by
the solver were subsequently compared to the manual
calculations performed by operators. Table 2 illus-
Table 1: Computational results of the real-world instances solved with Gurobi, HiGHS and CBC.
Instance Gurobi HiGHS CBC
# |J|
Obj.
Value
(C)
Total
Time
(s)
Time
Incumbent
(s)
Gap
a
(%)
Gap
b
(%)
Total
Time
(s)
Time
Incumbent
(s)
Gap
a
(%)
Gap
b
(%)
Total
Time
(s)
Time
Incumbent
(s)
1 7 295.07 0.08 0.02 0 0 0.18 0.02 0 0 26.14 2.56
2 10 301.14 0.05 0.01 0 0 0.12 0.10 0 0 1.89 0.44
3 30 332.63 0.06 0.03 0 0 0.99 0.60 0 0 85.39 1.39
4 50 352.24 0.08 0.02 0 0 0.54 0.50 0 0 59.45 1.00
5 53 666.75 1.46 1.44 0 0 8.06 3.40 45.35 0 tlim 2.67
6 70 471.40 0.69 0.04 0 0 2.14 1.80 14.53 0 tlim 1.52
7 81 763.16 1.74 0.32 0 0 7.71 3.10 8.16 0 tlim 3.42
8 95 941.47 3.03 2.80 0 0 304.36 12.00 21.78 0 tlim 14.96
9 100 770.34 1.81 0.30 0 0 5.44 0.90 5.50 0 tlim 3.94
10 103 900.52 1.94 0.33 0 0 6.52 2.80 5.22 0 tlim 121.86
11 106 3983.02 18.90 2.10 2.10 0 tlim 194.30 2.21 0.01 tlim 507.87
12 107 1234.02 2.64 0.80 0 0 465.27 5.80 11.04 0 tlim 110.00
13 108 1102.63 2.56 2.44 10.80 0 tlim 39.10 13.06 0 tlim 76.75
14 115 1204.98 2.33 0.94 2.10 0 tlim 10.40 16.23 0 tlim 14.67
15 121 905.31 1.87 0.61 0 0 149.54 8.90 11.00 0 tlim 4.26
16 164 1896.26 tlim 600.85 5.20 4.56 tlim 62.40 5.47 4.56 tlim 122.95
17 167 1557.90 14.22 11.62 6.10 0 tlim 76.10 7.90 0 tlim 108.23
18 179 2001.93 13.90 12.06 6.00 0.08 tlim 65.40 6.28 0 tlim 266.78
19 190 1985.83 40.62 40.59 4.20 0 tlim 62.7 4.56 0.02 tlim 10.08
20 201 2083.28 33.17 32.95 9.00 0 tlim 227.90 10.40 0.03 tlim 469.05
21 201 2781.75 149.83 149.66 2.70 0 tlim 455.10 2.81 0.03 tlim 188.24
22 213 1720.52 15.66 15.65 5.30 0 tlim 210.20 5.92 0 tlim 108.51
23 356 4001.71 tlim 601.92 3.80 1.58 tlim 448.00 6.25 3.81 tlim 547.32
An Integrated Decision Support System for Intra-Logistics Management with Peripheral Storage and Centralized Distribution
617

trates the comparison between the objective function
values computed by the three different solvers and
those manually calculated. The table indicates a di-
rect correlation between the total cost of the solution
and the instance size, due to the increasing number of
required transportations. Consequently, for instances
with a small number of orders (e.g., instances 1, 2,
and 3), savings are limited as all materials can fit in a
single truck, minimizing potential gains. However, as
the instance size grows, the manual decision-making
complexity also increases proportionally, expanding
the possibility of improvement. Therefore, employing
an optimization model can lead to cost reductions of
up to 40% in material flow. Furthermore, on average,
all solvers demonstrate savings of at least 24% com-
pared to the operators’ manual solutions. Notably,
even for instance 23, which was not optimally solved
by any of the solvers, a substantial 28% reduction in
costs was achieved.
Moreover, the savings are significantly enhanced
by the digitalization of the information flow, leading
to a reduction in time allocated to non-value-added
activities. To quantify this enhancement, an estima-
tion of the time required by operators for the manual
steps described in Section 2.2 was conducted within
the company. The time required for the operator is
heavily dependent on the number of orders received.
On average, the company estimated that 40-50 re-
quests are received per day, requiring a logistic op-
erator’s commitment of 4 hours. However, it is cru-
cial to note that for increasing workloads, the required
time grows more than linearly, due to the additional
human interactions involved. Additionally, digitaliza-
tion also reduces the time needed for sales represen-
tatives for email management. The estimated savings,
considering the average email response time, amount
to 30 hours per month. Overall, the digitalization of
the process allows for a minimum saving of 120 hours
monthly, which can be redirected to higher-value ac-
tivities.
7 CONCLUSIONS
DSS are gaining increasing popularity within com-
panies. This paper outlines the creation of a model-
driven DSS designed to address the challenges posed
by intra-logistics. In particular, the proposed DSS ad-
dresses a context with peripheral storage and central-
ized distribution, optional feature selection, and dif-
ferent stock unit configurations.
The DSS has been implemented to optimize both
information and material flows. Regarding informa-
tion, the process has been digitalized, eliminating
repetitive and non-value-added information streams.
This was made possible through a custom software
Table 2: Saving comparison between manual and optimization solutions.
Operator Gurobi HiGHS CBC
# |J|
Obj.
Value
(C)
Obj.
Value
(C)
Saving
(%)
Obj.
Value
(C)
Saving
(%)
Obj.
Value
(C)
Saving
(%)
1 7 296.91 295.07 0.62 295.07 0.62 295.07 0.62
2 10 305.98 301.14 1.58 301.14 1.58 301.14 1.58
3 30 361.05 332.63 7.87 332.63 7.87 332.63 7.87
4 50 582.67 352.24 39.55 352.24 39.55 352.24 39.55
5 53 707.73 666.75 5.79 666.75 5.79 666.75 5.79
6 70 716.64 471.40 34.22 471.40 34.22 471.40 34.22
7 81 1023.82 763.16 25.46 763.16 25.46 763.16 25.46
8 95 1216.47 941.47 22.61 941.47 22.61 941.47 22.61
9 100 1130.22 770.34 31.84 770.34 31.84 770.34 31.84
10 103 1289.91 900.52 30.19 900.52 30.19 900.52 30.19
11 106 4289.64 3983.02 7.15 3983.02 7.15 3983.43 7.14
12 107 1720.06 1234.02 28.26 1234.02 28.26 1234.02 28.26
13 108 1606.58 1102.63 31.37 1102.63 31.37 1102.63 31.37
14 115 1584.86 1204.98 23.97 1204.98 23.97 1204.98 23.97
15 121 1516.47 905.31 40.30 905.31 40.30 905.31 40.30
16 164 2713.36 1896.26 30.11 1982.65 26.93 1982.80 26.92
17 167 2436.15 1557.90 36.05 1557.90 36.05 1557.90 36.05
18 179 2783.97 2001.93 28.10 2003.51 28.03 2001.93 28.10
19 190 2719.10 1985.83 26.97 1985.83 26.97 1986.23 26.95
20 201 2870.88 2083.28 27.43 2083.28 27.43 2083.69 27.42
21 201 3712.04 2781.75 25.06 2782.32 25.04 2782.72 25.03
22 213 2573.06 1720.52 33.13 1720.52 33.13 1720.52 33.13
23 356 5607.28 4001.71 28.63 4012.19 28.45 4100.33 26.87
ICEIS 2024 - 26th International Conference on Enterprise Information Systems
618

architecture based on containers. Decisions regard-
ing material flow have been optimized through an ILP
model that determines the optimal choices for trans-
ferring goods from each warehouse and composing
loads on transportation vehicles.
The proposed approach has been tested on real-
world instances with different numbers of orders.
Three different solvers were employed to evaluate
the trade-off between Gurobi’s superior performance
and HiGHS and CBC’s open-source licenses. Com-
putational results were compared in terms of solu-
tions and required time. Gurobi successfully solves
nearly all instances relatively fast, while CBC and
HiGHS usually achieve optimal values for the objec-
tive function, although without demonstrating opti-
mality within the specified time limit. Overall, the
results show a significant reduction in total costs com-
pared to the company’s manually calculated solution
by operators. Furthermore, the digitalization of the
process minimizes non-value-added time for both lo-
gistics and sales operators. Therefore, the imple-
mentation of the DSS offers economic benefits to the
company by lowering expenses associated with stock
transfers and gaining valuable working hours.
Nevertheless, further enhancements are possible.
Currently, optimization occurs daily. Exploring opti-
mization frequency via sensitivity analysis could bal-
ance economic gain and service level trade-offs. Less
frequent optimization accumulates more orders, po-
tentially improving margins. Yet, order accumulation
delays shipments, reducing service levels.
Moreover, running the model for large instances
can conflict with the company’s needs due to sig-
nificant time requirements. Since material quantities
are updated only upon order consolidation and solu-
tion validation, sales operators using the system in
real-time may concurrently request the same material,
leading to resource contention. To address this issue,
heuristic algorithms could be implemented to obtain
good solutions in a limited amount of time.
ACKNOWLEDGEMENTS
Manuel Iori gratefully acknowledges financial sup-
port under the National Recovery and Resilience Plan
(NRRP), Mission 04 Component 2 Investment 1.5–
NextGenerationEU, Call 3277, Award 0001052.
REFERENCES
ACIMAC Research Department (2023). World produc-
tion and consumption of ceramic tiles. Technical Re-
port 11, Manufacturing Economics Study.
Alemany, M., Lario, F.-C., Ortiz, A., and G
´
omez, F. (2013).
Available-to-promise modeling for multi-plant manu-
facturing characterized by lack of homogeneity in the
product: An illustration of a ceramic case. Applied
Mathematical Modelling, 37(5):3380–3398.
Chai, J., Liu, J. N., and Ngai, E. W. (2013). Application of
decision-making techniques in supplier selection: A
systematic review of literature. Expert systems with
applications, 40(10):3872–3885.
Chiou, C.-C. (2008). Transshipment problems in supply
chain systems: review and extensions. Supply Chain,
pages 427–448.
Erdem, A. S. and G
¨
oc¸en, E. (2012). Development of a
decision support system for supplier evaluation and
order allocation. Expert Systems with Applications,
39(5):4927–4937.
Glickman, T. S. and White, S. C. (2008). Optimal vendor
selection in a multiproduct supply chain with truck-
load discounts. Transportation Research Part E: Lo-
gistics and Transportation Review, 44(5):684–695.
Li, Y., Chu, F., C
ˆ
ot
´
e, J.-F., Coelho, L. C., and Chu, C.
(2020). The multi-plant perishable food production
routing with packaging consideration. International
Journal of Production Economics, 221:107472.
Mendoza, A. and Ventura, J. A. (2008). An effective method
to supplier selection and order quantity allocation. In-
ternational journal of business and systems research,
2(1):1–15.
Mishra, A., Dutta, P., and Gottipalli, N. (2023). An opti-
mization model for the downstream supply chain net-
work, considering consolidated warehouses and the
selection of transportation mode. International Jour-
nal of Productivity and Performance Management.
Patil, A., Badhotiya, G. K., Nepal, B., and Soni, G.
(2021). Modeling multi-plant capacitated lot sizing
problem with interplant transfer. International Jour-
nal of Mathematical, Engineering and Management
Sciences, 6(3):961.
Pazhani, S., Ventura, J. A., and Mendoza, A. (2016). A se-
rial inventory system with supplier selection and order
quantity allocation considering transportation costs.
Applied Mathematical Modelling, 40(1):612–634.
Scott, J., Ho, W., Dey, P. K., and Talluri, S. (2015). A de-
cision support system for supplier selection and order
allocation in stochastic, multi-stakeholder and multi-
criteria environments. International Journal of Pro-
duction Economics, 166:226–237.
Zhang, Y., Lin, W.-H., Huang, M., and Hu, X. (2021).
Multi-warehouse package consolidation for split or-
ders in online retailing. European journal of opera-
tional research, 289(3):1040–1055.
An Integrated Decision Support System for Intra-Logistics Management with Peripheral Storage and Centralized Distribution
619
