
VRU-Net: Convolutional Neural Networks-Based Detection of
Vulnerable Road Users
Abdelhamid Mammeri, Abdul Jabbar Siddiqui and Yiheng Zhao
National Research Council Canada, Automotive and Surface Transportation, 2320 Lester Road, Ottawa, On, Canada
{firstname.lastname}@nrc-cnrc.gc.ca
Keywords:
Intelligent Transportation Systems, Vulnerable Road Users, Road Intersections, Automated Vehicles.
Abstract:
Research work on object detection for transportation systems have made considerable progress owing to the
effectiveness of deep convolutional neural networks. While much attention has been given to object detection
for automated vehicles (AVs), the problem of detecting them at road intersections has been underexplored.
Specifically, most research work in this area have, to some extent, ignored vulnerable road users (VRUs) such
as persons using wheelchairs, mobility scooters, or strollers. In this work, we seek to fill the gap by proposing
VRU-Net, a CNN-based model designed to detect VRUs at road intersections. VRU-Net first learns to predict
a VRUMask representing grid-cells in an input image that are highly probable of containing VRUs of interest.
Based on the predicted VRUMask, regions/cells of interest are extracted from the image/feature maps and fed
into the further layers for classification. In this way, we greatly reduce the number of regions to process when
compared to popular object detection works such as Faster RCNN and the likes, which consider anchor points
and boxes all over the image. The proposed model achieves a speedup of 4.55× and 13.2% higher mAP when
compared to the Faster RCNN. Our method also achieves 9% higher mAP, comparing to SSD (Single Shot
Multibox Detection).
1 INTRODUCTION
1.1 Background
Over the last few years, automated road surveillance
and monitoring has gained momentum in Intelligent
Transportation Systems, leveraging the advances in
computer vision and deep learning. In order to dras-
tically reduce accidents and fatalities, vision-assisted
technologies are used to detect objects on or around
the road and inform the users (e.g. vehicles) of their
presence. Many research works on object detection
and recognition have surfaced recently, particularly
for automated vehicles applications (e.g., (Mammeri
et al., 2016a), (Mammeri et al., 2016b)). However,
the majority of them have underexplored certain im-
portant yet more vulnerable persons from their de-
tection systems. Vulnerable road users (VRUs) such
as pedestrians with strollers, wheelchairs, or walking
sticks, have long been underexplored in state-of-the-
art works.
The term Vulnerable Road Users has been de-
fined and interpreted by transportation communities
worldwide in different ways. For example, the US
DOT’s National Strategy on Highway Safety has de-
fined VRUs as: “road users who are most at risk for
serious injury or fatality when involved in a motor-
vehicle-related collision. These include pedestrians of
all ages, types, and abilities, particularly older pedes-
trians and people with disabilities. VRUs also in-
clude bicyclists and motorcyclists. Older drivers may
also be considered to fit into this same user group”
(NHTSA, 2019). On the other hand, the World Health
Organisation has a less complicated definition, and it
considered VRUs to be pedestrians, cyclists, and mo-
torcyclists.
Improving road safety and preventing serious fa-
talities are of utmost importance. According to a re-
cent study published by the United States Department
of Transportation, the rate of fatalities per 100 mil-
lion vehicle miles traveled has increased significantly
in 2020, and not improved over the last ten years. It
has been also reported that no less than 38,680 road
users, including 6,236 pedestrians, died in motor ve-
hicle crashes in 2020, and around 20,160 people died
in motor vehicle crashes in the first six months of
2021. Moreover, it has been reported by Statistics
Canada (StatisticsCanada, 2019) that around 74 cy-
clists died in Canada between 2006 and 2017, where
73% of them were collided with a vehicle and 25%
Mammeri, A., Siddiqui, A. and Zhao, Y.
VRU-Net: Convolutional Neural Networks-Based Detection of Vulnerable Road Users.
DOI: 10.5220/0012587400003702
Paper published under CC license (CC BY-NC-ND 4.0)
In Proceedings of the 10th International Conference on Vehicle Technology and Intelligent Transport Systems (VEHITS 2024), pages 257-266
ISBN: 978-989-758-703-0; ISSN: 2184-495X
Proceedings Copyright © 2024 by SCITEPRESS – Science and Technology Publications, Lda.
257

with objects/cyclists.
The need to detect and categorize particular types
of VRUs such as persons using wheelchairs or mo-
bility scooters at road intersections and crosswalks
arise from the fact that they require special interac-
tions from traffic signal controllers and nearby vehi-
cles. For instance, successful detection by road side
units (RSUs) of this category of VRUs wiling to cross
roads when they are allowed (when lights- intersec-
tion become green), may grant them extra-time, and
hence cross roads safely. RSUs may also notify sur-
rounding vehicles about the presence of such VRUs
and their requirements.
The literature review revealed that the publicly
available VRU datasets and research papers mainly
consider pedestrians and bicyclists, leaving a gap for
the other VRUs (e.g., (Espinosa et al., 2018), (Ever-
ingham et al., 2015)). Indeed, pedestrian and bicyclist
detection have been studied extensively in the litera-
ture mainly in the setting of autonomous driving, and
to a lesser extent, for video surveillance applications.
The datasets proposed for autonomous driving appli-
cations are generally captured from vehicle-mounted
cameras, thereby showing a forward-looking view of
the objects from the driver’s perspective. On the other
hand, datasets taken from road intersections provide
a top-down view of the objects captured as those are
usually captured from surveillance cameras, and are
underexplored.
Most research works do not consider VRU detec-
tion/recognition from a road-side view of intersec-
tions. For instance, the authors in (A. Mukhtar and
Streeter, 2018) implement YOLO to detect special ob-
jects like wheelchair, crutch, walking frame, walking
stick, mobility scooter, car, bicycle, and, person de-
tection. They build their small size incoherent dataset
using images from ImageNet, Google Images and IN-
RIA’s pedestrian dataset, which does not really reflect
the requirements of road intersection case. Another
example is the one developed in (Vasquez A. and W.,
2017). A depth-based perception algorithm that cate-
gorizes VRUs in hospitals is developed to detect the
mobility aids they use: wheelchairs, crutches or walk-
ers. For this indoor application, the depth images are
collected using a Kinect v2 sensor. To detect VRUs,
a Fast R-CNN (Ren et al., 2017) is utilized. Another
indoor application comes from (L. Beyer and Leibe,
2017), where the authors propose a CNN-based ap-
proach using VGGnet to detect wheelchairs and walk-
ers in 2-D range data collected by a laser scanner. The
work of (Han et al., 2022) proposed an improved ver-
sion of YoloV4-Tiny to detect VRUs in blind zone
while turning.
In this research work, we seek to fill the gaps in
this area, focusing on detecting vulnerable users at
road intersections. That is, seven VRU types of in-
terest are considered: MobilityScooters, Wheelchairs,
Strollers, MobilityAids, Motorbikes, Bicycles, and
Dogs. We designed a novel two-stage Convolutional
Neural Network (CNN)-based VRUs detection and
recognition framework called VRU-Net. The first
stage, called VRUMaskNet, is a CNN-based model
that predicts if pre-demarcated overlay cells on input
images contain objects of interest. In other words,
the network predicts the grid-cells that most likely
contain an object of interest. These shortlisted grid-
cells regions are then fed into the second stage CNN,
known as DetectorNet, which is designed to recog-
nize the classes of the objects contained in them. De-
tectorNet is a CNN-based model that takes selected
cell regions from VRUMaskNet’s output to detect ob-
jects of interest. The VRUMaskNet and DetectorNet
are integrated and fine-tuned to function as a complete
vulnerable road user detection network.
The remainder of this paper is organised as fol-
lows. In Section 2, we provide a description of the
proposed VRUNet and its main sub-networks VRU-
MaskNet and DetectorNet. In Section 3 we describe
the experimental setup followed by Section 4 where
we present the results and discussions on the perfor-
mance of the proposed method in detecting vulnerable
road users such as wheelchairs, strollers, motorbikes,
etc. The paper finally concludes and presents some
points of future work in Section 5.
2 PROPOSED METHOD: VRU-Net
The proposed VRU-Net comprises of three main
modules: VRUMaskNet, regions of interest (ROI)
Extraction, and DetectorNet, as depicted in Figure 1.
The VRUMaskNet takes an input image and outputs
a VRU mask (or Grid Mask) of size nG × nG that
indicates cells over the image that most likely con-
tain objects of interest. The ROI Extraction module
then extracts ROIs from the input image, based on the
VRU mask. The extracted ROIs are then fed into the
DetectorNet module which then classifies the objects
contained in the ROIs corresponding to the selected
cells.
2.1 VRUMaskNet
Given an input image of size H ×W , the goal of VRU-
MaskNet is to produce a nG × nG VRU mask which
would have 1’s in cells corresponding to the input im-
age regions that most likely contain objects of interest
and 0’s otherwise. The design of VRUMaskNet as de-
VEHITS 2024 - 10th International Conference on Vehicle Technology and Intelligent Transport Systems
258
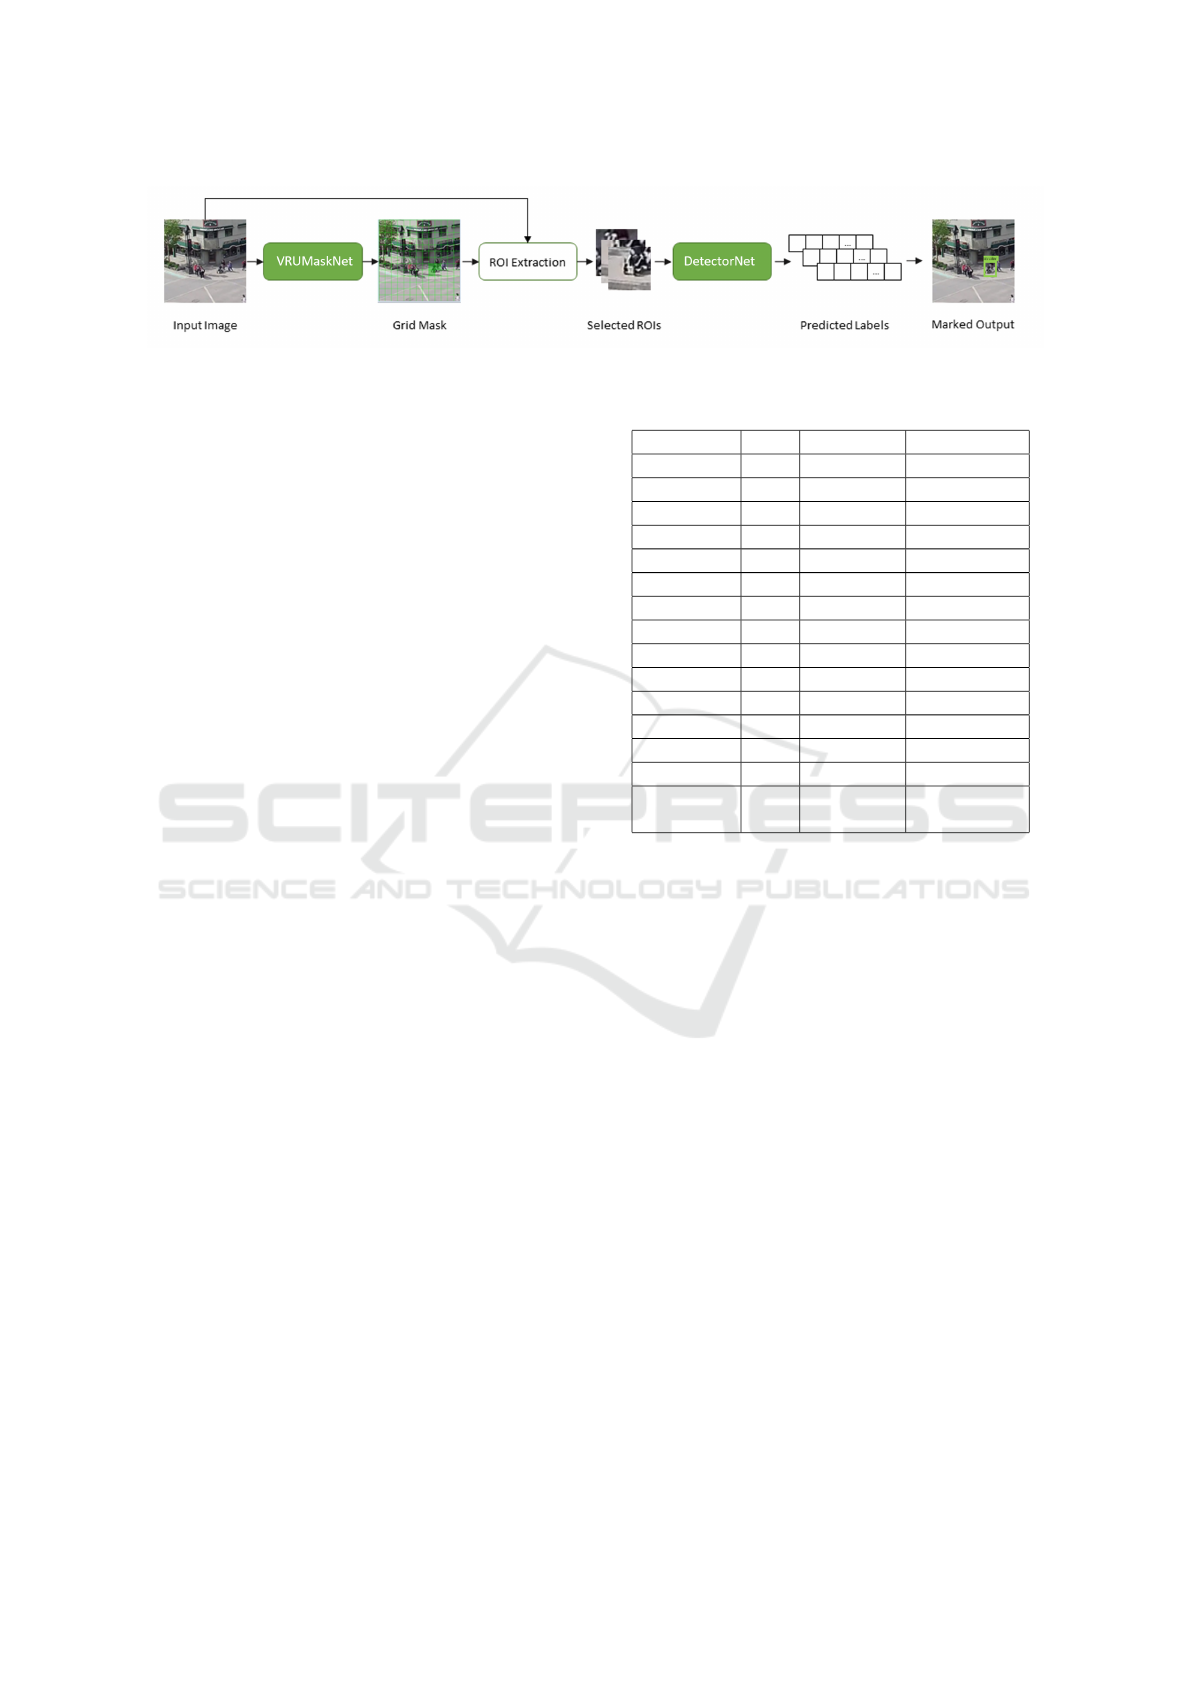
Figure 1: Architectural Overview of VRU-Net.
picted in Table 1 is based on CNNs and ResBlocks in
the feature extraction layers.
In order to train the VRUMaskNet, we build the
target VRU masks as follows. Let G
T
represent the
target/ground-truth VRU mask initialized with zeros.
For a given size parameter nG = 13 for example, a
sample image I is virtually divided into nG ×nG cells
C = [C
1,1
,...,C
1,nG
,...,C
nG,nG
]. For each ground truth
bounding box B for the given image, we find the cells
C
i, j
that satisfy the following criteria: (i) the center
of the bounding box lies in the C
i, j
, or (ii) the C
i, j
encloses at least 25% of the bounding box. The g
i, j
in G
T
is set to 1 for every C
i, j
satisfying these two
criteria.
G
T
= [g
T
(i, j)] =
g
T
(1,1) ... g
T
(1,nG)
... ... ...
g
T
(nG,1) ... g
T
(nG,nG)
(1)
Given an input image I and its correspond-
ing ground-truth VRU mask G
T
, the forward pass
through the VRUMaskNet produces a nG×nG output
from the final layer G
P
, after applying sigmoid. The
final layer’s output G
P
is then used to build the binary
predicted VRU mask G
P
b
= [g
P
b
(i, j)] based on a con-
fidence threshold Φ
GM
as shown in this equation:
g
P
b
(i, j) =
1: g
P
b
(i, j) ≥ Φ
GM
0: otherwise
(2)
The value of Φ
GM
is a parameter that could be var-
ied to obtain different levels of precision and recalls,
depending on the application’s requirements. In this
work, we set Φ
GM
= 0.1 (will be further discussed in
Section 4.1).
In general, for VRUMaskNet, one would like to
have a high recall even if it is at a low precision. In
other words, having high True Positive Rate is more
important than lowering the False Positive Rate. This
is to avoid missing any potential object of interest.
The DetectorNet could be trained to take care of elim-
inating these false positives regions.
The loss function for VRUMaskNet is designed
based on the comparison of G
T
and G
P
. In particular,
we employ the Binary Cross Entropy loss function as
shown below, to train the network through Adam opti-
mization. In this manner, the VRUMaskNet is trained
Table 1: Architecture of VRUMaskNet.
Layer Filt. Size, Strd Output
Conv1 16 3x3, 1 16x416x416
MaxPool - 2x2, 2 16x208x208
Conv2 32 3x3, 1 32x208x208
MaxPool - 2x2, 2 32x104x104
Conv3 64 3x3, 1 64x104x104
ResBlock1 64 -, 1 64x104x104
Conv4 64 3x3, 2 64x52x52
Conv5 256 3x3, 1 256x52x52
ResBlock2 256 -, 1 256x52x52
Conv6 256 3x3, 2 256x26x26
MaxPool - 2x2, 2 256x13x13
Conv7 64 1x1, 1 64x13x13
Conv8 16 1x1, 1 16x13x13
Conv9 1 1x1, 1 1x13x13
VRUMask
(Sigmoid)
- - 1x13x13
to set the VRU mask to 1 for cells containing objects
of interest, and 0 otherwise. The loss function has two
components to consider: the objects of interest, and
the background, unknown/non-interesting objects.
The loss function is designed to penalize the net-
work for not correctly predicting the cells containing
objects of interest (true positives) as well as for incor-
rectly predicting cells with background or unknown
class objects as cells of interest (false positives). This
is to ensure we achieve higher true positives count as
well as to control false positives. The overall loss is
a weighted sum as shown below, where the weights α
and β could be set based on the application require-
ments. In this work, we use α = β = 1.0. In this
way, the network is forced to learn to output close to 0
for the cells corresponding to background or unknown
classes.
L = αL
ob j
+ βL
bg
(3)
L
ob j
= BCEWithLogitsLoss(G
P
,G
T
) (4)
L
bg
= BCEWithLogitsLoss(1 − G
P
,1 − G
T
) (5)
BCEWithLogitsLoss refers to binary cross entropy
with logit function. Logit function helps to compress
the prediction values into [0, 1]. In our experiments,
we use sigmoid as logit functions.
VRU-Net: Convolutional Neural Networks-Based Detection of Vulnerable Road Users
259
2.2 ROI Extraction
The ROI Extraction modules takes the G
T
or G
P
b
as
input in training or testing, respectively. Based on the
g
i, j
’s marked as 1’s, the corresponding region around
the cell c
i, j
is extracted from the input image. Let
the coordinates (center x, center y) and dimensions
(width and height) of c
i, j
be c
i, j
x
,c
i, j
y
,c
i, j
w
,c
i, j
h
. Then,
the coordinates (top-left-x, top-left-y, bottom-right-x,
bottom-right-y of extracted ROI
i, j
, with respect to the
input image, are determined as follows:
ROI
i, j
tlx
= max(ceil(c
i, j
x
− γ · c
i, j
w
/2),0) (6)
ROI
i, j
tly
= max(ceil(c
i, j
y
− γ · c
i, j
h
/2),0) (7)
ROI
i, j
brx
= min( f loor(c
i, j
x
+ γ · c
i, j
w
/2),I
w
− 1) (8)
ROI
i, j
bry
= min( f loor(c
i, j
y
+ γ · c
i, j
h
/2),I
h
− 1) (9)
In case the VRU mask selects cells along the im-
age boundaries, the extracted regions are padded with
zeros to maintain a consistent size of the ROI crops.
2.3 DetectorNet
The DetectorNet takes the ROIs extracted from the in-
put image based on the predicted VRU mask of VRU-
MaskNet, and detects the objects contained in those
selected ROIs. We designed the DetectorNet based
on ideas from Tiny-Darknet-53 (Redmon and Farhadi,
2018) which comprises of several convolutional lay-
ers and ResBlocks (He et al., 2016). The output of
DetectorNet for each ROI is a vector of predictions of
size N
cls
. The DetectorNet is trained independently
from the VRUMaskNet. The targets for DetectorNet
are (N
cls
)-dimensional binary (0 or 1) vectors whose
indices correspond to class numbers. The 1’s in the
vector indicate the presence of an object of the corre-
sponding class in the given ROI. The first index, i.e.
class-0 corresponds to the background or ‘unknown’
class. Since the focus of this work is the detection
of vulnerable road users (e.g. strollers, wheelchairs,
etc.), we regard objects belonging to classes other
than those of interest as ‘unknown’ class.
The architecture of DetectorNet is depicted in Ta-
ble 2. It comprises of a series of convolutional lay-
ers and MaxPool layers. The conv3,conv4, and conv5
layers are coupled with ResBlocks such that the out-
put of layer 4 is added with the output of layer 4.2 to
be fed into layer 5, and a similar operation is done for
outputs of layer 5 and layer 8, as shown in the Table 2.
In this work, since we consider one fixed-size
grid instead of multi-scale grids, there may be cases
where an object may partially occur in c
i, j
and par-
tially in c
i+1, j
(an adjacent cell) for example. To ac-
count for such cases, and to design our system to be
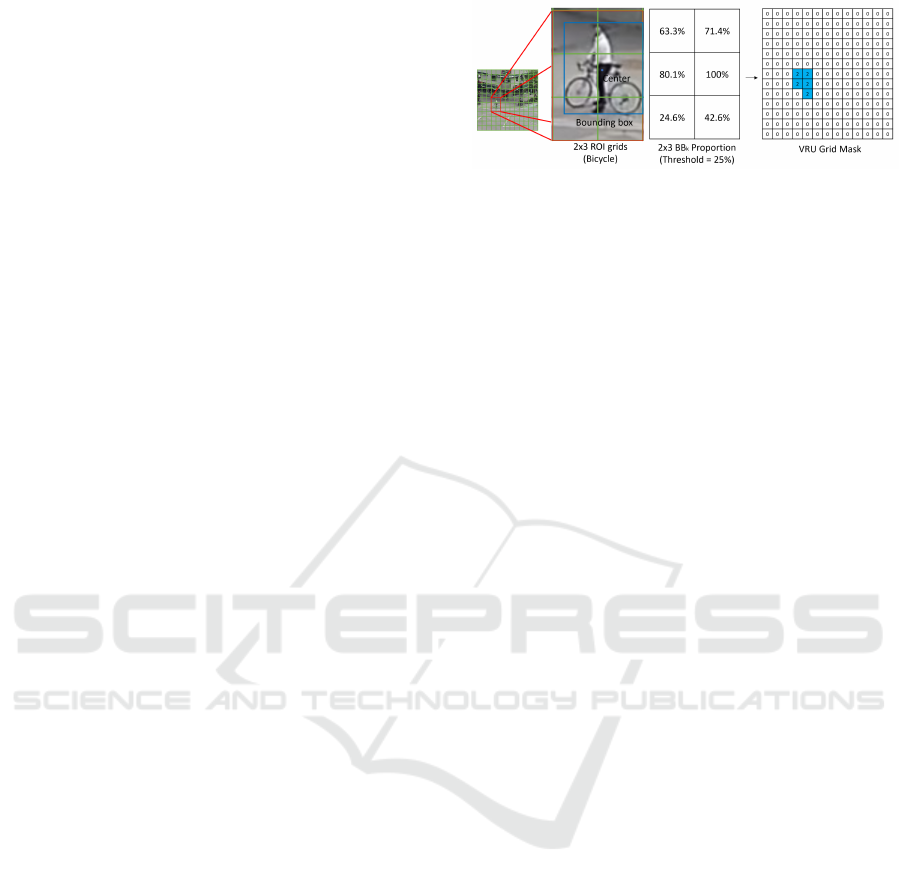
Figure 2: Example of constructing Ground Truths.
able to detect objects based on partial views, we build
the ground truth targets as follows. Given a training
image I, its set of ROIs R = [R
i, j
] based on corre-
sponding grid cells C = [c
i, j
], set of bounding boxes
BB = [BB
k
] where k = 1,...,N
BB
I
, if a BB
k
’s center
lies in c
i, j
or if at least Θ = 25% of BB
k
occurs in c
i, j
,
then consider class of BB
k
as present in the given ROI
and mark at the index of target vector corresponding
to the class of BB
k
a value of 1 (see Fig. 2).
The loss function for DetectorNet is based on
BCEWithLogitLoss between the target (O
T
) and pre-
diction output (O
P
), as shown below. The prediction
output of DetectorNet (O
P
), derived from the fully
connected layer at the end, is an (N
cls
)-dimensional
vector of scores which is transformed to a binary pre-
diction vector based on threshold Φ
DN
, as per Equa-
tion 10. The ground truth target for each ROI is
an (N
cls
)-dimensional vector as well, with 1’s at in-
dices corresponding to the enclosed object class and
0’s otherwise. In the experiments section, we present
an analysis of the effect of the parameter Φ
DN
on the
overall integrated system’s performance.
O
P
(i) =
1: O
P
(i) ≥ Φ
DN
0: otherwise
(10)
L
DetectorNet
= BCELogitLoss(O
P
,O
T
) (11)
In this way, the network is trained to detect the ob-
ject classes of interest present in a given ROI (even if
they occur partially) by predicting values closer to 1 in
respective indices. In addition, to eliminate the poten-
tial false positives from VRUMaskNet, it is trained to
predict values closer to 1 in the first index (while pre-
dicting values closer to 0 in other indices) for ROIs
not containing objects of interest. (First index in the
target and prediction vector corresponds to Class-0 re-
ferring to background/unknown class).
2.4 Dataset
A number of publicly available datasets for object
detection have been collected in the context of au-
tonomous driving. These datasets can be grouped into
two categories: (i) dashboard camera-based, and (ii)
VEHITS 2024 - 10th International Conference on Vehicle Technology and Intelligent Transport Systems
260
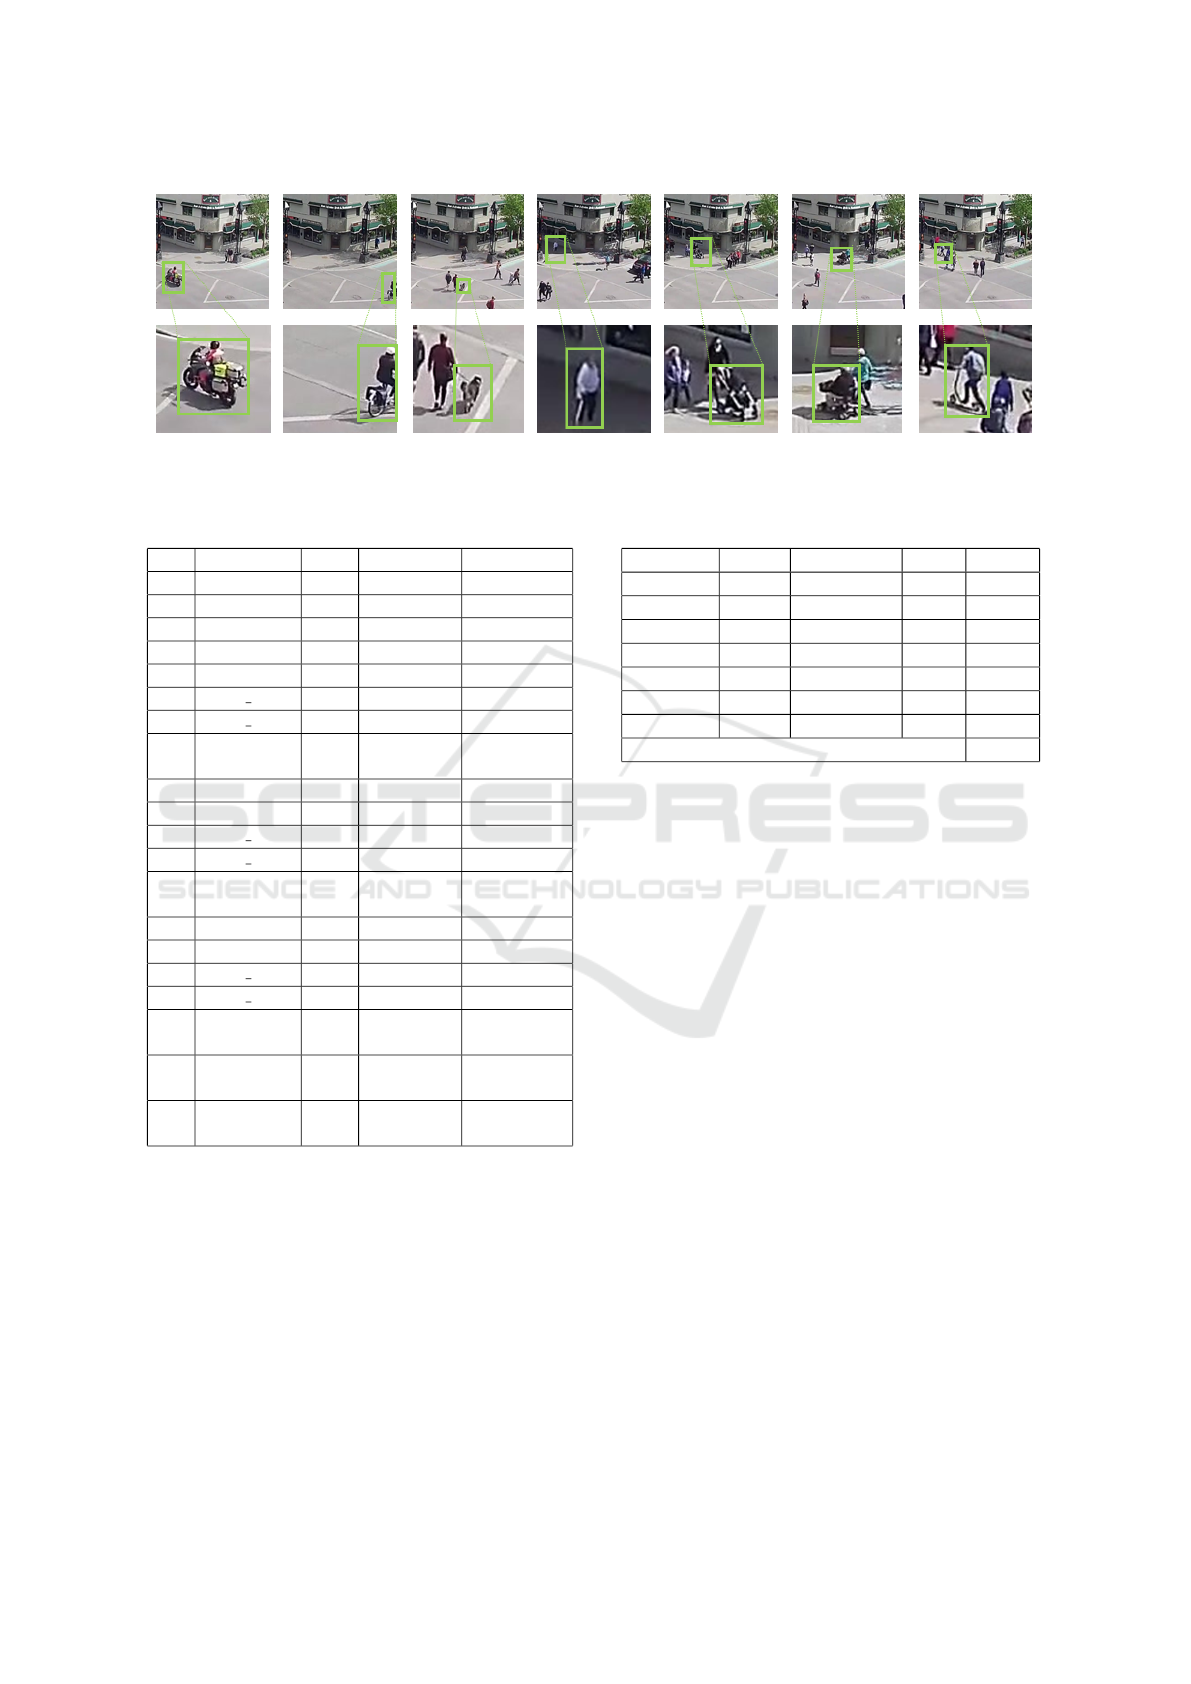
Figure 3: Examples from the Road Intersection Vulnerable Users Dataset for the objects of interest: [Left-Right] Motorbike,
Bicycle, Dog, MobilityAid (MobiAid), Stroller, Wheelchair, MobilityScooter.
Table 2: Architecture of DetectorNet.
# Layer Filt. Size, Strd Output
0 Conv1 16 3x3, 1 16x48x48
1 MaxPool - 2x2, 2 16x24x24
2 Conv2 32 3x3, 1 32x24x24
3 MaxPool - 2x2, 2 32x12x12
4 Conv3 128 3x3, 1 128x12x12
4.1 Blk3 conv1 64 1x1, 1 64x12x12
4.2 Blk3 conv2 128 3x3, 1 128x12x12
- (4) +
(4.2)
- - 128x12x12
5 MaxPool3 128 2x2, 2 128x6x6
6 Conv4 256 3x3, 1 256x6x6
6.1 Blk4 conv1 128 1x1, 1 128x6x6
6.2 Blk4 conv2 256 3x3, 1 256x6x6
- (6) +
(6.2)
- - 256x6x6
7 MaxPool4 - 2x2, 2 256x3x3
8 Conv5 512 3x3, 1 512x3x3
8.1 Blk5 conv1 256 1x1, 1 256x3x3
8.2 Blk5 conv2 512 3x3, 1 512x3x3
- (8) +
(8.2)
- - 512x3x3
9 Adaptive-
Avg-Pool
- 1x1 512x1x1
10 Fully-
Connected
- - N
cls
x 1
Roadside fixed camera-based. The datasets belonging
to the first category are captured from in-vehicle cam-
eras whereas datasets of the latter category provide
a top-down view of the road, and it is the focus of
this paper. Most of these datasets do not contain sam-
ples representing VRUs such as strollers, MobilityAid
(MobiAid), or Wheelchair. In this paper, we focus
on the following classes of vulnerable road users, re-
ferred to as objects of interest (OIs) in this paper:
(1) Motorbike, (2) Bicycle, (3) Dog, (4) MobilityAid,
(5) Stroller, (6) Wheelchair, and (7) MobilityScooter
(MobSco). The dataset contains a set of frames ex-
Table 3: VRU Dataset Composition.
OI Class Train Validation Test Total
Motrbke 78 17 29 124
Bicycle 3673 1194 1228 6095
Dog 2364 725 748 3837
MobiAid 1577 489 536 2602
Stroller 3885 1422 1313 6620
Whelchr 969 317 322 1608
MobSco 56 20 17 93
Total # OI samples 20979
tracted at a rate of 1fps. The Objects of interest (OI)
in the selected frames were annotated using the Labe-
lImg (Tzutalin, 2015) tool. Since the OIs considered
in this paper occur less frequently than the rest of ob-
jects in the recorded videos, we adopted data augmen-
tation techniques to increase the number of samples
in order to train and evaluate our algorithm. That is,
we use the following augmentation transformations to
obtain more than 30 different frames for each image.
Each frame is horizontally flipped; and on the origi-
nal image and its flipped version, five different trans-
formations were applied (scaling, rotation operations,
random HSV modifications). Note that for scaling
and rotation transformations, we ignore OIs bounding
boxes of an area of less than 25%. With scaling and
rotation, the image resolution is not altered, and any
area left empty after transformation is filled black. A
total of 30 augmented images for each original image
were obtained. After augmentation, we succeed to
bring together a total of 17,422 frames. We split the
dataset into training, validation and testing sets fol-
lowing a ratio of 60%/20%/20% respectively. Table 3
shows the number of samples of each OI class in the
respective splits. The total number of OI samples in
the dataset is 20,979.
VRU-Net: Convolutional Neural Networks-Based Detection of Vulnerable Road Users
261

3 EXPERIMENTAL SETUP
The two main modules in the proposed VRU-Net are
VRUMaskNet and DetectorNet. Thus, the two net-
works are trained separately, and evaluated using the
performance metrics Average Precision and Process-
ing Time.
3.1 Performance Metrics
3.1.1 Average Precision
In general, precision, with respect to a certain class,
is defined as the ratio of the number of true posi-
tives to the total number of predictions for that class.
The average precision (AP) is calculated as per the
COCO method (Lin et al., 2014). In order to quan-
tify the overall performance of a method, a metric
known as mean average precision (mAP) is calculated
by averaging the classwise AP scores (for the given N
classes). So, mAP =
∑
N
c=1
AP
c
/N.
3.1.2 Processing Time
Besides evaluating the performance based on mAP,
we measure the execution time, per image, in testing
phase for a given model. The execution time is an
important factor to consider as different applications
may have different latency requirements.
3.2 Training VRUMaskNet
The VRUMaskNet (described in Sec 2.1) is trained
using the training dataset to predict the VRU mask
indicating presence of objects of interest in a given
input image. In this work, we train VRUMaskNet
for 100 epochs employing a multistep learning rate
scheduler with the following settings: initial learning
rate of 0.01, Adam optimizer, γ = 0.1, and milestones
set at epochs 30, 60, and 90. In this way, the learning
rate used in epochs 0 − 29 is 0.01, in epochs 30 − 59
is 0.001, in epochs 60 − 89 is 0.001, and in epochs
90 − 99 is 0.0001.
As mentioned in Sec 2.1, for VRUMaskNet, our
goal is to maximize the Recall, even if it be at a
low precision, to avoid missing any potential OI. The
VRUMaskNet’s output G
P
is binarized using a con-
fidence threshold Φ
GM
. We evaluate VRUMaskNet’s
performance with varying Φ
GM
in Section 4.
3.3 Training DetectorNet
The DetectorNet (described in Sec 2.3) is trained us-
ing ROIs extracted from the training dataset such that
given a grid-based ROI, extracted via the procedure
described in Sec 2.2, it predicts the objects of inter-
est present in the corresponding grid cell of the input
image.
In this work, the DetectorNet is trained with a
batch size of 512 for 50 epochs. The learning rate
is changed at epoch 16 and 41. In addition, when
the learning rate is changed at these epochs, we se-
lect the best model weights (based on accuracy ob-
tained on evaluation dataset) from the previous round
of epochs instead of selecting the model from the pre-
vious epoch, to initiate the current round of learning
epochs.
The output of DetectorNet for each ROI is O
P
which is binarized based on a confidence threshold
Φ
DN
, as described in Sec 2.3. In the training phase,
Φ
DN
was set to 0.5 to measure the performance on the
evaluation dataset in each epoch. In evaluating the
integrated VRU-Net, we conduct experiments with
different values of Φ
DN
to obtain the best choice.
Once the DetectorNet is trained, to integrate it into
VRU-Net, we select the DetectorNet weights from
the epoch which yielded the best mean accuracies and
lowest errors on evaluation dataset.
3.4 Configuring VRU-Net
The VRU-Net’s pipeline works as follows. Given
an input image, the VRUMaskNet predicts the VRU
mask indicating the potential cells that most likely
contain the objects of interest. The ROIs are ex-
tracted based on the predicted VRU mask (as ex-
plained in Section 2.2) and fed into the DetectorNet
as a batch to leverage the benefits of GPU batch pro-
cessing. The DetectorNet predicts the object classes
occurring in each ROI, or if a ROI should be con-
sidered as unknown/background class. Based on the
ROIs which are predicted to contain objects of inter-
est, ROI boundaries are drawn over the input image to
mark the detections. In the performance evaluation,
we test VRU-Net with varying Φ
GM
and Φ
DN
thresh-
olds to determine the optimal combination yielding
the best results.
It is worth mentioning here that in this work, we
take a different approach marking the detected objects
of interest. Instead of yielding tight fitting bounding
boxes around each object of interest, VRU-Net out-
puts the ROI boundaries which can be considered as
relaxed bounding boxes. The relaxed bounding boxes
may enclose multiple objects of interest that are close
together such that they fall within a grid-cell.
We believe that, for our application which focuses
on detection of VRUs at intersections based on in-
frastructure mounted vision systems, such a relaxed
VEHITS 2024 - 10th International Conference on Vehicle Technology and Intelligent Transport Systems
262
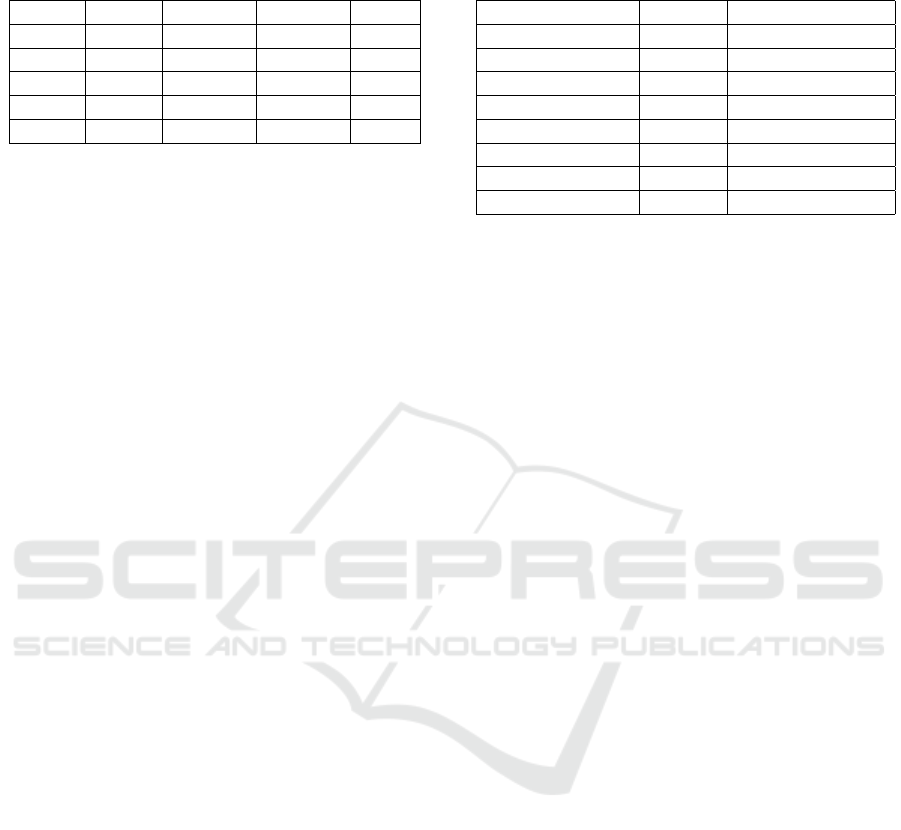
Table 4: Performance of VRUMaskNet with varying the
threshold Φ
GM
.
Thrsh Recall Avg TPs Avg FPs Ratio
0.5 0.902 8.97 18.93 0.153
0.4 0.943 9.16 26.25 0.209
0.3 0.980 9.32 41.18 0.298
0.2 0.994 9.39 58.9 0.41
0.1 0.998 9.41 79.9 0.529
bounding box approach is sufficient. For example, in
informing the AVs or traffic lights in the area of the
presence and approximate location of the vulnerable
road users. For applications that do require tight fit-
ting bounding boxes, such as for activity recognition,
or object tracking, a further step could be added to
split the relaxed bounding box into tight fitting bound-
ing boxes. We shall investigate this in a future work.
4 RESULTS AND DISCUSSIONS
4.1 Performance Evaluation of
VRUMaskNet
The goal of the VRUMaskNet is to predict the nG ×
nG grid cells that most likely contain objects of in-
terest. We evaluate the performance of VRUMaskNet
towards this goal for different values of the parame-
ter Φ
GM
. Table 4 presents the recall rates, average
number of true positives per image, average number
of false positives per image, and the mean ratio of pre-
dicted OI-cells to total number of cells (i.e., 169, for
a grid of 13 × 13).
The mean ratio, in other words, represents the per-
centage of selected grid cells out of the total num-
ber of grid cells. Lowering the confidence threshold
even further may lead to a higher ratio of selected
cells, thereby causing the DetectorNet to work on
many false positive ROIs wasting computational re-
sources and time. Based on these, we determined the
best choice of Φ
GM
= 0.1, which yielded a recall of
0.9986 at a satisfactorily low percentage of selected
cells (52.91%). In this way, around half the grid cells
will be ignored by the DetectorNet, thereby saving
computations and processing time. As discussed in
Section 2.1, the requirement of VRUMaskNet is to
have a high recall rate, even if it be at a low precision.
4.2 Performance Evaluation of
DetectorNet
The goal of the DetectorNet is to take the ROIs ex-
tracted around the selected grid cells from VRU-
Table 5: DetectorNet: Selecting best Φ
DN
i
threshold for
each class.
Class Best F1 Corresp. Thrshd
0 (BG/Unknown) 0.911 0.815
1 (Motorbike) 0.914 0.679
2 (Bicycle) 0.986 0.045
3 (Dog) 0.971 0.904
4 (MobiAid) 0.985 0.509
5 (Stroller) 0.986 0.317
6 (Wheelchair) 0.966 0.201
7 (MobSco) 0.939 0.153
MaskNet and recognize the objects occurring in these
cells. The DetectorNet predicts the labels of objects
present in each ROI, where the label 0 corresponds
to background or an unknown class which essentially
denotes any background or objects not of interest.
The metric used to evaluate DetectorNet’s perfor-
mance are based on precision, recall and precision-
recall curves. In the context of the DetectorNet, for
each class, precision is the number of correctly iden-
tified instances (True Positives) to the total number
of predictions to the class (True Positives and False
Positives), whereas Recall is the number of correctly
identified instances to the number of ground truth in-
stances of the given class. The precision and recall
scores are calculated per class as well as over all
classes.
Figure 4 shows the precision-recall curves for
the 8 classes of the dataset (include class-0, the un-
known/background class) over varying Φ
DN
thresh-
olds. The DetectorNet achieved high precision scores
for all classes, though at lower recall scores. At higher
recall scores, we observe that the precision starts to
fall down (indicating high false positives at the cor-
responding threshold). Selecting an appropriate Φ
DN
involves balancing a trade-off between precision and
recall, which users could adapt based on their require-
ments.
There are two ways of setting Φ
DN
for Detector-
Net: (i) a fixed Φ
DN
for all classes, or (ii) a differ-
ent Φ
DN
for each class. To calculate the former, one
could select the threshold yielding the best average f1
score (averaged across all classes). As for the latter,
Φ
DN
i
for class i could be set as the threshold yield-
ing the best f1 score for class i, obtained by analysing
Figure 5 which shows the F1 scores for each class
with varying thresholds Φ
DN
. In the final indepen-
dent DetectorNet, we adopt the latter approach, based
on which, the thresholds determined for the 8 classes
are provided in Table 5. However, after integrating
with the VRUMaskNet and subsequent fine-tuning,
we found that using a fixed Φ
DN
= 0.1 for all classes
gave best results.
VRU-Net: Convolutional Neural Networks-Based Detection of Vulnerable Road Users
263
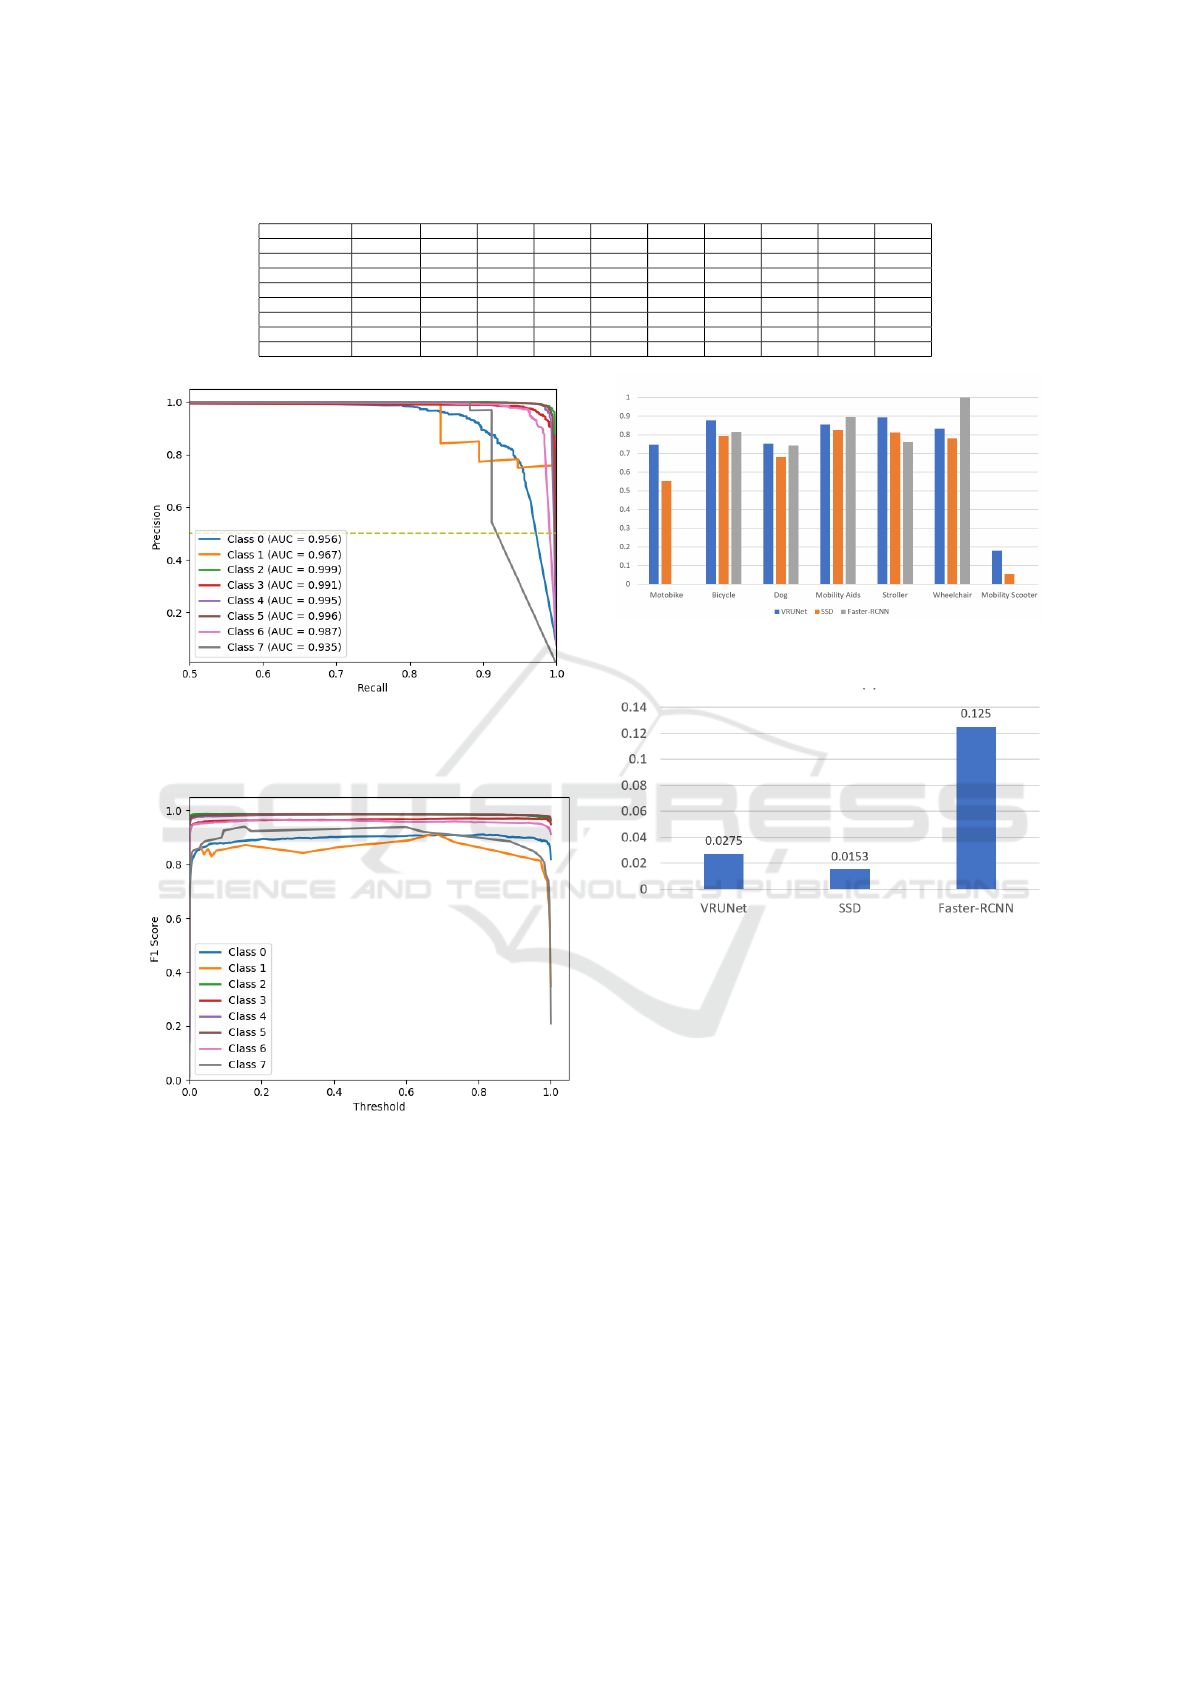
Table 6: Performance of Integrated VRUNet.
Class \Epoch 0 5 10 15 20 25 30 35 40 45
Motorbike 0.7140 0.2550 0.7930 0.7470 0.7090 0.5060 0.6680 0.3250 0.5650 0.6400
Bicycle 0.8010 0.7960 0.8990 0.8770 0.8570 0.7670 0.8570 0.7800 0.8520 0.8270
Dog 0.7300 0.5080 0.7140 0.7530 0.6980 0.7250 0.7350 0.7080 0.7160 0.6700
MobiAid 0.8670 0.8830 0.8770 0.8550 0.8210 0.8120 0.8320 0.8080 0.8120 0.7740
Stroller 0.8870 0.8680 0.8910 0.8950 0.8620 0.8770 0.8710 0.8430 0.8330 0.8670
Wheelchair 0.6320 0.7620 0.6350 0.8320 0.7980 0.7910 0.8180 0.6320 0.7680 0.7840
MobSco 0.2700 0.1260 0.0880 0.1790 0.1990 0.2150 0.2730 0.1180 0.1770 0.2940
mAP 0.737625 0.6496 0.7370 0.7671 0.7426 0.7115 0.7566 0.6515 0.7150 0.7316
Figure 4: Evaluation of DetectorNet: Precision-Recall
Curves along with the Area Under Curve (AUC) values for
each class.
Figure 5: Evaluation of DetectorNet: F1-Score vs Φ
DN
thresholds for each class.
4.3 Performance Evaluation of VRUNet
In this section, we evaluate the overall system by inte-
grating the VRUMaskNet and DetectorNet into what
we call VRUNet. The two sub networks were individ-
ually trained and evaluated to find the best thresholds
as described in the previous sections. We then fine-
tuned the integrated VRUNet by fixing the weights
of VRUMaskNet and fine-tuning only the weights of
DetectorNet. The values of Φ
GM
= 0.1 and Φ
DN
=
Figure 6: Average Precision Comparison between VRUNet,
SSD, and Faster-RCNN.
Figure 7: Overall Time Cost of VRUNet, SSD, and Faster-
RCNN.
0.1 achieved the best results on the validation dataset.
The integrated VRUNet’s performance in terms of
mAP over different number of fine-tuning epochs is
shown in Table 6. The columns indicate the classwise
average precision (AP) scores and the mean AP score
for fine-tuning epochs 0, 5,10, 15,20, 25,30, 35,40,
and 45. Considering the mAP metric, we find that
the best performance was achieved by fine-tuning the
integrated VRUNet for 15 epochs (see column 5 in
Table 6).
4.4 Performance Comparisons
Comparing the class-wised AP and overall mAP
scores of VRUNet, Faster R-CNN, and SSD (see Ta-
ble 7), we find that the proposed VRUNet performs
13.15% better mAP than FasterRCNN. It also excels
over SSD by achieving 9.07% higher mAP. In de-
tail, our model produces the highest APs for most
VEHITS 2024 - 10th International Conference on Vehicle Technology and Intelligent Transport Systems
264
Table 7: Comparing Processing Average Precision and mAP of VRUNet, SSD, and FasterRCNN.
Models
Average Precision
mAP
Motorbike Bicycle Dog Mobility Aids Stroller Wheelchair Mobility Scooter
VRUNet (our) 0.747 0.877 0.753 0.855 0.895 0.832 0.179 0.734
SSD 0.5528 0.794 0.6814 0.8272 0.8121 0.781 0.0549 0.6433
Faster-RCNN 0.002 0.8154 0.742 0.897 0.7613 1 0 0.6025
Table 8: Comparing Processing Time of VRUNet vs Faster-
RCNN and SSD.
Method Processing Time (s)
VRUNet (Ours) 0.0275
FasterRCNN 0.125
SSD 0.0153
types of vulnerable users (i.e., motorbike, bicycle,
dog, stroller, and mobility scooter). The motorbike’s
AP of our model is 19.42% higher than the SSD and
74.5% higher than the Faster R-CNN. We also notice
that the APs of the mobility scooter are much lower
than the other classes for all three models (see Fig. 6).
Lacking mobility scooter samples is the main reason.
Currently, our dataset only has 56 mobility scooter
samples. However, our model still produces the high-
est AP of this class, demonstrating that our model can
slightly reduce the influence of lacking training sam-
ples.
In assessing an object detection method’s perfor-
mance, processing time is an important metric that in-
dicates suitability to different requirements (e.g., near
real-time, real-time, or offline applications, etc.). On
average, the proposed VRUNet takes 0.0275s per im-
age to detect objects of interest, whereas the Faster
R-CNN and SSD methods took 0.125s and 0.0153s,
respectively. VRUNet performs around 4:55x faster
than Faster R-CNN, but slightly (1:8x) slower than
SSD. It is common to know that the one-stage models
process quicker than two-stage models. However, our
model achieves the close processing time to the one-
stage model. So, effectively, the proposed VRUNet
performs at speeds of at least 36 frames per second
on the computing platform used in this work.
5 CONCLUSION
In this paper, we proposed a two-stage Convolu-
tional Neural Network (CNN)-based VRUs detec-
tion and recognition framework called VRU-Net. We
considered Seven types of VRUs (MobilityScooters,
Wheelchairs, Strollers, MobilityAids, Motorbikes,
Bicycles, and Dogs) to detect at road intersections.
We predicted, in the first stage of the VRU-Net, only
the grid-cells that most likely contain a VRU of in-
terest. The predicted grid-cells regions are classi-
fied following their types by the second stage of the
CNN. We compared VRU-Net to two state-of-the-
art models SSD and Faster RCNN. The proposed
model achieves a speedup of 4.55×; and performs at
speeds of at least 36 frames per second on the com-
puting platform used in this project. Also, VRU-Net
has 13.2% higher mAP when compared to the Faster
RCNN. Our method also achieves 9% higher mAP,
comparing to SSD. As a future work, we plan to im-
prove our model considering special classes of VRUs,
different weather and illumination conditions, which
present unique challenges for detection and localiza-
tion methods.
REFERENCES
A. Mukhtar, M. J. Cree, J. B. S. and Streeter, L. (2018).
Mobility aids detection using convolution neural net-
work (cnn). In International Conference on Image and
Vision Computing New Zealand (IVCNZ), Auckland,
New Zealand, pages 1–5.
Espinosa, J. E., Velastin, S. A., and Branch, J. W. (2018).
Motorcycle detection and classification in urban sce-
narios using a model based on faster r- cnn. In Inter-
national Conference on Pattern Recognition Systems,
22-24 May, Valparaiso, Chile.
Everingham, M., Eslami, S. M. A., Gool, L. V., Williams,
C. K. I., Winn, J., and Zisserman, A. (2015). The
pascal visual object classes challenge: A retro- spec-
tive. International Journal of Computer Vision,
111(4):98–136.
Han, L., Zheng, P., Li, H., Chen, J., Hua, Z., and Zhang,
Z. (2022). A novel early warning strategy for right-
turning blind zone based on vulnerable road users de-
tection. Neural Comput and Applic, 34:6187–6206.
He, K., Zhang, X., Ren, S., and Sun, J. (2016). Deep resid-
ual learning for image recognition. In 2016 IEEE Con-
ference on Computer Vision and Pattern Recognition,
CVPR 2016, Las Vegas, NV, USA, June 27-30, 2016,
pages 770–778. IEEE Computer Society.
L. Beyer, A. H. and Leibe, B. (2017). Drow: Real-time deep
learning-based wheelchair detection in 2-d range data.
IEEE Robotics and Automation Letters, 2(2):585–592.
Lin, T.-Y., Maire, M., Belongie, S., Hays, J., Perona, P., Ra-
manan, D., Doll
´
ar, P., and Zitnick, C. L. (2014). Mi-
crosoft coco: Common objects in context. In Fleet,
D., Pajdla, T., Schiele, B., and Tuytelaars, T., edi-
tors, Computer Vision – ECCV 2014, pages 740–755,
Cham. Springer International Publishing.
Mammeri, A., Boukerche, A., and Tang, Z. (2016a). A real-
time lane marking localization, tracking and commu-
nication system. Comput. Commun., 73:132–143.
VRU-Net: Convolutional Neural Networks-Based Detection of Vulnerable Road Users
265

Mammeri, A., Zuo, T., and Boukerche, A. (2016b). Ex-
tending the detection range of vision-based vehic-
ular instrumentation. IEEE Trans. Instrum. Meas.,
65(4):856–873.
NHTSA (2019). Traffic safety facts: 2017 data. [NHTSA’s
National Center for Statistics and Analysis, U.S. De-
partment of Transportation, National Highway Traffic
Safety Administration (NHTSA), USA].
Redmon, J. and Farhadi, A. (2018). Yolov3: An incremental
improvement. CoRR, abs/1804.02767.
Ren, S., He, K., Girshick, R. B., and Sun, J. (2017). Faster
r-cnn: towards real-time object detection with region
proposal networks. IEEE Trans. Pattern Anal. Mach.
Intell., 39(6):1137–1149.
StatisticsCanada (2019). Circumstances surrounding cy-
cling fatalities in canada, 2006 to 2017. [Statistics
Canada].
Tzutalin (2015). Labelimg. [Git code 2015].
Vasquez A., Kollmitz M., E. A. and W., B. (2017). Deep de-
tection of people and their mobility aids for a hospital
robot. In Proceedings of the 2017 European Confer-
ence on Mobile Robots (ECMR’17).
VEHITS 2024 - 10th International Conference on Vehicle Technology and Intelligent Transport Systems
266
