
A Neural Network for Automatic Handwriting Extraction and
Recognition in Psychodiagnostic Questionnaires
Giulia Rosemary Avis
1 a
, Fabio D’Adda
1,2 b
, David Chieregato
1 c
, Elia Guarnieri
1,2 d
,
Maria Meliante
3
, Andrea Primo Pierotti
1,3 e
and Marco Cremaschi
1 f
1
Aton Informatica S.r.l, Centro Direzionale Baricentro, Casamassima, Bari, Italy
2
University of Milan, Bicocca, Department of Informatics, Systems and Communication, Viale Sarca 336, Milan, Italy
3
ASST Grande Ospedale Metropolitano Niguarda, Piazza Ospedale Maggiore 3, Milan, Italy
Keywords:
Image Classification, Model Alignment, Information Extraction, Questionnaire Digitalisation,
Computer Vision.
Abstract:
This paper presents PANTHER, a neural network model for automatic handwriting extraction and recognition
in psychodiagnostic questionnaires. Psychodiagnostic tools are essential for assessing and monitoring mental
health conditions, but they often rely on pen-and-paper administration, which poses several challenges for data
collection and analysis. PANTHER aims to address this problem by using a convolutional neural network to
classify scanned questionnaires into their respective types and extract the patient’s responses from the hand-
written annotations. The model is trained and evaluated on a dataset of five questionnaires commonly used in
psychological and psychiatric settings, achieving high accuracy and similarity scores. The paper also describes
the creation of an open-source library based on PANTHER, which can be integrated into a digital platform for
delivering psychological services. This paper contributes to the field of computer vision and psychological
assessment by providing a novel and effective solution for digitising pen-and-paper questionnaires.
1 INTRODUCTION
Psychodiagnostic tools are the key to unlocking the
mysteries of the human mind, as they are crucial for
professionals in the field of psychology and psychi-
atry to measure and observe a patient’s behaviour to
arrive at a diagnosis and guide treatment. They serve
various purposes, including assessing symptoms re-
lated to mental health conditions, evaluating symp-
tom severity, and measuring the impact of psychiatric
disorders on daily functioning. Additionally, they ef-
fectively assess intellectual functioning, personality,
memory, and interests (Watkins et al., 1995). Their
benefits range from reducing in-patient time and as-
sociated psychiatric care costs to providing frequent
feedback on symptoms (Holl
¨
andare et al., 2010).
a
https://orcid.org/0000-0001-7840-6228
b
https://orcid.org/0009-0006-0995-0661
c
https://orcid.org/0000-0002-6507-3708
d
https://orcid.org/0000-0003-3461-5372
e
https://orcid.org/0000-0002-7124-5668
f
https://orcid.org/0000-0001-7840-6228
The origins of psychodiagnostic tools date back
to the 20th century, with one of the earliest assess-
ments being the Binet-Simon Intelligence Scale cre-
ated by Alfred Binet and Th
´
eodore Simon in 1905.
Initially designed to assess cognitive abilities in chil-
dren, this scale has since transformed into the stan-
dardised Stanford-Binet test. Alongside this devel-
opment, other psychodiagnostic tools emerged in the
early 20th century (Lanyon, 2011).
Traditionally, questionnaires were administered
using pen-and-paper, a method with robust psycho-
metric properties (Seward et al., 2018). This process
involves distributing printed questionnaires to indi-
viduals who manually complete them using a pen or
pencil. While this approach remains a common way
to administer questionnaires, it may not necessarily
be the most optimal or effective, given the critical
issues it presents. Notably, the logistical burden of
collecting and manually scoring completed question-
naires by therapists can evolve into a time-consuming
process, encompassing costs and time associated with
printing, distributing, collecting, and manually enter-
ing data for analysis (Touvier et al., 2010). A sur-
140
Avis, G., D’Adda, F., Chieregato, D., Guarnieri, E., Meliante, M., Pierotti, A. and Cremaschi, M.
A Neural Network for Automatic Handwriting Extraction and Recognition in Psychodiagnostic Questionnaires.
DOI: 10.5220/0012587600003699
Paper published under CC license (CC BY-NC-ND 4.0)
In Proceedings of the 10th International Conference on Information and Communication Technologies for Ageing Well and e-Health (ICT4AWE 2024), pages 140-151
ISBN: 978-989-758-700-9; ISSN: 2184-4984
Proceedings Copyright © 2024 by SCITEPRESS – Science and Technology Publications, Lda.

vey conducted among UK psychiatrists revealed that
a common deterrent for not using self-report question-
naires is the lack of infrastructure to support the ad-
ministration, scoring, and storage of data (Holl
¨
andare
et al., 2010). Manual scoring of questionnaires intro-
duces the potential for human error, thereby impact-
ing result accuracy (Engan et al., 2016). Although
continuously relying on this method can lead to inef-
ficient data collection, storage and analysis, the pen-
and-paper method has been the standard for many
years and the basis for developing and validating var-
ious psychodiagnostic tools (Tolley et al., 2015).
In this regard, over the past three decades, there
has been a notable increase in the adoption of
computer-assisted assessment. By 1999, 40% of psy-
chologists reported using some form of computer-
assisted testing (McMinn et al., 1999). This method
has several advantages, including saving valuable
professional time, enhancing test-retest reliability,
mitigating potential tester bias, and decreasing con-
sumer costs by improving efficiency (Butcher et al.,
2000; Groth-Marnat, 1999). Moreover, the advan-
tages of this transition extend to the administration
phase, where it enables skipping irrelevant items
based on previous answers (van Ballegooijen et al.,
2016) and the subsequent treatment and usage of data.
Digitisation will indeed facilitate the integration of
questionnaire results into electronic health records
and comprehensive digital diagnostic technologies.
As a result, it will streamline the real-time monitoring
of a patient’s mental health status (Martin-Key et al.,
2022).
The emergence of electronic administration meth-
ods presents an opportunity to improve the process of
questionnaire execution while maintaining its valid-
ity. It is important to note that the mode of submis-
sion, whether pen-and-paper or electronic, has been
found to have a relatively small effect on the mean
responses given to the questionnaires (Coons et al.,
2009).
However many benefits the transition to digital
administration can have, it will have to be gradual
in contexts where pen-and-paper tools have been the
standard for years. There are also specific cases,
such as when working with an elderly population,
where traditional tools may be more suitable (Paulsen
et al., 2012). Moreover, the creation of digital health
records will require, for the patients already in care,
an integration of data from paper-based question-
naires completed in the past.
Hence, apart from creating instruments for digital
dispensing, it is essential to address the need for a so-
lution to automate the data acquisition process from
paper-based questionnaires. In this regard, using Ar-
tificial Intelligence (AI) can prove highly beneficial.
An AI tool can ensure seamless integration of paper
questionnaires with electronic resources, allowing for
better coordination of care and improved monitoring
of patients’ mental health over time.
This paper presents a model named PANTHER
(Psychiatric Administration Neural neTwork for
Handwritten Extraction and Recognition), a model
designed for the automated recognition of digitised
questionnaires (e.g., through a scanner). By employ-
ing a Convolutional Neural Network (CNN), PAN-
THER extracts a vectorial representation of question-
naire images. Upon obtaining this representation, the
model classifies the images into various types of com-
piled questionnaires. Subsequently, PANTHER iden-
tifies the specific subsections, items, and page seg-
ments containing patient responses within the classi-
fied questionnaires.
We make the following contributions:
• an analysis of the literature related to the digitisa-
tion of questionnaires, with a focus on those per-
taining to the psychological/psychiatric domain,
and an assessment of the level of digitisation in
the psychological field;
• a reproducible pipeline that can be generalised for
the digitisation of any type of questionnaire;
• PANTHER
1
, an open-source library for question-
naire classification and result extraction.
This paper is organised as follows: Section 2 con-
tains an overview of the State of the Art (SOTA);
Section 3 describes the dataset used to validate the
proposed approach; in Section 4 the approach is pre-
sented with detailed description of the preprocessing
phase, feature extraction, classification techniques,
alignment and extraction of filled questions; in Sec-
tion 5 accuracy and similarity measures are used to
validate the presented approach; in Section 6 the con-
tributions of this paper are presented, consisting of an
open source library which will be used inside a larger
digital platform for digitalisation of services for psy-
chological personnel.
2 RELATED WORKS
In the field of psychology and psychiatry, psychodiag-
nostic tools, such as questionnaires, play a crucial role
in assessing well-being, coping behaviour, personal-
ity traits, and psychological flexibility. The standard-
ised use of questionnaires in psychological research
1
bitbucket.org/disco unimib/panther
A Neural Network for Automatic Handwriting Extraction and Recognition in Psychodiagnostic Questionnaires
141
and practice, emphasising the extraction of subscales,
has become commonplace (Franke, 1997).
Completing psychodiagnostic questionnaires re-
quires both the patient’s and the professional’s ef-
fort. The administration of these questionnaires to
patients involves providing them with the necessary
instructions and a suitable environment to complete
the forms. Patients may be given the questionnaires
during their clinical visit or may be provided with
electronic versions to complete at home. The average
completion time for these questionnaires varies de-
pending on the specific instrument and the individual
patient. For example, the PQ-16 italian version (iPQ-
16 (Lorenzo et al., 2018)) is a 16-item questionnaire,
and the average completion time may range from 5 to
15 minutes, depending on the patient’s reading and
comprehension abilities. The CBA-VE (Michielin
et al., 2009) is an 80-item questionnaire; compilation
times can take up to 30 minutes.
Once the questionnaires are completed, psychol-
ogists process the responses to create metrics. This
involves scoring the questionnaires based on prede-
termined criteria and guidelines, which may signif-
icantly vary for each questionnaire. The question-
naires are printed and manually completed using a
pen or pencil. The psychologist must then manually
read and annotate each response to obtain evaluation
metrics. In the best situations, some organisations
have automated the calculation of metrics through
spreadsheets (e.g., Excel), which still require manual
data entry. The poor automation of this activity often
leads to the introduction of human errors, which can
enormously influence the patient’s assessment and the
treatment planning that the patient will have to fol-
low (Simons et al., 2002).
Although there have been some initiatives aimed
at creating digital platforms for the administration of
psychodiagnostic tools, as indicated in the previous
section, their maturity and dispersion remain to be im-
proved. There is, therefore, a need for systems capa-
ble of digitising pen-and-paper questionnaires.
In recent scientific literature, there are only a few
works on automating the processing and scoring of
already compiled questionnaires. Notably, Optical
Mark Recognition (OMR) and Intelligent Character
Recognition (ICR) technologies have emerged for this
purpose. OMR enables the detection of marks within
checkbox responses, whereas ICR recognises hand-
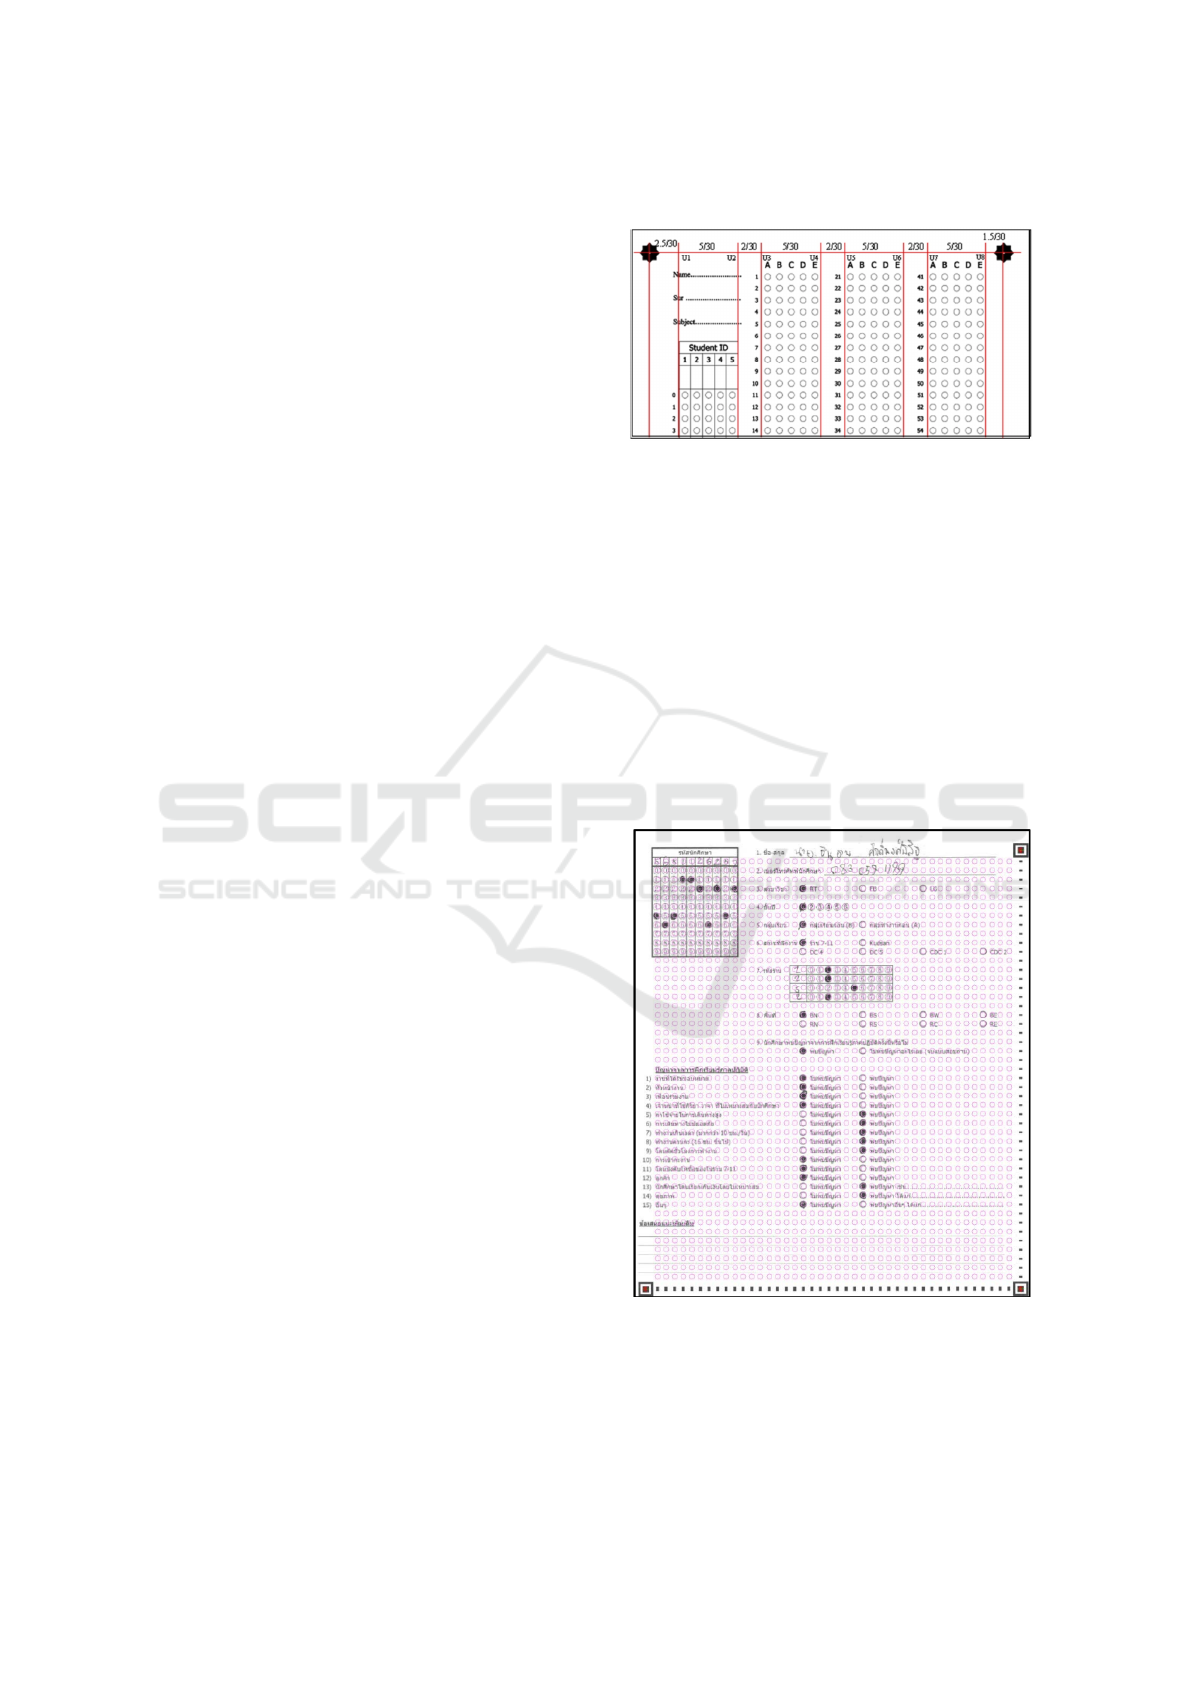
written characters. However, traditional OMR sys-
tems (similar to the example in Figure 1) lack flexi-
bility as they require the use of specific paper types
for printing the questionnaire and a dedicated device.
Despite requiring extensive manual preparation work,
these approaches are valid alternatives to manual pro-
cessing (Paulsen et al., 2012).
Figure 1: An example of a traditional OMR questionnaire.
In this regard, some proposals have developed an
OMR system without the previously mentioned con-
straints (Sanguansat, 2015). An example is shown
in Figure 2. Nonetheless, annotating them with po-
sition detection patterns is essential when processing
questionnaire sheets. To this extent, the LightQuest
approach has been designed, which allows for rapid
questionnaire model creation but requires document
annotation with alignment targets and is unsuitable
for retrospectively completed questionnaires (Chabert
et al., 2021). The alignment mainly aims to match the
acquired documents with a model. The information
in the questionnaires is still extracted measuring the
content of black in a predefined rectangle.
Figure 2: The questionnaire proposed in (Sanguansat,
2015).
In the proposed setting this kind of techniques
is not applicable as the questionnaires are not pre-
pared for digital acquisition. The most recent tech-
ICT4AWE 2024 - 10th International Conference on Information and Communication Technologies for Ageing Well and e-Health
142

nique for image alignment in the SOTA use com-
puter vision techniques (Patel et al., 2015) such as
Random Sample Consensus (RANSAC) to align doc-
uments without requiring specific alignment targets,
whose precision is close to 100% (Maniar et al.,
2021), leveraging the capabilities of OpenCV
2
. An-
other attempt has been done by (Zaryab and Ng,
2023), which highlights the use of Artificial Neural
Network (ANN) for Region of Interest (ROI) detec-
tion and OCR (Text Recognition) in handwritten med-
ical forms, with a focus on German handwritten text
recognition. Also (Norbert et al., 2023) proposes an
RPA-based software robot to assist healthcare pro-
fessionals in digitising handwritten medical forms,
while (Cao and Govindaraju, 2007) presents an algo-
rithm which utilises a vector model based on multiple
word recognition choices, incorporating segmentation
probabilities and a Gaussian function for the posterior
probability of word recognition, with the purpose of
automating data collection from Prehospital Care Re-
ports (PCR forms) forms. Other authors have con-
tributed a system utilising Machine Learning (ML)
for text recognition, automatically extracting answers
with a precision ranging from 85% to 90% (Yasmin
et al., 2017). Unfortunately, the unavailability of the
code for these solutions precludes the exact reproduc-
tion of their approach.
3 DATASET
This project originates from collaboration with the
CPS “Giovani di Niguarda”, the Psychosocial Cen-
ter of “ASST Grande Opsedale Metropolitano Ni-
guarda”
3
, one of the most significant public hospi-
tal facilities in Milan, assisting approximately 500
patients each year with varying degrees of sever-
ity. Given the ongoing collaboration with the CPS,
the dataset creation process has involved the se-
lection of the five most extensively utilised ques-
tionnaires by institutions in their Italian version:
Cognitive Behavioural Assessment Outcome Evalu-
ation (CBA-VE), 16-item Prodromal Questionnaire
(PQ-16), Early Recognition Inventory for the retro-
spective assessment of the Onset of schizophrenia
Checklist (ERIraos-CL), Global Assessment Func-
tioning (GAF), and Social and Occupational Func-
tioning Assessment Scale (SOFAS). Below is a brief
description of these questionnaires:
2
opencv.org. Retrieved February 20, 2024
3
www.ospedaleniguarda.it. Retrieved February 20,
2024
• CBA-VE is an Italian tool designed to assess the
effectiveness of psychological treatments. It con-
sists of 80 items with a 5-point scale focusing on
the psychological state of the past 15 days, cov-
ering areas such as anxiety, well-being, positive
change perception, depression, and psychologi-
cal distress. The dataset analysis aims to evalu-
ate treatment outcomes based on individual and
treatment-related factors. (Michielin et al., 2009).
• PQ-16 is a screening tool designed to assess the
presence of prodromal symptoms associated with
psychosis or schizophrenia. It consists of 16 self-
report items that individuals respond to based on
their experiences. The questionnaire aims to iden-
tify subtle or early signs of psychosis that may
precede the onset of a full-blown psychotic dis-
order. Questions typically cover various aspects,
such as perceptual abnormalities, cognitive dis-
turbances, and social functioning. The PQ-16 is
commonly used in research and clinical settings
as part of a broader assessment to identify indi-
viduals at risk of developing psychosis (Lorenzo
et al., 2018).
• ERIraos-CL is a structured interview designed to
detect the presence of symptoms associated with
psychosis, as well as perceptual and dissociative
phenomena. It serves as a concise support for
the initial assessment of the diverse population of
young help-seekers experiencing symptoms con-
sistent with a prodromal state of psychosis. This
screening tool is the primary choice within early
intervention services to ascertain whether there
are grounds for proceeding with a more compre-
hensive assessment (Meneghelli et al., 2013).
• GAF/SOFAS are two scales used to assess the
severity of a person’s psychological and psychi-
atric symptoms. GAF assesses an individual’s
general functioning on a scale of 1 to 100, where
100 represents the highest functioning and 1 the
lowest. SOFAS is similar to GAF but focuses
on a person’s social and occupational function-
ing (American Psychiatric Association, 2000).
For each questionnaire, 10 anonymous response
sheets were collected. Each administration was then
digitised using a scanner. Considering the number
of pages for each questionnaire, the resulting dataset
consists of 80 images (1 653×2 338 pixels at 72 DPI),
distributed as shown in Table 1.
A Neural Network for Automatic Handwriting Extraction and Recognition in Psychodiagnostic Questionnaires
143

Table 1: Images per questionnaire.
Questionnaire # images
CBA-VE 30
PQ-16 10
ERIraos-CL 20
GAF 10
SOFAS 10
4 APPROACH
In this Section, we present PANTHER, a tech-
nique designed for classifying psychodiagnostic ques-
tionnaires and extracting corresponding patient re-
sponses. The tool is specifically developed to cate-
gorise a given set of PDF-format questionnaires (q ∈
Q) across a range of predefined categories (t ∈ T ),
each representing a distinct questionnaire type. The
primary objective is establishing an association be-
tween each questionnaire (q ∈ Q) and its correspond-
ing type (t ∈ T ). Once the type is identified, the re-
sponses are extracted and digitally archived for fur-
ther analysis.
The pipeline of the process is represented in Fig-
ure 3, and it is composed of 3 sequential phases:
(i) Image Pre-processing, (ii) Feature Extraction,
(iii) Classification, and (iv) Image Alignment and
Extraction.
4.1 Image Pre-Processing
The initial phase involves applying preliminary tech-
niques to raw data before it is fed into a ML algo-
rithm for training or testing. Pre-processing aims to
convert the raw data into a format suited for analysis,
thereby enhancing the performance and reliability of
ML models. Specifically, in this scenario where the
dataset consists of PDFs, the following steps are un-
dertaken to carry out the pre-processing:
1. Image Loading. The image dataset is loaded,
and each image is transformed using the “RGB”
colour model. This implies that each image is en-
coded with three channels: red, green, and blue,
so each pixel occupies 3 bytes of storage, one for
each colour channel.
2. JPG Conversion. The initial step entails convert-
ing each image, initially in PDF format, into a for-
mat compatible with the Image
4
library in Python.
4
pillow.readthedocs.io/en/stable/reference/Image.html.
Retrieved February 20, 2024
To accomplish this, the pdf2image library
5
is em-
ployed in the computational process.
3. Resizing. This step consists of adjusting images
to a consistent size to ensure uniformity in the
dataset. This is important because most ML mod-
els expect input data with consistent dimensions.
Once the image has been loaded, it is resized by
using the “resize” method in PIL library. The
method is used to resize an image to a specified
size, maintaining the original image’s aspect ra-
tio. ML models employed in the next sections are
designed to accept input images of size 224×224
pixels, which is a common input size for many im-
age classification models. The PIL library tends to
preserve the quality and aspect ratio of the image.
Figure 4 shows an example of a resized question-
naire.
4. Normalisation. The final stage involves normal-
ising the image vector using mean and standard
deviation. The image is normalised using the fol-
lowing formula:
image = (image −mean)/std
Specifically, the images are normalised us-
ing mean = [0.485,0.456,0.406] and std =
[0.229,0.224, 0.225]. This normalisation ap-
proach is employed because the models discussed
and elaborated upon in the subsequent subsection
anticipate input images to be normalised in this
manner
6
. An example of CBA-VE normalised
questionnaire is shown in Figure 5.
4.2 Feature Extraction
Given the remarkable ability of ML models in image
recognition tasks, we adopted a ML based solution to
extract relevant features from questionnaire images.
Due to the limited size of the dataset, the Trans-
fer Learning (TL) technique has been chosen to ex-
tract feature vectors from images within our dataset.
This technique is particularly useful when the target
task has limited labelled data, so instead of training a
model from scratch, TL allows leveraging knowledge
acquired from a more extensive dataset related to a
different task.
ML models are utilised for image classification
due to their ability to discern patterns and features
in large datasets, making them highly effective in
5
pdf2image.readthedocs.io/en/latest/. Retrieved Febru-
ary 20, 2024
6
pytorch.org/vision/0.8/models.html. Retrieved Febru-
ary 20, 2024
ICT4AWE 2024 - 10th International Conference on Information and Communication Technologies for Ageing Well and e-Health
144
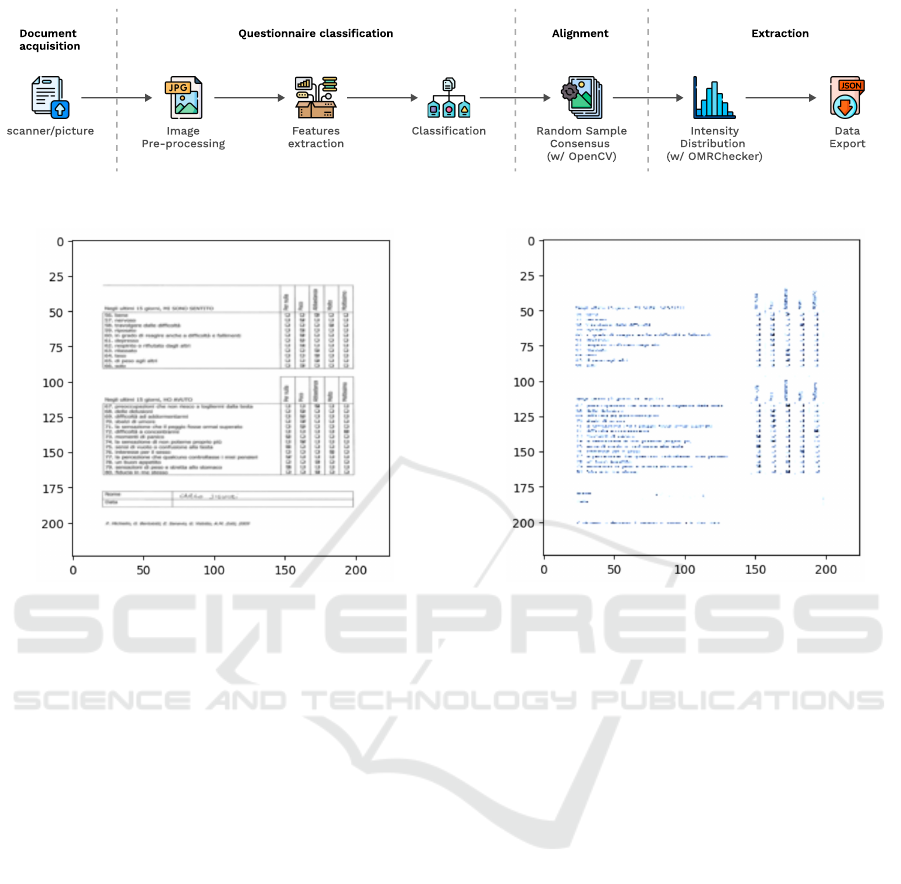
Figure 3: PANTHER pipeline.
Figure 4: Example of resized questionnaire image.
tasks that involve visual recognition. Traditional rule-
based systems often struggle to capture the complex-
ity and variability in images, especially when com-
pared with diverse and dynamic visual information.
ML models, particularly deep learning models, ex-
cel at learning hierarchical representations of features
from raw data. In the context of image classifica-
tion, these models can automatically extract relevant
features and patterns from images, allowing them to
recognise and categorise objects, scenes, or patterns
with remarkable accuracy. The process involves train-
ing the model on a labelled dataset, where it learns to
associate specific features with corresponding labels.
Once trained, the model can generalise its knowl-
edge to accurately classify new, unseen images. Their
capacity to handle complex visual information and
adapt to diverse scenarios has positioned ML mod-
els as a cornerstone in advancing image classification
technologies. The types of model used to address im-
age tasks are CNN, which are a class of Deep Neu-
ral Networks designed for processing structured grid
data. They are particularly effective in tasks related
to computer vision, image recognition, and other vi-
sual data analysis applications. CNNs have proven
to be highly successful in these domains due to their
ability to learn hierarchical features from input data
automatically (O’Shea and Nash, 2015). An example
Figure 5: Example of normalised questionnaire.
of an architecture of CNN is represented in Figure 6.
There is a vast amount of models available to
extract feature vectors; Among these CNN models,
some networks are very classic due to their excellent
generality and accuracy (Du et al., 2023):
1. VGG16 is a specific CNN architecture that was
introduced by the Visual Graphics Group (VGG)
at the University of Oxford. The “16” refers to
the total number of weight layers in the network,
including convolutional layers, Fully Connected
(FC) layers, and softmax layers for classification.
VGG16 gained popularity for its simplicity and ef-
fectiveness in image classification tasks. The to-
tal number of parameters in VGG16 is 138M (Si-
monyan and Zisserman, 2014);
2. GoogleNet is a CNN architecture developed by
researchers at Google, which has been designed
to address challenges such as computational ef-
ficiency, as well as the vanishing/exploding gra-
dient problems associated with very deep neu-
ral networks. The total number of parameters in
GoogleNet is 5M (Szegedy et al., 2015);
3. Resnet18 is a specific CNN architecture that is
part of the ResNet (Residual Networks) family.
Resnet18 was introduced to address the challenge
of training very deep neural networks. The main
A Neural Network for Automatic Handwriting Extraction and Recognition in Psychodiagnostic Questionnaires
145

Max-Pool Convolution Max-Pool Dense
8@128x128
8@64x64
24@48x48
24@16x16
1x256
1x128
Figure 6: The CNN model architecture.
innovation of Resnet18 is the use of residual or
skip connections, which help mitigate the van-
ishing gradient problem during training. Mul-
tiple ResNet architectures are available, such as
Resnet34, ResNet50, ResNet101 and ResNet152,
but the choice of using Resnet18 is related to its
fewer number of parameters, which makes it com-
putationally lighter and faster. It also requires less
memory and processing power compared to other
ResNet architectures. The total number of param-
eters in Resnet18 is 11M (He et al., 2016).
Leveraging each of the three previously mentioned
models, a feature vector was derived for each image
in the dataset. This process can be executed through
various methods involving the removal of one or more
layers from the model. The decision to perform this
adjustment aims to acquire vectors that depict images
at a distinct level of granularity. Typically, initial lay-
ers capture low-level features and patterns from the
input data, while the final layers map high-level fea-
tures extracted starting from convolutional and pool-
ing layers to the output classes specific to the final
task (Alzubaidi et al., 2021). Therefore, if the task
closely aligns with the model’s training objective, it
is feasible to truncate the model towards the end of
the CNN, particularly within the FC layers. VGG16,
GoogleNet, and Resnet18 underwent training using
supervised learning techniques on extensive labelled
datasets. All three models were trained on the Ima-
geNet dataset (Deng et al., 2009), a substantial collec-
tion that includes millions of labelled images across
numerous categories, serving as a benchmark for im-
age classification tasks. Given the similarity between
our task and the ImageNet challenge, which focuses
on image recognition, we explored two distinct cuts
for each network.
The feature vectors obtained in this phase serve as
the input for the subsequent classification step.
4.3 Classification
This step of the pipeline is the classification, wherein
predefined labels or categories are assigned to input
data based on its distinctive characteristics or features.
Classification, a form of supervised learning, involves
training the algorithm on a labelled dataset, where in-
put data is paired with corresponding output labels.
In this phase, the input comprises feature vectors ex-
tracted from pre-trained models, serving as the basis
for classifying the represented images. The execu-
tion of this task involves the utilisation of two distinct
techniques:
1. Supervised Classification. It adopts the classi-
cal ML paradigm that focuses on training mod-
els to make accurate predictions, even if very lim-
ited examples for each class are available. In tra-
ditional ML approaches, models often require a
large amount of labelled training data to gener-
alise well to new, unseen examples. However, in
many real-world scenarios, obtaining a large la-
belled dataset can be challenging and expensive.
2. Similarity Classification. This method refers to a
type of classification where the similarity between
instances or data points is a key factor in determin-
ing their class or category. In traditional classifi-
cation, a model is trained on a specific set of la-
belled classes, and it can only predict labels from
that predefined set. However, similarity classifi-
cation is capable of classifying images never seen
before into categories never seen before, making
this technique zero-shot.
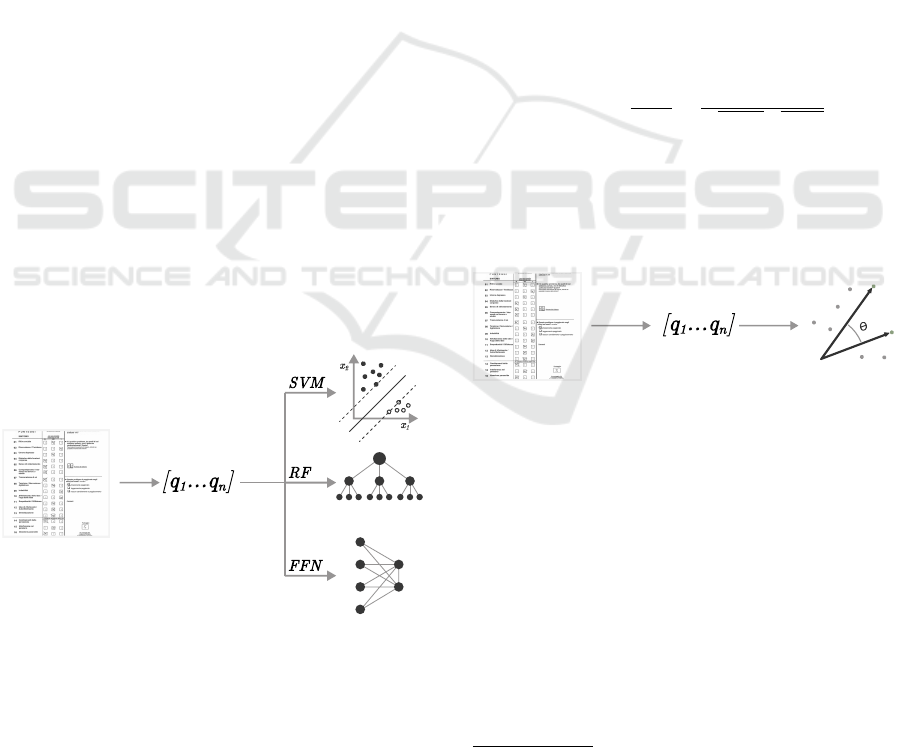
4.4 Supervised Classification
Supervised classification uses pre-trained vectors and
trains a simple classifier to recognise the question-
naire category (Figure 7). In our case, two types of
ML classifiers have been tested:
ICT4AWE 2024 - 10th International Conference on Information and Communication Technologies for Ageing Well and e-Health
146
1. Support Vector Machine (SVM). SVM are a
class of supervised ML algorithms used for classi-
fication and regression tasks. This ML technique
is particularly well-suited for scenarios where
the data can be represented as points in a high-
dimensional space, like feature vectors in PAN-
THER (Noble, 2006).
2. Random Forest (RF). RF is an ensemble learn-
ing method that can be used for classification
tasks. It is robust, handles non-linear relation-
ships well, and can work with dense feature vec-
tors (Biau and Scornet, 2016).
3. FC Layer: is a type of layer, also known as dense
layer, in a neural network where each neuron or
node is connected to every neuron in the previous
layer and every neuron in the next layer. In the
context of a classifier, a FC layer is often used as
the final layer of a neural network to make predic-
tions based on the features extracted by the pre-
ceding layers. In this case, the FC is replaced at
the end of each base model (VGG16, GoogleNet
and Resnet18) to perform our task-specific pre-
diction. Often, the FC layer is also used as a clas-
sifier for dense feature vectors because it allows
for complex relationships to be learned between
the input features (Basha et al., 2020).
SVM, RF and FC models have been trained in a
supervised way on questionnaires by using the pro-
vided dataset. These models take as input vectors of
high-level features learned by pre-trained models and
then try to classify vector images in the correct cate-
gory. Results are shown in Table 2.
Figure 7: Supervised Classification algorithm.
4.5 Similarity Classification
A similarity classification technique has been applied
for classifying questionnaires using a similarity met-
ric. In this case, the algorithm does not apply any
training phase to any model for building the recog-
nition system. This means that only feature vectors
obtained in the previous step are used to perform the
task. The algorithm’s core lies in comparing images
of patient questionnaires filled out with ground truth
vectors obtained by high-quality images of original
PDF questionnaires (Figure 8). The underlying as-
sumption of this algorithm is that the vectors of the
pages filled out by patients will have high similarity to
the original yet-to-be-filled questionnaires. This tech-
nique allows for comparing the individual image em-
bedding with all vectors of the original images. If ad-
ditional questionnaires are added in the future, there
would be no need for any training; instead, one would
simply compute the new vectors by using the previ-
ously mentioned models.
The metric used to compute the similarity between
vectors is the Cosine Similarity
7
, which provides a
measure of similarity that is invariant to the magni-
tude of the vectors. When dealing with embeddings
or feature vectors, the magnitude of the vector can be
influenced by factors such as scaling, and cosine sim-
ilarity helps address this issue.
The cosine similarity
cos(Θ) =
q·t
∥
q
∥∥
t
∥
=
∑
n
i=1
q
i
t
i
√
∑
n
i=1
q
2
i
√
∑
n
i=1
t
2
i
where q is the vector representation
[q
1
,q
2
,q
3
,..., q
n
] of the questionnaire compiled
by the patient and t is the vector representation
[c
1
,c
2
,c
3
,..., c
n
] of the yet-to-be filled questionnaire
(the clear one).
Figure 8: Similarity Prediction algorithm.
4.6 Image Alignment and Extraction
The last phase of the pipeline is to align and extract
information from the image questionnaires. Once
these are correctly classified, the information related
to the type of questionnaire submitted is obtained. We
achieved this result by using OMRChecker
8
, an open-
source library available in Python. This library is a
versatile tool designed for the precise reading and as-
sessment of OMR sheets, using either a scanner or an
image taken with a mobile phone. It excels in process-
ing customised OMRs, delivering nearly flawless ac-
curacy, especially when applied to high-quality doc-
7
pytorch.org/docs/stable/generated/torch.nn.CosineSim
ilarity.html. Retrieved February 20, 2024
8
github.com/Udayraj123/OMRChecker. Retrieved
February 20, 2024
A Neural Network for Automatic Handwriting Extraction and Recognition in Psychodiagnostic Questionnaires
147

ument scans. The library for extracting information
from the grid filled out by the user requires alignment
with the file template to capture the provided answers.
To specify this template, a configuration file named
“template.json” is created, which allows us to define
all the parameters for creating the alignment. Once
alignment is achieved, the distribution of the grey
colour scale in the image can be used as a response
classification criterion. This, coupled with a speci-
fied cutting threshold, facilitates the identification of
marked questionnaire items. The OMR extracts the
response given by the patient (or the therapist) for
each question. The output of this final phase is re-
turned in JSON format, representing the digitisation
of the submitted and completed questionnaire. An
example of how responses are extracted from ques-
tionnaires is represented in Figure 9. Specifying the
template for OMRChecker to extract responses ne-
cessitates the creation of a distinct template for each
type of questionnaire. For this reason, the recognition
step (Section4.3), before effectively extracting the re-
sponses, is essential.
5 EVALUATION
This Section presents the assessment of the experi-
ments that were conducted, which is divided into two
parts. The first part shows the outcomes of the exper-
imentation for the supervised model in questionnaire
classification, while the second part validates the sim-
ilarity classification algorithm.
The first model, which is Supervised Classifica-
tion, uses the previously described dataset of images
and trains every model: SVM, RF and FC layer.
Our dataset was pretty limited in terms of size, for
this reason a k-fold-cross validation (Browne, 2000)
has been used to train SVM, RF and FC with k = 10
(8 instances per fold). This value represents a com-
mon choice and strikes a balance between bias and
variance. The choice of Cross-validation is a statis-
tical technique used in ML and statistical modelling
to assess the performance and generalisability of a
predictive model. Its primary purpose is to provide a
more accurate and reliable estimate of a model’s per-
formance by using different subsets of the data for
training and testing. The basic idea behind cross-
validation is to divide the dataset into multiple sub-
sets or “folds”. In this case, the model is trained k −1
folds and then evaluated on the remaining fold. This
process is repeated multiple times, each time using a
different set of folds for training and testing.
The second series of experiments conducted per-
tains to Similarity classification. In this context, im-
Table 2: Training results of SVM, RF and FC layer by using
feature vectors obtained from the penultimate layer.
Pretrained
Model
Vector
Size
Classification
Model
Accuracy
VGG16 4096
SVM 0.987
RF 0.825
FC Layer 0.625
SVM 0.375
RF 0.412
GoogleNet 1024
FC Layer 0.375
ResNet18 512
SVM 0.900
RF 0.700
FC Layer 0.375
age vectors derived from pre-trained models using
compiled questionnaires are assessed against vectors
generated from cleaned questionnaires, which serve
as the benchmark for evaluating the similarity be-
tween the compiled vector images and their cleaned
counterparts.
Numerous experiments are feasible due to the
flexibility in cutting CNN models at various points.
In our study, we made two cuts for each model, aim-
ing to extract vectors from the penultimate (Table 3)
and ante penultimate (Table 5) layers, excluding the
final layer, which serves a classification role.
Table 3: Similarities using vectors obtained by cutting the
penultimate model layer.
Model Vector Size Accuracy
VGG16 4096 0.813
GoogleNet 1024 0.113
ResNet 512 0.376
The VGG16 network attains the highest perfor-
mance, boasting an accuracy of approximately 0.81.
An illustrative comparison is presented in the ta-
ble below, highlighting instances where the similar-
ity between ground truth vectors and an image from
the dataset results in missclassification. Results are
shown in Table 4.
The table illustrates how the similarity approach
erroneously categorises the questionnaire as SOFAS
instead of the correct category, which is PQ 16. The
second conducted experiment using Similarity Classi-
fication, utilises vectors extracted from the models by
cutting the CNN at the ante-penultimate layer. This
approach results in vectors with larger dimensions to
retain more information within the embedding. The
expectation is that computational time will increase
ICT4AWE 2024 - 10th International Conference on Information and Communication Technologies for Ageing Well and e-Health
148
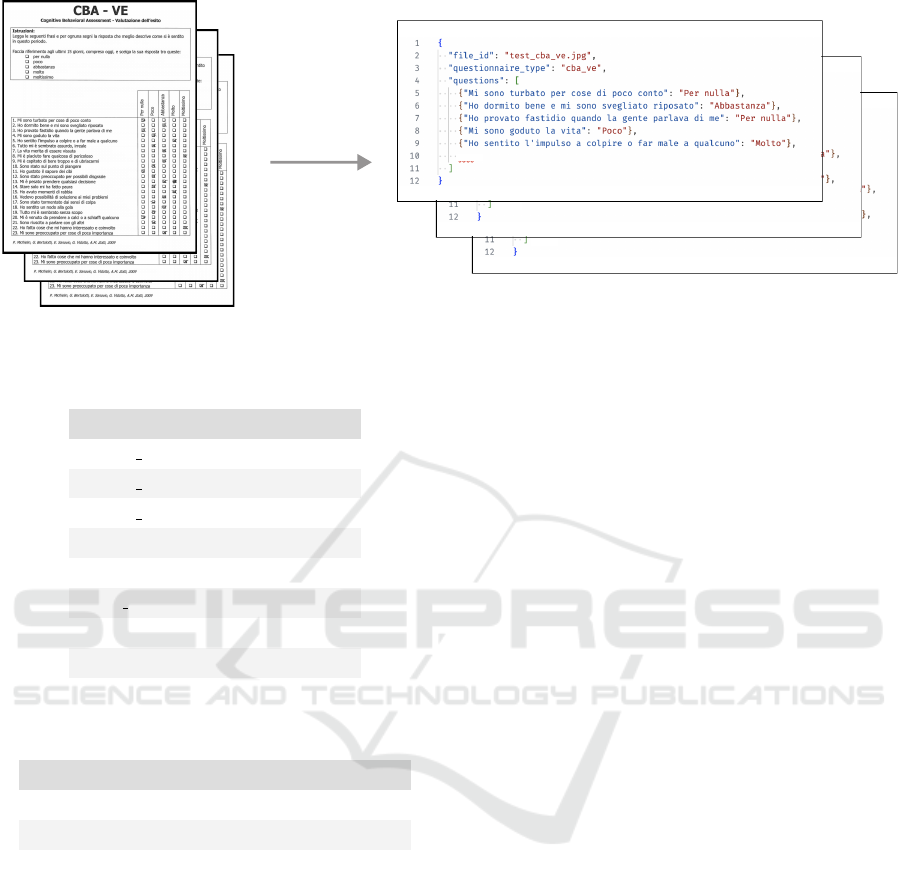
Figure 9: Response extraction from questionnaires.
Table 4: Similarity example using compiled image of PQ
16 questionnaire (VGG vector of size 4096).
Questionnaire Similarity
CBA VE p1 0.845
CBA VE p2 0.775
CBA VE p3 0.819
ERIRAOS p1 0.811
ERIRAOS p2 0.773
PQ 16 0.846
GAF 0.841
SOFAS 0.856
Table 5: Similarities using vectors obtained by cutting the
last 2 layers.
Model Vector Size Accuracy
VGG16 25088 1.0
GoogleNet 50176 0.90
ResNet 25088 1.0
but with higher accuracy. Results are shown in Ta-
ble 5.
Generally, VGG16 and Resnet18 achieve better
performances than GoogleNet. The reason could be
that VGG16 and Resnet18 have relatively simpler ar-
chitectures compared to GoogleNet. When limited
data are available, simpler networks tend to generalise
better. They are less prone to overfitting, which oc-
curs when a model learns the training data too well
but fails to generalise to new data. GoogleNet, with
its more complex architecture, might require a larger
dataset or more sophisticated optimisation to achieve
the best performance. Both classification techniques
achieved peak accuracy levels, although, in the Sim-
ilarity Classification, the algorithm requires a larger
embedding representation of the image as input. Ad-
ditionally, Similarity Classification has the advantage
of being able to add additional types of question-
naires to classify without having to perform any kind
of training. Anyway, in order to perform the classifi-
cation task, the two algorithms presented (Similarity
Classification and Supervised Classification) can be
seen as independent modules that can be invoked for
the questionnaire classification step.
Following the successful classification of ques-
tionnaire pages into their respective models, an es-
sential step in the extraction of compiled informa-
tion involves achieving alignment between scanned
images and the designated models. As delineated in
the SOTA section, employing the RANSAC algorithm
with OpenCV stands out as the current optimal ap-
proach for achieving an exceptionally high-precision
alignment of images with models. After achieving
alignment, the distribution of the grey colour scale
within the image serves as a criterion for response
classification. This, combined with a defined cutting
threshold, streamlines the identification of marked
questionnaire items.
6 CONCLUSIONS
In conclusion, while many tools exist that, when
used collectively, can yield outcomes comparable to
the digitisation of hand-filled questionnaires, this pa-
per introduces an innovative neural network model
specifically developed for the automatic extraction
and recognition of psychodiagnostic questionnaires.
Additionally, the presented tool facilitates the digiti-
sation of a substantial volume of questionnaires with
minimal human intervention.
The dataset for this project comprised anonymous
responses to five extensively used questionnaires in
A Neural Network for Automatic Handwriting Extraction and Recognition in Psychodiagnostic Questionnaires
149

their Italian versions: CBA-VE, PQ-16, ERIraos-CL,
GAF, and SOFAS. These cover various psychological
and psychiatric aspects and serve as essential tools in
assessing and treating patients.
An issue encountered is certainly the lack of a
higher quantity of data to perform a consistent fine-
tuning of the convolutional networks used. For this
reason, during the process, the choice of using a
Transfer Learning technique, without fine-tuning
the CNNs (GoogleNet, VGG16 and Resnet18), has
been taken. Additionally, due to the highly sensi-
tive nature of the information contained in this type of
questionnaire, a labelled dataset serving as a ground
truth for accurate assessment was not found. There-
fore, the validation of the extraction phase lacked a
measurable metric.
Currently, the tool operates only on structured
questionnaires, exclusively recognising manually
filled check boxes. Nonetheless, we intend to include
a handwriting recognition component in the future,
allowing for the digitisation of less structured ques-
tionnaires containing handwritten sections. Thanks to
the collaboration with CPS “Giovani di Niguarda” we
will test the effectiveness of this solution on a wider
number of administrations, further expanding its ap-
plicability and assessing its performance.
This solution will be integrated into a proprietary
digital platform designed to oversee the comprehen-
sive management of psychiatric and psychological pa-
tient treatment courses. Although the digital platform
won’t be open-source, the PANTHER tool is publicly
available for further research and to be freely inte-
grated into other solutions.
REFERENCES
Alzubaidi, L., Zhang, J., Humaidi, A. J., Al-Dujaili, A.,
Duan, Y., Al-Shamma, O., Santamar
´
ıa, J., Fadhel,
M. A., Al-Amidie, M., and Farhan, L. (2021). Re-
view of deep learning: Concepts, cnn architectures,
challenges, applications, future directions. Journal of
big Data, 8:1–74.
American Psychiatric Association (2000). Manuale diag-
nostico e statistico dei disturbi mentali, chapter Valu-
tazione Multiassiale. Masson, 4th edition. text rev.
Basha, S. S., Dubey, S. R., Pulabaigari, V., and Mukherjee,
S. (2020). Impact of fully connected layers on per-
formance of convolutional neural networks for image
classification. Neurocomputing, 378:112–119.
Biau, G. and Scornet, E. (2016). A random forest guided
tour. Test, 25:197–227.
Browne, M. W. (2000). Cross-validation methods. Journal
of mathematical psychology, 44(1):108–132.
Butcher, J. N., Perry, J. N., and Atlis, M. M. (2000). Valid-
ity and utility of computer-based test interpretation.
Psychological assessment, 12(1):6.
Cao, H. and Govindaraju, V. (2007). Vector model based
indexing and retrieval of handwritten medical forms.
In Ninth International Conference on Document Anal-
ysis and Recognition (ICDAR 2007), volume 1, pages
88–92. IEEE.
Chabert, C., Collado, A., Cheval, B., and Hue, O. (2021).
and-pencil questionnaires analysis: a new automated
technique to reduce analysis time and errors. bioRxiv,
pages 2021–03.
Coons, S. J., Gwaltney, C. J., Hays, R. D., Lundy, J. J.,
Sloan, J. A., Revicki, D. A., Lenderking, W. R.,
Cella, D., and Basch, E. (2009). Recommendations
on evidence needed to support measurement equiv-
alence between electronic and paper-based patient-
reported outcome (pro) measures: Ispor epro good re-
search practices task force report. Value in Health,
12(4):419–429.
Deng, J., Dong, W., Socher, R., Li, L.-J., Li, K., and Fei-
Fei, L. (2009). Imagenet: A large-scale hierarchical
image database. In 2009 IEEE conference on com-
puter vision and pattern recognition, pages 248–255.
Ieee.
Du, X., Sun, Y., Song, Y., Sun, H., and Yang, L. (2023). A
comparative study of different cnn models and transfer
learning effect for underwater object classification in
side-scan sonar images. Remote Sensing, 15(3):593.
Engan, H., Hilmarsen, C., Sittlinger, S., Sandmæl, J. A.,
Skanke, F., and Oldervoll, L. M. (2016). Are web-
based questionnaires accepted in patients attending re-
habilitation? Disability and Rehabilitation, 38:2406–
2412.
Franke, G. H. (1997). ”the whole is more than the sum of its
parts”: the effects of grouping and randomizing items
on the reliability and validity of questionnaires. Euro-
pean Journal of Psychological Assessment, 13:67–74.
Groth-Marnat, G. (1999). Current status and future direc-
tions of psychological assessment: Introduction. Jour-
nal of Clinical Psychology, 55(7):781–785.
He, K., Zhang, X., Ren, S., and Sun, J. (2016). Deep resid-
ual learning for image recognition. In Proceedings of
the IEEE conference on computer vision and pattern
recognition, pages 770–778.
Holl
¨
andare, F., Andersson, G., Engstr
¨
om, I., et al. (2010). A
comparison of psychometric properties between inter-
net and paper versions of two depression instruments
(bdi-ii and madrs-s) administered to clinic patients.
Journal of medical Internet research, 12(5):e1392.
Lanyon, R. I. (2011). Handbook of psychological assess-
ment, gary groth-marnat, wiley, new york (2009), 752
pp.
Lorenzo, P., Silvia, A., Federica, P., Sara, G., Ilaria, S.,
Pupo, S., and Raballo, A. (2018). The italian ver-
sion of the 16-item prodromal questionnaire (ipq-16):
Field-test and psychometric features. Schizophrenia
Research, 199:353–360.
Maniar, S., Parmani, J., Bodke, M., and Saxena, K. (2021).
Generation and grading of arduous mcqs using nlp
ICT4AWE 2024 - 10th International Conference on Information and Communication Technologies for Ageing Well and e-Health
150

and omr detection using opencv. In 2021 12th Inter-
national Conference on Computing Communication
and Networking Technologies (ICCCNT), pages 1–7.
IEEE.
Martin-Key, N. A., Spadaro, B., Funnell, E., Barker, E. J.,
Schei, T. S., Tomasik, J., and Bahn, S. (2022). The
current state and validity of digital assessment tools
for psychiatry: systematic review. JMIR Mental
Health, 9(3):e32824.
McMinn, M. R., Buchanan, T., Ellens, B. M., and Ryan,
M. K. (1999). Technology, professional practice, and
ethics: Survey findings and implications. Professional
Psychology: Research and Practice, 30(2):165.
Meneghelli, A., Alpi, A., Cascio, M., H
¨
afner, H., Maurer,
K., Preti, A., Raballo, A., and Cocchi, A. (2013). Ver-
sione italiana dell’early recognition inventory for the
retrospective assessment of the onset of schizophrenia
checklist: affidabilit
`
a, validit
`
a e istruzioni per l’uso.
Journal of Psychopathology, 19:1–2.
Michielin, P., Bertolotti, G., Sanavio, E., Vidotto, G., and
Zotti, A. M. (2009). Manuale d’uso del cba-ve test per
valutare l’efficacia nella pratica dei trattamenti psico-
logici e psicoterapeutici. Professione Psicologi, 3:8–
11.
Noble, W. S. (2006). What is a support vector machine?
Nature biotechnology, 24(12):1565–1567.
Norbert, G., Stoicu-Tivadar, V., and Emanuela, G. (2023).
Robotic process automation based data extraction
from handwritten medical forms. In Telehealth
Ecosystems in Practice: Proceedings of the EFMI
Special Topic Conference 2023, volume 309, page 68.
IOS Press.
O’Shea, K. and Nash, R. (2015). An introduction
to convolutional neural networks. arXiv preprint
arXiv:1511.08458.
Patel, N. V., Prajapati, G. I., and SVMIT, B. (2015). Var-
ious techniques for assessment of omr sheets through
ordinary 2d scanner: a survey. International Journal
of Engineering Research & Technology (IJERT) Vol,
4:2278–0181.
Paulsen, A., Overgaard, S., and Lauritsen, J. M. (2012).
Quality of data entry using single entry, double entry
and automated forms processing–an example based
on a study of patient-reported outcomes. PloS one,
7(4):e35087.
Sanguansat, P. (2015). Robust and low-cost optical
mark recognition for automated data entry. In 2015
12th International Conference on Electrical Engi-
neering/Electronics, Computer, Telecommunications
and Information Technology (ECTI-CON), pages 1–5.
IEEE.
Seward, R. J., Bayliss, D. M., Stallman, H. M., and Ohan,
J. L. (2018). Psychometric properties and norms for
the strengths and difficulties questionnaire adminis-
tered online in an australian sample. Australian Psy-
chologist, 53:116–124.
Simons, R., Goddard, R., and Patton, W. (2002). Hand-
scoring error rates in psychological testing. Assess-
ment, 9(3):292–300.
Simonyan, K. and Zisserman, A. (2014). Very deep con-
volutional networks for large-scale image recognition.
arXiv preprint arXiv:1409.1556.
Szegedy, C., Liu, W., Jia, Y., Sermanet, P., Reed, S.,
Anguelov, D., Erhan, D., Vanhoucke, V., and Rabi-
novich, A. (2015). Going deeper with convolutions.
In Proceedings of the IEEE conference on computer
vision and pattern recognition, pages 1–9.
Tolley, C., Rofail, D., Gater, A., and Lalonde, J. (2015). The
feasibility of using electronic clinical outcome assess-
ments in people with schizophrenia and their infor-
mal caregivers. Patient Related Outcome Measures,
page 91.
Touvier, M., M
´
ejean, C., Kesse-Guyot, E., Pollet, C.,
Malon, A., Castetbon, K., and Herc¸berg, S. (2010).
Comparison between web-based and paper versions
of a self-administered anthropometric questionnaire.
European Journal of Epidemiology, 25:287–296.
van Ballegooijen, W., Riper, H., Cuijpers, P., van Oppen, P.,
and Smit, J. H. (2016). Validation of online psycho-
metric instruments for common mental health disor-
ders: a systematic review. BMC psychiatry, 16:1–12.
Watkins, C. E., Campbell, V. L., Nieberding, R., and Hall-
mark, R. (1995). Contemporary practice of psycho-
logical assessment by clinical psychologists. Profes-
sional psychology: Research and practice, 26(1):54.
Yasmin, F., Hossain, S. M. M., and Arefin, M. S. (2017).
Apsd: a framework for automated processing of sur-
vey documents. In 2017 International Conference on
Electrical, Computer and Communication Engineer-
ing (ECCE), pages 411–416. IEEE.
Zaryab, M. A. and Ng, C. R. (2023). Optical character
recognition for medical records digitization with deep
learning. In 2023 IEEE International Conference on
Image Processing (ICIP), pages 3260–3263. IEEE.
A Neural Network for Automatic Handwriting Extraction and Recognition in Psychodiagnostic Questionnaires
151
