
Univariate GARCH Model for Futures Option Pricing: Application to
Silver Mini Futures in Indian Commodity Market
S Sapna
a
and Biju R Mohan
b
Department of Information Technology, National Institute of Technology Karnataka, Surathkal, Karnataka, India
Keywords:
Black-76 Model, GARCH, Option Pricing, Commodity Futures, Monte Carlo Simulation, Volatility.
Abstract:
This research investigates the pricing of options related to silver commodity futures within the Indian market,
employing a standard univariate Generalized Autoregressive Conditional Heteroscedastic (GARCH) model
with a symmetric normal distribution for return modelling. The study evaluates the performance of this option
pricing model specifically for silver mini futures options traded on the Multi Commodity Exchange. Further-
more, it compares the option prices determined using the GARCH model parameters with those calculated
using the Black-76 model. The findings demonstrate that the option prices derived from the GARCH model
fall consistently within the bid-ask price range and significantly outperform the Black-76 model in terms of
option pricing accuracy. This underscores the practical utility of GARCH models in the context of the Indian
commodity market. To the best of our knowledge, this research marks the pioneering attempt to incorporate
parameters generated by the GARCH model for futures option pricing within the Indian commodity market.
1 INTRODUCTION
Commodity markets play a vital role in the global
economy by providing a means for investors to mit-
igate risks and safeguard the long-term value of their
assets. This market holds particular significance for
manufacturing nations, given that these nations heav-
ily rely on a stable and efficient supply of raw ma-
terials, like metals, energy resources and agricultural
products to sustain their industrial production pro-
cesses. The Indian commodity market encompasses
the trading of various commodities, including agri-
cultural commodities market, bullion market, energy
market, and base metal market (AngelOne, 2023).
In India, where the manufacturing sector contributes
approximately 16–17% to the GDP, the demand for
metals has surged alongside the growth of manufac-
turing industries (Kakade et al., 2022). With a his-
tory spanning centuries, the Indian commodity mar-
ket has undergone significant growth and is currently
one of the fastest-growing markets globally. Regula-
tory oversight of the commodity market, which was
formerly handled by the Forward Markets Commis-
sion (FMC) (Masood and Chary, 2016), had been
merged with the Securities and Exchange Board of
a
https://orcid.org/0000-0001-5773-5583
b
https://orcid.org/0000-0002-3928-8924
India (SEBI) in 2015. As a result, the SEBI now
oversees the commodity derivatives market in India
(Dubey and Shankar, 2020).
Commodity trading in India occurs on organized
exchanges, like Multi Commodity Exchange of In-
dia and the National Commodity and Derivatives
Exchange, where futures and options contracts are
traded (Hariharan and Reddy, 2018). Participants in
the Indian commodity market include producers, pro-
cessors, traders, speculators, and hedgers. With its ca-
pacity for price discovery and risk management, the
Indian commodity market holds significant potential
for the agricultural, energy, and metal sectors, mak-
ing it an integral component of the Indian economy
(Pani et al., 2022).
The commodity derivatives market has seen sub-
stantial growth, highlighting the rising significance
of commodities in global financial markets (Dwyer
et al., 2011). In India, the commodity options market
has become a crucial component of the commodity
derivatives market, attracting more participants who
utilize options for price risk management (Govin-
dasamy, 2019) and speculative trading on commodity
prices. This growth emphasizes the increasing impor-
tance of commodity derivatives as both risk manage-
ment tools and investment opportunities.
Gold and silver options, as well as energy options
based on crude oil and natural gas, are typically the
Sapna, S. and Mohan, B.
Univariate GARCH Model for Futures Option Pricing: Application to Silver Mini Futures in Indian Commodity Market.
DOI: 10.5220/0012587900003708
Paper published under CC license (CC BY-NC-ND 4.0)
In Proceedings of the 9th International Conference on Complexity, Future Information Systems and Risk (COMPLEXIS 2024), pages 43-53
ISBN: 978-989-758-698-9; ISSN: 2184-5034
Proceedings Copyright © 2024 by SCITEPRESS – Science and Technology Publications, Lda.
43

most actively traded option contracts in the Indian
commodity market (IIFLSecurities, 2023). This is
primarily due to the significant size and volatility of
the bullion and energy markets, which create a de-
mand for risk management tools like options. Bul-
lion commodity options pertain to options contracts
based on the price of precious metals, such as gold
and silver, which are widely traded on commodity ex-
changes globally (Bullion, 2023). These options pro-
vide the holder with the right, but not the obligation,
to buy or sell a specific quantity of bullion or bullion
futures at a predetermined price (strike price) within
a specified timeframe (Commodity, 2023).
In India, metals possess significant strategic and
economic importance, representing a vital and quan-
tifiable element of economic development. They play
a crucial role as primary raw materials for a diverse
range of essential industries, deeply influencing eco-
nomic growth (Kakade et al., 2022). Silver is one
of the most actively traded commodities in the Indian
market due its unique characteristics and wide range
of applications including industrial demand and lever-
aging capability. In this paper, we focus on pricing sil-
ver mini commodity futures options in the Indian mar-
ket using the univariate Generalized Auto-Regressive
Conditional Heteroscedastic (GARCH) model. The
GARCH model is calibrated using historical silver
returns data, and Monte Carlo simulation is used to
price the futures options. The model’s pricing perfor-
mance is contrasted with that of the Black-76 model,
a flexible framework for valuing futures options. The
primary focus of this research is to understand how
well the GARCH model captures the time-varying na-
ture of volatility in the commodity market. GARCH
models are known for their ability to adapt to chang-
ing market conditions, reflecting periods of height-
ened and subdued volatility. This work aims to inves-
tigate whether this dynamic representation of volatil-
ity provides a more accurate depiction of the under-
lying risk factors influencing commodity futures op-
tions compared to the constant volatility assumption
in the Black-76 model. To the best of our knowledge,
this study represents a pioneering approach to incor-
porate GARCH model-derived parameters for option
pricing in the Indian commodity market.
The remainder of the paper is structured as fol-
lows: Section 2 presents the literature review re-
lated to commodity option pricing, Section 3 presents
the detailed methodology employed for pricing op-
tions using GARCH model-generated parameters,
Section 4 presents the analysis on the performance of
GARCH option pricing model and Black-76 model
in pricing silver mini futures options and Section 5
presents the conclusion and scope for future research.
2 LITERATURE REVIEW
Several parametric models are made available to price
options, with Black-Scholes model being the most
used (Sapna and Mohan, 2023; Luo et al., 2022;
Sapna and Mohan, 2022). However, the assumption
of constant volatility in the Black-Scholes model does
not accurately capture real-world dynamics where
volatility is dynamic and unpredictable. Stochastic
volatility models and GARCH models address this
issue by allowing for time-varying volatility, with
GARCH models focusing on conditional variance
modelling and stochastic volatility models incorporat-
ing random changes in volatility over time. Consid-
ering the significance of India’s commodity market, it
becomes imperative to comprehend the ever-changing
volatility dynamics in order to develop a robust under-
standing of the market’s inherent risk. These volatil-
ity models, often combined with Monte Carlo Simu-
lation, have proven effective in pricing options.
(Berhane et al., 2019) priced Ethiopian commod-
ity options (Coffee and Sesame seeds) using a jump
diffusion process. Model parameters were estimated
using maximum likelihood estimation, and pricing
was done using Monte Carlo simulation. The dou-
ble exponential jump diffusion model was found to
be the most suitable. (Hou et al., 2020) explored Bit-
coin’s stochastic properties using a stochastic volatil-
ity with correlated jump model and priced Bitcoin op-
tions based on these properties. They emphasized the
inclusion of jumps in volatility and returns for accu-
rate pricing and observed a negative correlation be-
tween jumps in volatility and returns.
(Srivastava and Shastri, 2020) examined the suit-
ability of the Black-Scholes model in the Indian Cap-
ital Markets using ten popular stocks listed on the
National Stock Exchange. The study compared the
option prices obtained from the Black-Scholes model
with the actual option prices and found a significant
mispricing. (Venter et al., 2020) examined the ef-
fectiveness of the univariate GARCH model in pric-
ing Bitcoin options and observed that the predicted
market price fell within the bid and ask price lim-
its of the option. (Venter and Mar
´
e, 2021) used the
Heston-Nandi model to price Bitcoin-based Options
on Futures. They also introduced a method for pric-
ing multivariate Bitcoin Spread Options. The sym-
metric Heston-Nandi model was determined to be the
most suitable for pricing options on futures. (Ven-
ter and Mar
´
e, 2022) examined the suitability of the
GARCH model for pricing Volatility Index options.
The symmetric GARCH (1,1) model with skewed
Student-t distribution demonstrated the best perfor-
mance. (Venter et al., 2022) examined the impact of
COMPLEXIS 2024 - 9th International Conference on Complexity, Future Information Systems and Risk
44

symmetric and asymmetric GARCH models on the
pricing of collateralized and non-collateral options in
the South African market. The study revealed that the
asymmetric GARCH model had a greater influence
on the option price for longer expiration periods. The
literature presents consistent findings on the effec-
tiveness of parametric models, particularly GARCH
models, in option pricing.
Although options trading has been present in In-
dia for more than 15 years, the introduction of com-
modity options in 2017 was driven by the increasing
volatility of commodity prices (Options, 2023). How-
ever, there is limited exploration of commodity op-
tion pricing in the Indian market, creating opportu-
nities for further investigation using both parametric
and non-parametric models. Existing literature fre-
quently employs the Duan model for pricing options
based on spot prices or volatility indices (Venter et al.,
2020; Duan, 1995; Venter and Mar
´
e, 2020). This re-
search focuses on assessing the applicability of the
Duan Model specifically for pricing futures options
in the Indian commodity market. The study evaluates
the Duan model’s ability to capture volatility skew
in the Indian commodity derivatives market and pro-
vides insights into the accuracy of its pricing predic-
tions. The findings can benefit investors and traders
engaged in futures options trading by informing their
pricing and hedging strategies. Moreover, the results
can potentially contribute to the ongoing development
and refinement of options pricing models, a crucial
area of research in finance and economics.
2.1 Contributions of the Proposed Work
• Duan model is a well known GARCH model used
to perform volatility estimation and option pric-
ing. This model has been used effectively to price
options based on spot market. However, the ap-
plicability of Duan Model in the Futures Options
market is yet to be evaluated. The major contri-
bution made by this research work is to test the
applicability of Duan Model for the pricing of Fu-
tures Options in the Indian commodity market.
• This work evaluates the effectiveness of the Duan
model in capturing the volatility skew in the In-
dian commodity derivatives market and provide
insights into the accuracy of the model’s pricing
predictions.
• This work compares the performance of the pro-
posed model and the traditional Black-76 model
with respect to their pricing performance to deter-
mine which model aligns well with the observed
market behavior and is more suitable for real-
world applications.
3 METHODOLOGY
3.1 Black-76 Model
The Black-76 model, also known as the Black model
or Black-Scholes model for futures options, is an op-
tion pricing model used to determine the theoreti-
cal value of European-style options on futures con-
tracts. It is an extension of the Black-Scholes model,
which is primarily used for pricing European-style
options on stocks. This model determines the op-
tion price based on the following parameters: Futures
Price (F) which represents the current market price
of the futures contract, Strike Price (K) which rep-
resents the price at which the option holder has the
right to buy (for a call option) or sell (for a put op-
tion) the underlying futures contract, Time to Expira-
tion (T) which indicates the remaining time until the
option’s expiration, risk-free interest rate (r) which in-
dicates the continuously compounded interest rate for
the time to expiration of the option. The Black-76
model assumes that the underlying futures contract
follows geometric Brownian motion and that option
prices are normally distributed. It is widely used in
financial markets for pricing options on futures con-
tracts and provides a theoretical framework for valu-
ing these derivatives (Clark, 2014). However, it as-
sumes constant volatility throughout the option’s life,
which may not always reflect real-world market con-
ditions (Jankov
´
a, 2018). Equation (1)-(3) represents
the Black-76 formula to compute the price of call/put
(C/P) futures option with δ = 1 representing call op-
tion, δ = −1 representing put option and N(.) repre-
sents cumulative normal distribution.
V
C/P
= δe
−rT
[FN(δd
1
) −KN(δd
2
)] (1)
d
1
=
ln
F
K
+
σ
2
2
T
σ
√
T
(2)
d
2
=
ln
F
K
−
σ
2
2
T
σ
√
T
(3)
3.2 Univariate GARCH(1,1) Model
GARCH model is a statistical framework used to an-
alyze and model the volatility of financial time series
data. Developed as an extension of the ARCH model,
GARCH introduces a more flexible and generalized
approach to capturing time-varying volatility (Boller-
slev, 1987). The model accounts for the conditional
variance of the data, allowing it to adapt to chang-
ing market conditions. GARCH models are widely
employed in finance to forecast and understand the
persistence of volatility, making them valuable tools
Univariate GARCH Model for Futures Option Pricing: Application to Silver Mini Futures in Indian Commodity Market
45
for risk management, option pricing, and portfolio
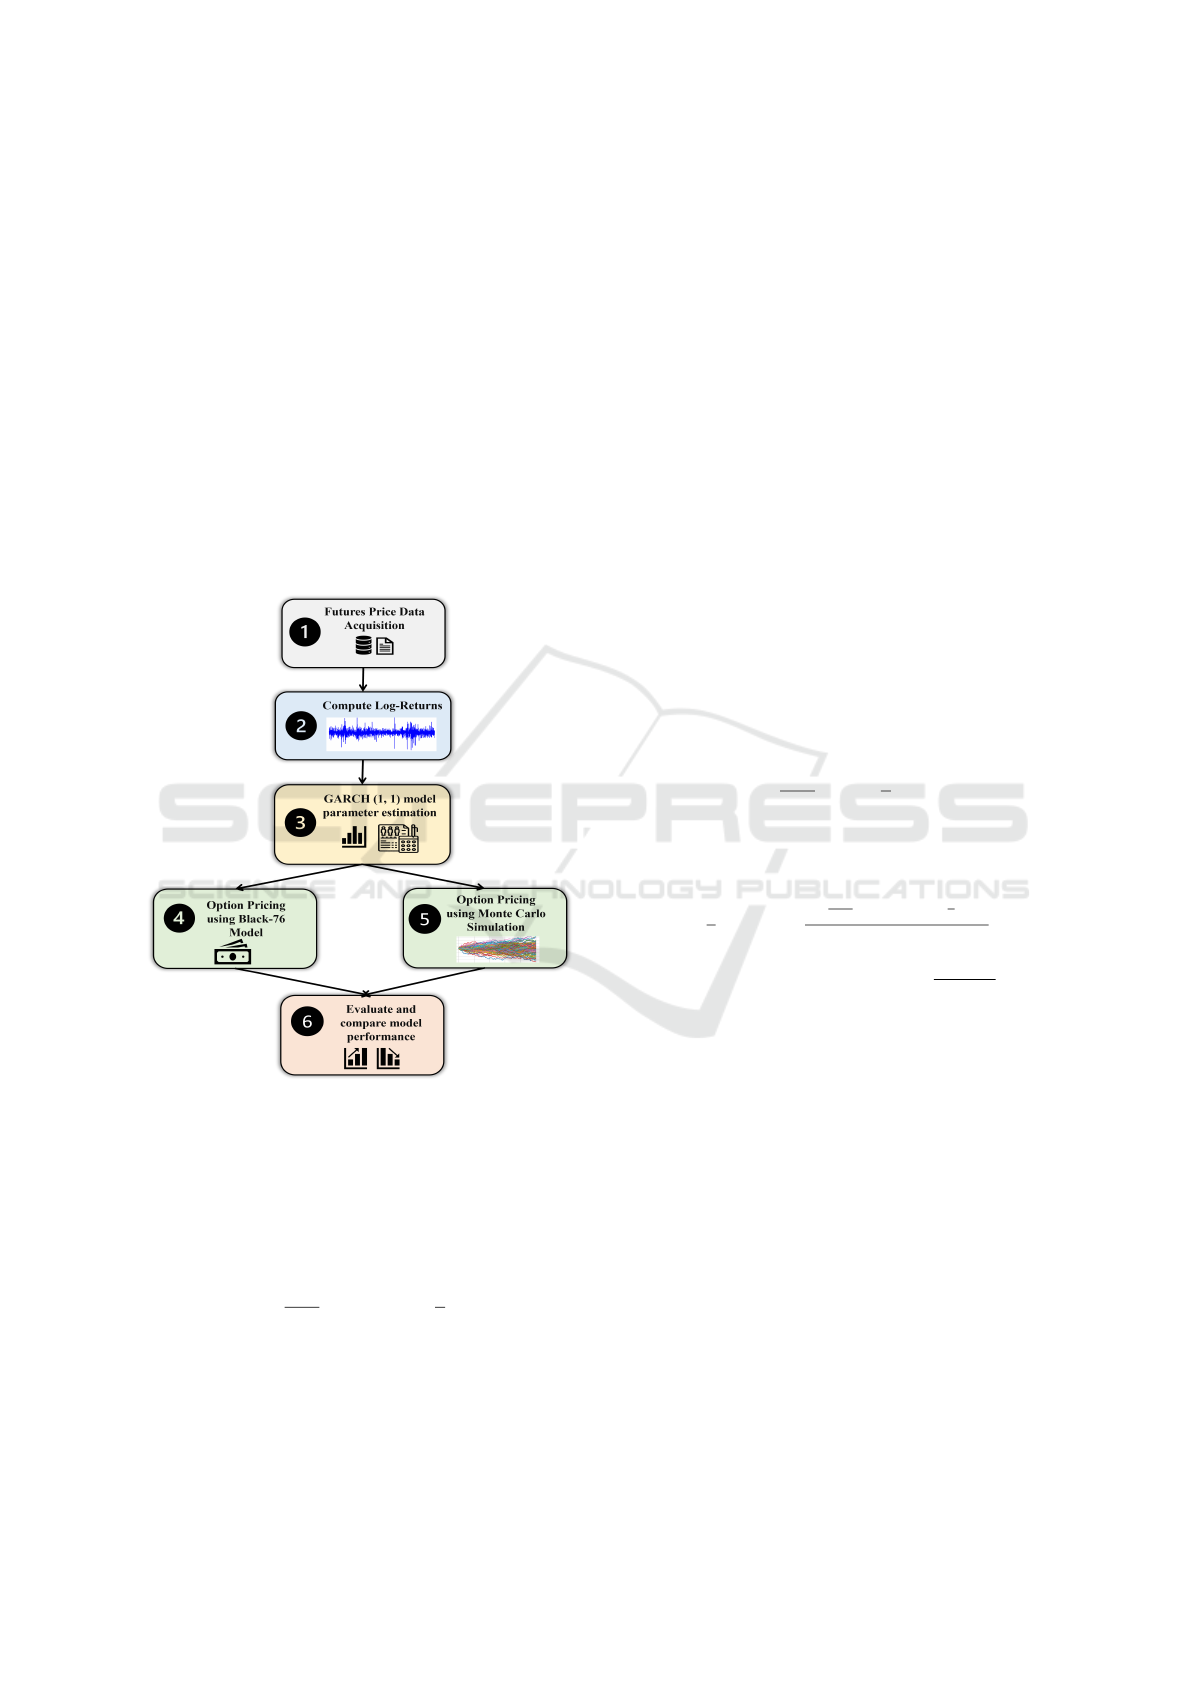
optimization. In this work, a GARCH model-based
parametric approach has been employed to develop
a model for pricing commodity futures options by
explicitly modelling the fluctuations in the commod-
ity futures price. The behaviour of the futures price
movement is captured by fitting a model to the log-
returns of the commodity futures price. Maximum
Likelihood Estimation is used to determine the pa-
rameters of the model. A variety of GARCH models
is considered with different error distributions to rep-
resent conditional variance. The model that fits best
to the available data is chosen to represent the futures
price process. Finally, the approximate value of the
option is determined by simulating future paths using
Monte Carlo Simulation. The architecture diagram
for pricing of Futures Options is shown in Figure 1.
Figure 1: General architecture diagram for pricing silver
mini futures options.
In this study, the log-returns of the Silver Mini
Futures are modelled using the Duan model (Duan,
1995) for GARCH option pricing with dynamics of
the underlying asset under real-world measure repre-
sented by Equation (4).
R
t
≡ ln(
F
t
F
t−1
) = r + λσ
t
−
1
2
σ
2
t
+ ε
t
(4)
where F
t
represents the future price of the com-
modity at time t, r is the risk-free interest rate consid-
ered with continuous compounding, λ is the constant
unit risk premium, σ
2
t
represents the conditional vari-
ance driven by a GARCH process represents the error
term, ε
t
represents the error term, i.e., ε
t
∼ N(0,σ
2
t
),
following a symmetric normal distribution.
GARCH models are widely used in finance and
economics due to its ability to capture the time-
varying volatility in financial data, where the volatil-
ity is modelled as a function of past returns and past
residuals. In this study, GARCH (1, 1) model is con-
sidered to model the conditional variance as given by
Equation (5), where σ
2
t
is the conditional variance of
the return series at time t, ω is a constant, α is the au-
toregressive coefficient, and β is the moving average
coefficient.
σ
2
t
= ω + αε
2
t−1
+ βσ
2
t−1
(5)
It is well known that the price of the contingent
claim is computed as the expected value of discounted
payoff considered under risk-neutral measure (Oost-
erlee and Grzelak, 2019). However, Equation (4)
and Equation (5) provides the representation for log-
returns and conditional variance under the real-world
measure. Thus, the GARCH dynamics for log-returns
and conditional variance under risk-neutral measure is
given by Equation (6) and Equation (7) respectively as
suggested in (Duan, 1995).
R
t
≡ ln(
F
t
F
t−1
) = r −
1
2
σ
2
t
+ ε
t
(6)
σ
2
t
= ω + α(e
t−1
−λσ
t−1
)
2
+ βσ
2
t−1
(7)
lnL = −
1
2
N
∑
t=1
(lnσ
2
t
+
[ln
F
t
F
t−1
−r −λσ
t
+
1
2
σ
2
t
]
2
σ
2
t
)
−
N ln(2π)
2
(8)
The GARCH model parameters are estimated us-
ing maximum likelihood estimation as given in Equa-
tion (8). Given the estimated parameters, different re-
alization of the Silver Mini Future price can be sim-
ulated with Monte Carlo Simulation using the Equa-
tion (6) and Equation (7), and the price of the call
and put Options can be computed across the multiple
realizations using Equation (9) and Equation (10) re-
spectively, where T −t
0
indicates the time to maturity,
F
T
indicates the underlying asset price at expiry and
K indicates the strike price. The algorithm followed
for Monte Carlo Simulation is described in Algorithm
1.
V
call
= e
−r(T −t
0
)
E
Q
[max(F
T
−K, 0)] (9)
V
put
= e
−r(T −t
0
)
E
Q
[max(K −F
T
,0)] (10)
COMPLEXIS 2024 - 9th International Conference on Complexity, Future Information Systems and Risk
46
Algorithm 1: Monte Carlo simulation-based option
pricing.
Data: F – Current futures price, K – strike
price, r – rate of interest, T – time to
expiry
Result: V(t
0
,F) - Price of the option
1 Partition the time interval [0, T], 0 =
t
0
< t
1
<...< t
m
= T where T represents the
time to maturity;
2 Generate asset values, f
k, j
, taking the
risk-neutral dynamics of the underlying
model with k representing time points and j
representing Monte Carlo path;
3 Compute the N payoff values, V
j
, where
V
j
= V (T, f
m, j
), for all Monte Carlo paths;
• Payoff for call option is calculated as
V
j
= max(F
T
−K, 0)
• Payoff for put option is calculated as
V
j
= max(K −F
T
,0)
4 Compute the average as
E
Q
[V (T,F) | F (t
0
)] ≈
1
N
∑
N
j=1
V
j
= V
N
;
5 Compute the option value as
V (t
0
,F) ≈ e
−r(T −t
0
)
V
N
;
Table 1: Descriptive statistics of log-returns.
Measure Value
Mean 9.255361 x 10
−5
Maximum 0.09388484
Minimum -0.1182392
Standard Deviation 0.01520359
Skewness -0.2915862
Kurtosis 8.50794
No. of observations 2964
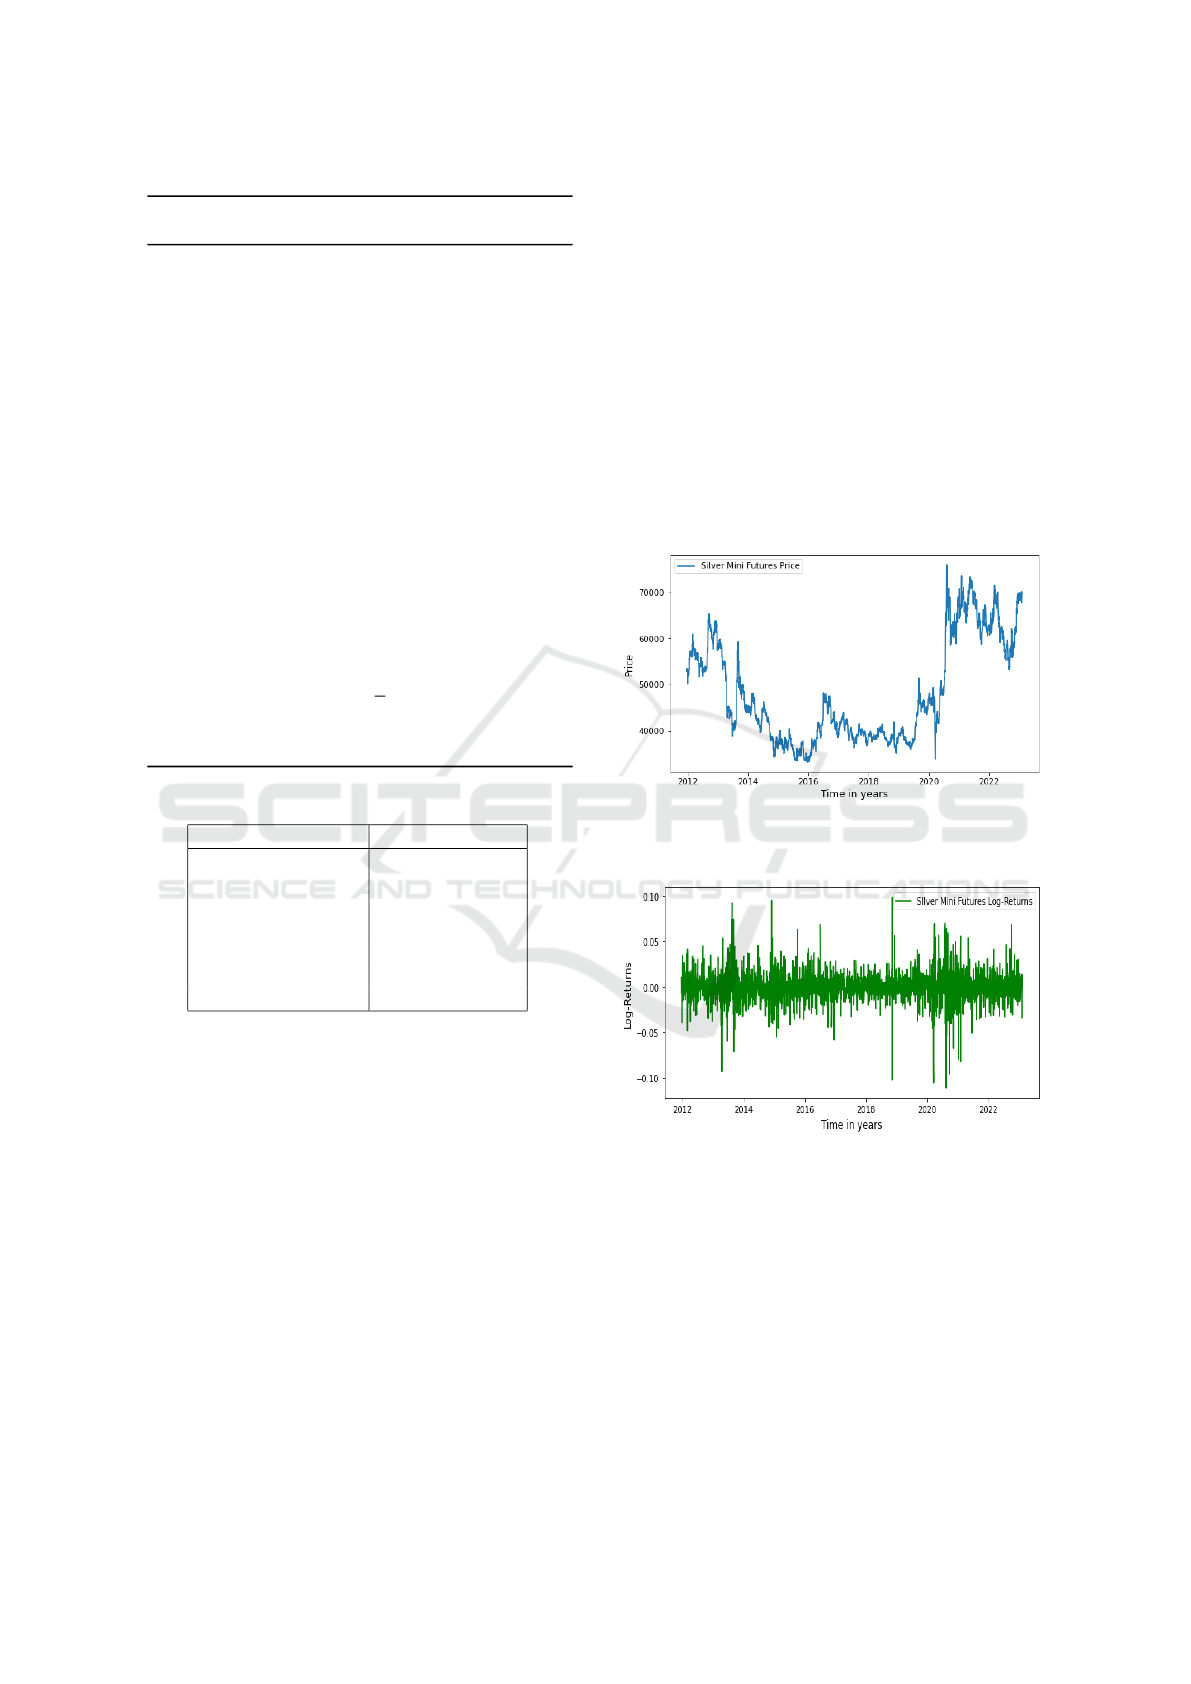
4 RESULTS AND DISCUSSION
In this paper, silver mini options on futures expiring
on 17 February 2023 are considered for pricing, with
silver mini representing silver traded in lots of 5 kilo-
grams. The historical prices corresponding to Silver
Mini futures is considered to build the model. The
daily close price of Silver Mini Futures is recorded
from 19 December 2011 to 01 February 2023 and
is obtained from (Futures, 2023) which derives data
from Multi Commodity Exchange of India (MCX,
2023). The graph showing the Futures price move-
ment and log-return for Silver Mini from 19 Decem-
ber 2011 to 01 February 2023 is as shown in Figure 2
and Figure 3 respectively. The descriptive statistics
of log-returns of Silver Mini futures price is as shown
in Table 1. As per the descriptive statistics, we can
see that the mean value of futures return is almost
zero representing the stationarity of the time series.
Also, the skewness value indicates that the returns are
slightly negatively skewed, and kurtosis indicates the
leptokurtic nature of the distribution, which is in line
with the stylized facts associated to financial return
series (McNeil et al., 2015). Normal distribution and
skewed Normal distribution were considered to im-
plement the error term in Equation (6). The Akaike
Information criterion (AIC) value for model consid-
ering normal distribution was lower than that when
considering skewed normal distribution. Thus, nor-
mal distribution seemed to be a better fit for the im-
plementation, i.e., ε
t
∼ N(0,σ
2
t
).
Figure 2: Silver Mini futures price movement from 19 De-
cember 2011 to 01 February 2023.
Figure 3: Silver Mini futures price log-returns from 19 De-
cember 2011 to 01 February 2023.
The GARCH model was used with a zero-mean
process, and the parameters ω, α and β were esti-
mated using maximum likelihood estimation under
the real-world measure. The optimal parameter es-
timates can be found in Table 2. The t-test resulted in
a p-value of zero for all parameters, indicating their
statistical significance. These parameter values were
utilized as the initial values to calculate the value of λ
under the risk-neutral measure.
The GARCH (1,1) model parameters were used
Univariate GARCH Model for Futures Option Pricing: Application to Silver Mini Futures in Indian Commodity Market
47

Table 2: GARCH (1, 1) model parameter values.
Parameter Estimate Standard Error t-Value Pr(> |t|)
ω 0.000007 0.000000 14.359 0
α 0.064425 0.004297 14.993 0
β 0.905420 0.005755 157.339 0
Table 3: Performance metrics for call option pricing.
Expiry
Black-76 Model GARCH(1,1) Model
Bid Price Ask Price Bid Price Ask Price
RMSE MAE RMSE MAE RMSE MAE RMSE MAE
12 days 540.26 330.36 597.47 419.24 68.07 62.04 33.25 28.78
8 days 454.47 309.95 513.85 387.46 36.39 34.40 57.88 56.42
6 days 318.60 214.24 380.95 281.84 70.11 64.54 25.72 22.13
2 days 155.21 107.73 196.42 142.32 40.61 38.23 50.22 48.83
Table 4: Performance metrics for put option pricing.
Expiry
Black-76 Model GARCH(1,1) Model
Bid Price Ask Price Bid Price Ask Price
RMSE MAE RMSE MAE RMSE MAE RMSE MAE
12 days 902.94 863.11 995.06 959.49 43.60 40.60 64.91 55.79
8 days 519.60 401.33 590.53 489.56 36.75 33.01 58.22 55.31
6 days 317.45 214.99 394.35 300.41 76.73 70.23 33.70 29.61
2 days 142.93 96.48 185.37 130.04 65.45 61.43 28.05 24.97
to simulate Monte Carlo paths for the Silver Mini
futures price, with the intention of generating a se-
ries of potential future price trajectories based on the
volatility dynamics captured by the model. A total of
10,000 Monte Carlo paths were simulated for experi-
mentation, focusing on futures options expiring on 17
February 2023. An interest rate of 6.42% was consid-
ered from the Reserve Bank of India’s 91-day treasury
bill rate. Option pricing data from various days to
expiry were analyzed to assess the model’s accuracy
in pricing Silver Mini Futures Options. Figure 4 and
Figure 5 display the plot of strike price vs option price
for call options and put options respectively, consid-
ering the option price generated by Black-76 model
as well as GARCH model. It can be clearly seen from
Figure 4 and Figure 5 that option price determined
by GARCH model is very close to the bid and ask
price limits quoted by MCX. Figure 5 display the re-
lationship between strike price and option Price for
call Options and put Options, respectively. The per-
formance of Black-76 model for call and put option
pricing is seen to be the worst when its far from ex-
piry. However, a significant improvement is observed
in its performance near to expiry.
Option pricing performance of the models under
consideration is numerically realised using the Root
Mean Squared Error (RMSE) and Mean Absolute Er-
ror (MAE) since the actual proximity of the ask price
and bid price to the anticipated option price is not
clearly evident in Figure 4 and Figure 5. RMSE mea-
sures the average magnitude of the errors between
predicted values and observed values. MAE is a mea-
sure of the average absolute errors between predicted
and observed values. The equations for RMSE and
MAE are given by Equation (11) and Equation (12)
respectively, where p indicates the model determined
option price, ˆp indicates the bid/ask price and N indi-
cates the number of strike prices considered.
RMSE =
r
1
N
∑
(p − ˆp)
2
(11)
MAE =
1
N
∑
| p − ˆp | (12)
Table 3 compares the performance metrics for bid
and ask prices between the Black-76 model and the
GARCH(1,1) model at different expiry periods for
call options. For the 12-day expiry period, the Black-
76 model exhibits higher RMSE and MAE values
for bid and ask prices compared to the GARCH(1,1)
model. As the expiry period shortens to 8 days,
both models show improvements in performance. The
Black-76 model’s RMSE and MAE values decrease,
indicating enhanced predictive accuracy. However,
the GARCH(1,1) model continues to outperform,
showcasing lower RMSE and MAE for bid and ask
prices. In the 6-day expiry period, the GARCH(1,1)
model significantly outshines the Black-76 model,
COMPLEXIS 2024 - 9th International Conference on Complexity, Future Information Systems and Risk
48
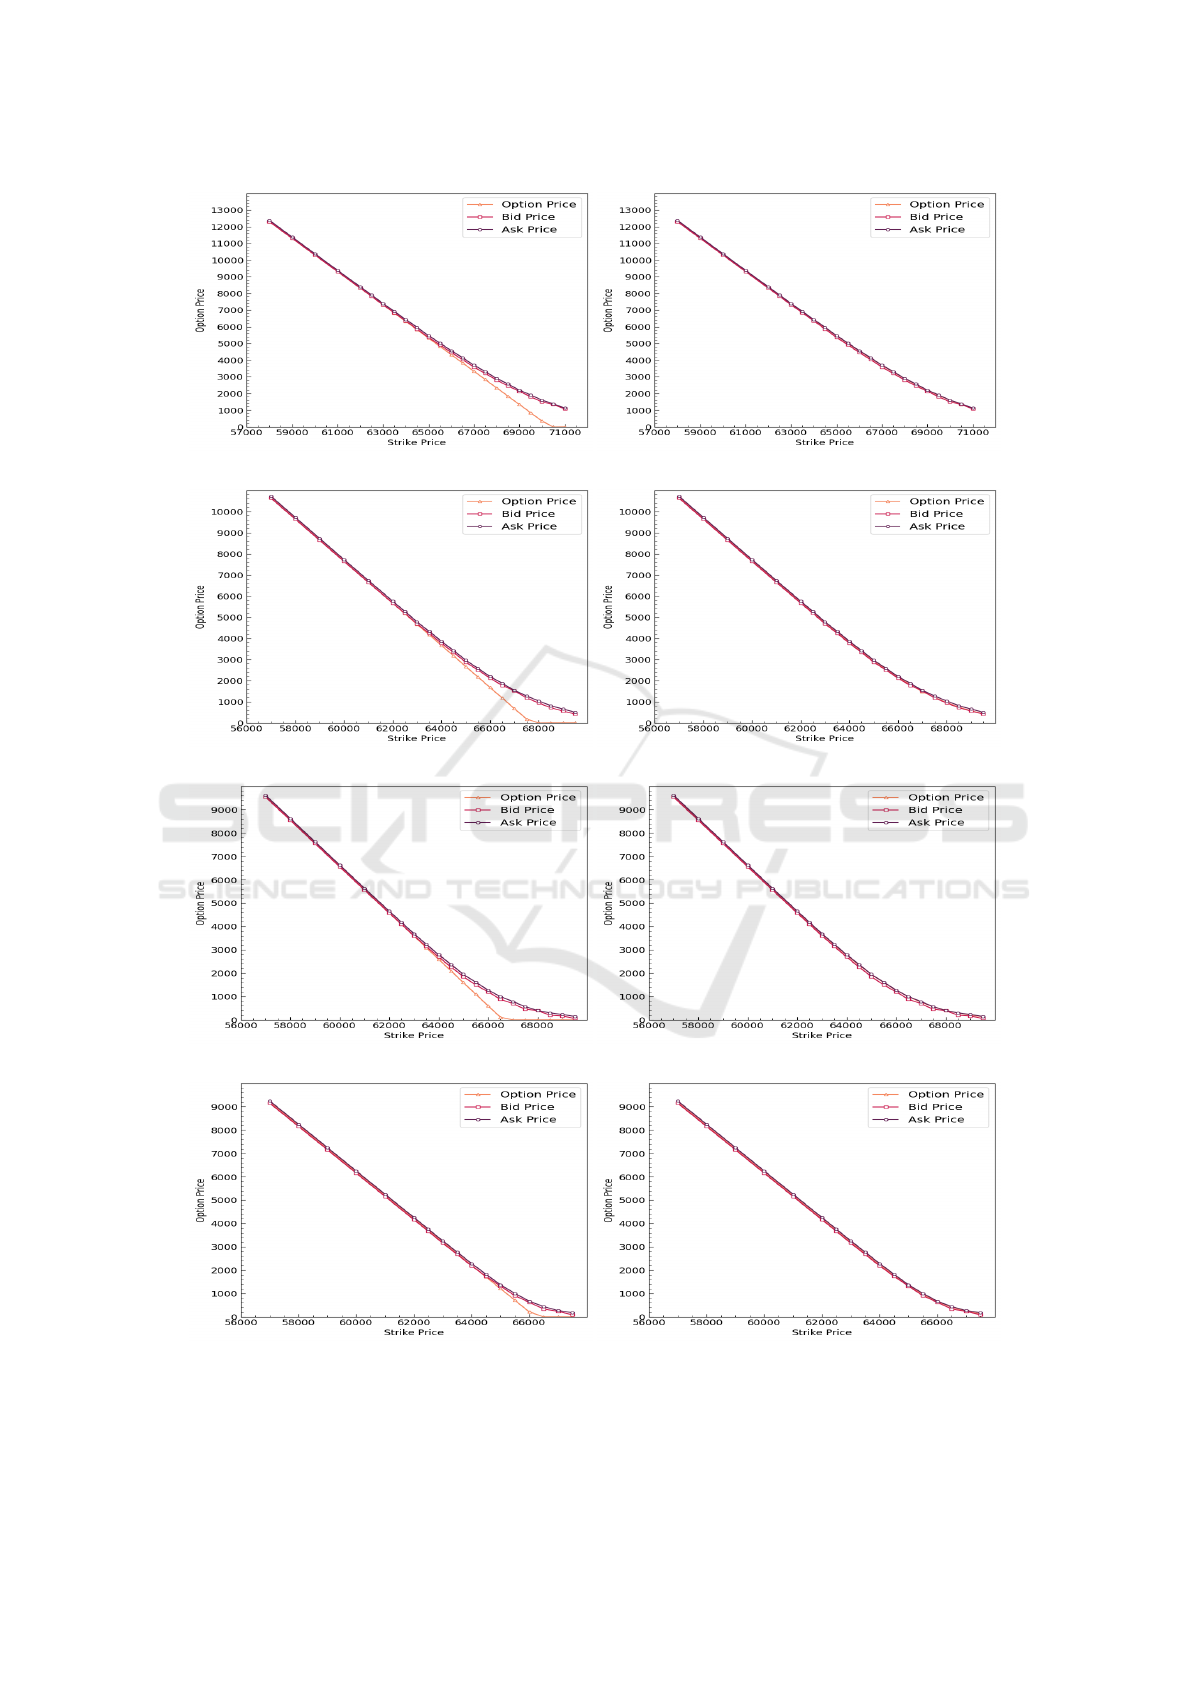
(a) Black-76 model option price - 12 days to expiry. (b) GARCH model option price - 12 days to expiry.
(c) Black-76 model option price - 8 days to expiry. (d) GARCH model option price - 8 days to expiry.
(e) Black-76 model option price - 6 days to expiry. (f) GARCH model option price - 6 days to expiry.
(g) Black-76 model option price - 2 days to expiry. (h) GARCH model option price - 2 days to expiry.
Figure 4: Comparative analysis of call option pricing performance of Black-76 model and GARCH model.
Univariate GARCH Model for Futures Option Pricing: Application to Silver Mini Futures in Indian Commodity Market
49
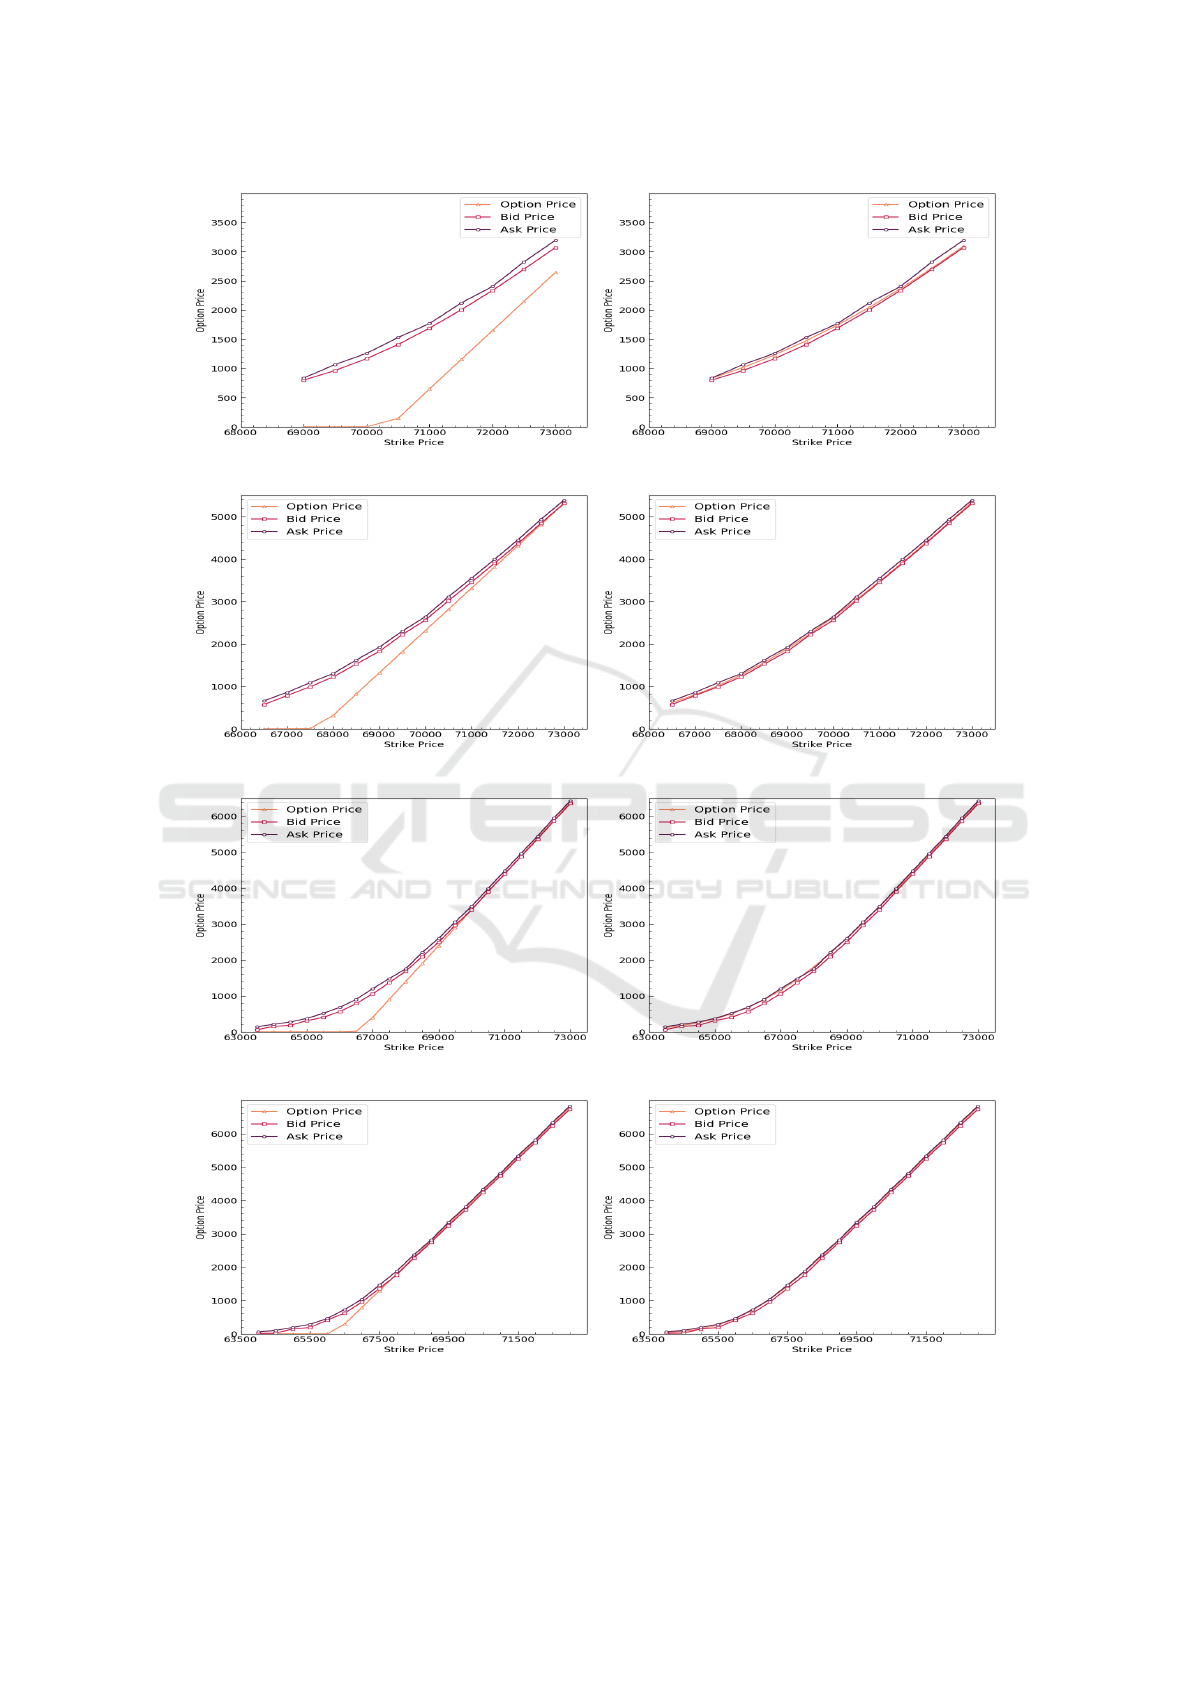
(a) Black-76 model option price - 12 days to expiry. (b) GARCH model option price - 12 days to expiry.
(c) Black-76 model option price - 8 days to expiry. (d) GARCH model option price - 8 days to expiry.
(e) Black-76 model option price - 6 days to expiry. (f) GARCH model option price - 6 days to expiry.
(g) Black-76 model option price - 2 days to expiry. (h) GARCH model option price - 2 days to expiry.
Figure 5: Comparative analysis of put option pricing performance of Black-76 model and GARCH model.
COMPLEXIS 2024 - 9th International Conference on Complexity, Future Information Systems and Risk
50

demonstrating notably lower RMSE and MAE val-
ues for bid and ask prices. For short-term 2-day
expiry, the Black-76 model and the GARCH(1,1)
model show relatively lower RMSE and MAE val-
ues compared to longer expiry periods. In summary,
the GARCH(1,1) model consistently outperforms the
Black-76 model across various expiry periods, espe-
cially excelling in capturing short-term volatility dy-
namics, for call options. Table 4 compares the per-
formance metrics for bid and ask prices between the
Black-76 model and the GARCH(1,1) model at dif-
ferent expiry periods for put options. The trends ob-
served for call options continue for put options in
the 12-day expiry scenario. The GARCH(1,1) model
consistently outperforms the Black-76 model, show-
casing its effectiveness in capturing option pricing
dynamics. Similar to call options, in the 8-day ex-
piry, the GARCH(1,1) model maintains its superi-
ority, providing more accurate predictions compared
to the Black-76 model. As the time to expiry de-
creases to 6 days, the GARCH(1,1) model maintains
its consistent performance, while the Black-76 model
shows larger errors. In the extremely short 2-day ex-
piry, both models show competitive performance for
put options, with the GARCH(1,1) model maintaining
its accuracy advantage. It can be particularly noted
that, for the put options, as the options near matu-
rity, the price of the option approaches the ask price.
In conclusion, the GARCH(1,1) model consistently
demonstrates superior pricing performance compared
to the Black-76 model across various expiry peri-
ods for both call and put options. The GARCH(1,1)
model’s ability to capture short-term dynamics makes
it a robust choice for commodity option pricing in the
Indian market compared to the Black-76 model. The
GARCH model’s superior performance in terms of
lower RMSE and MAE also indicates that it captures
the volatility dynamics of the underlying commodity
prices effectively.
5 CONCLUSIONS
The Indian Commodity Market has undergone signifi-
cant changes in recent years, particularly in commod-
ity derivatives trading. Silver holds a prominent posi-
tion in this market due to its distinct qualities, such as
industrial demand, volatility, diversification benefits,
inflation hedging properties, and leverage opportuni-
ties. This study focuses on pricing silver mini op-
tions on futures utilizing the GARCH(1,1) model. In
this research, we have conducted an analysis of com-
modity option pricing using two widely recognized
models: the Black-Scholes model and the well known
GARCH(1,1) model. Our study aimed to provide in-
sights into the performance and suitability of these
models for option pricing in the context of the Indian
commodity market.
In this work, options on futures were priced by
simulating Monte Carlo paths using the GARCH
model parameters and its performance was also com-
pared with the traditional Black-76 pricing model.
Option pricing performance was tested considering
different maturity periods of the same option until
expiry. It was found that the GARCH model prices
the options relatively well, with model-predicted op-
tion price sandwiched between the bid and ask price
of the option. The closeness of the bid-ask price to
the GARCH option price proves the realistic pricing
performance shown by the GARCH model in option
pricing context. The GARCH model consistently out-
performed the Black-76 model in terms of predictive
accuracy for commodity option pricing in the Indian
commodity market, showing lower RMSE and MAE
values across various expiration periods. The lower
RMSE and MAE values exhibited by the GARCH
model indicated its ability to capture and forecast the
inherent volatility in commodity prices more effec-
tively, making it a valuable tool for option pricing.
The superior performance of the GARCH model in
option pricing can have significant implications for
risk management and investment decision-making in
the commodity market. Investors and market partici-
pants can benefit from more accurate option pricing to
make informed choices and mitigate risks effectively.
Future research can expand on this study by ex-
ploring the performance of these models in different
commodity markets. The findings from the current
study, which focuses on Silver Mini commodity op-
tions, might exhibit variations when applied to diverse
commodities with unique market characteristics. An-
alyzing how the identified models perform across var-
ious commodity markets could unveil insights into the
generalizability and adaptability of GARCH models.
Different commodities, such as agricultural products,
metals, or energy resources, often possess distinct
price dynamics influenced by factors specific to each
market. Evaluating model performance across this
spectrum would provide a more comprehensive view
of their effectiveness. Moreover, commodity markets
are known for their susceptibility to changing eco-
nomic conditions, geopolitical events, and other ex-
ternal factors. Evaluating the robustness of the iden-
tified models across different market conditions, in-
cluding periods of high volatility or economic down-
turns, would contribute valuable insights. This ap-
proach would shed light on the models’ adaptability
and highlight potential areas for improvement.
Univariate GARCH Model for Futures Option Pricing: Application to Silver Mini Futures in Indian Commodity Market
51

Incorporating more advanced modelling tech-
niques represents another avenue for future research.
Exploring cutting-edge modelling techniques, such
as machine learning algorithms or neural networks,
could enhance the precision of option pricing mod-
els in commodity markets. These techniques have
demonstrated success in capturing complex patterns
and nonlinear relationships, potentially providing a
more accurate representation of commodity price dy-
namics. Furthermore, future research could delve
into factors beyond the traditional ones considered in
option pricing models. For instance, incorporating
the impact of jumps in commodity prices, which are
abrupt and significant price movements, could refine
the models’ ability to capture extreme market events.
This expanded scope of research would contribute to
the continuous evolution of option pricing method-
ologies and their applicability in dynamic commodity
markets.
REFERENCES
AngelOne (2023). What are the types of com-
modities traded in the commodity derivatives
market. https://www.angelone.in/knowledge-
center/commodities-trading/what-are-the-types-of-
commodities-traded-in-the-commodity-derivatives-
market [Accessed: 9 Feb 2023].
Berhane, T., Adam, M., and Haile, E. (2019). Option pric-
ing on commodity prices using jump diffusion mod-
els. International Journal of Mathematical Modelling
& Computations, 9(1 (WINTER)):17–37.
Bollerslev, T. (1987). A conditionally heteroskedastic time
series model for speculative prices and rates of return.
The review of economics and statistics, pages 542–
547.
Bullion (2023). Bullion: unparalleled richness.
https://www.mcxindia.com/products/bullion [Ac-
cessed: 9 Feb 2023].
Clark, I. J. (2014). Commodity option pricing: a practi-
tioner’s guide. John Wiley & Sons.
Commodity (2023). Commodity options.
https://www.angelone.in/knowledge-center/futures-
and-options/commodity-trading-option [Accessed: 9
Feb 2023].
Duan, J.-C. (1995). The garch option pricing model. Math-
ematical finance, 5(1):13–32.
Dubey, P. and Shankar, R. (2020). Determinants of the com-
modity futures market performance: an indian per-
spective. South Asia Economic Journal, 21(2):239–
257.
Dwyer, A., Gardner, G., Williams, T., et al. (2011). Global
commodity markets–price volatility and financialisa-
tion. RBA Bulletin, June, pages 49–57.
Futures (2023). Silver mini futures.
https://in.investing.com/commodities/silver-mini-
historical-data [Accessed:15 Feb 2023].
Govindasamy, D. P. (2019). A descriptive study on the re-
cent developments in indian commodity derivatives
market. Research Chronicler Review International
Journal of Multidisciplinary, 7:90–97.
Hariharan, R. and Reddy, K. (2018). A study on indian com-
modity market with special reference to commodity
exchange. Journal of Research Science and Manage-
ment, 5(6):15–21.
Hou, A. J., Wang, W., Chen, C. Y., and H
¨
ardle, W. K.
(2020). Pricing cryptocurrency options. Journal of
Financial Econometrics, 18(2):250–279.
IIFLSecurities (2023). What are the top commodities traded
in india. https://www.indiainfoline.com/knowledge-
center/commodities/what-are-the-top-commodities-
traded-in-india [Accessed: 9 Feb 2023].
Jankov
´
a, Z. (2018). Drawbacks and limitations of black-
scholes model for options pricing. Journal of Finan-
cial Studies and Research, 2018:1–7.
Kakade, K., Mishra, A. K., Ghate, K., and Gupta, S. (2022).
Forecasting commodity market returns volatility: A
hybrid ensemble learning garch-lstm based approach.
Intelligent Systems in Accounting, Finance and Man-
agement, 29(2):103–117.
Luo, Q., Jia, Z., Li, H., and Wu, Y. (2022). Analysis of
parametric and non-parametric option pricing models.
Heliyon, 8(11).
Masood, S. and Chary, T. S. (2016). Performance of com-
modity derivatives market in india. Amity Journal of
Finance, 1(1):131–148.
McNeil, A. J., Frey, R., and Embrechts, P. (2015). Quantita-
tive risk management: concepts, techniques and tools-
revised edition. Princeton university press.
MCX (2023). Mcx india. https://www.mcxindia.com/ [Ac-
cessed:15 Jan 2023].
Oosterlee, C. W. and Grzelak, L. A. (2019). Mathematical
modeling and computation in finance: with exercises
and Python and MATLAB computer codes. World Sci-
entific.
Options (2023). Commodity op-
tions in indian derivative market.
https://www.cnbctv18.com/photos/market/commoditi
es/the-future-options-in-commodities-2892201.htm
[Accessed: 9 Feb 2023].
Pani, U., Gherghina, S¸. C., Mata, M. N., Ferr
˜
ao, J. A., Mata,
P. N., et al. (2022). Does indian commodity futures
markets exhibit price discovery? an empirical analy-
sis. Discrete Dynamics in Nature and Society, 2022.
Sapna, S. and Mohan, B. R. (2022). Estimation of implied
volatility for ethereum options using numerical ap-
proximation methods. In International Conference on
Information Systems and Management Science, pages
541–553. Springer.
Sapna, S. and Mohan, B. R. (2023). Comparative anal-
ysis of root finding algorithms for implied volatility
estimation of ethereum options. Computational Eco-
nomics, pages 1–36.
COMPLEXIS 2024 - 9th International Conference on Complexity, Future Information Systems and Risk
52

Srivastava, A. and Shastri, M. (2020). A study of black–
scholes model’s applicability in indian capital mar-
kets. Paradigm, 24(1):73–92.
Venter, P. J., Levendis, A., and Mare, E. (2022). Collat-
eralised option pricing in a south african context: A
univariate garch approach. Cogent Economics & Fi-
nance, 10(1):2106631.
Venter, P. J. and Mar
´
e, E. (2020). Garch generated volatil-
ity indices of bitcoin and crix. Journal of Risk and
Financial Management, 13(6):121.
Venter, P. J. and Mar
´
e, E. (2021). Univariate and multi-
variate garch models applied to bitcoin futures option
pricing. Journal of Risk and Financial Management,
14(6):261.
Venter, P. J. and Mar
´
e, E. (2022). Price discovery in the
volatility index option market: a univariate garch ap-
proach. Finance Research Letters, 44:102069.
Venter, P. J., Mare, E., and Pindza, E. (2020). Price discov-
ery in the cryptocurrency option market: A univari-
ate garch approach. Cogent Economics & Finance,
8(1):1803524.
Univariate GARCH Model for Futures Option Pricing: Application to Silver Mini Futures in Indian Commodity Market
53
