
Guiding the Adoption of UX Research Practices: An Approach to
Support Software Professionals
Maria Anita de Moura
a
, Su
´
ellen Martinelli
b
and Luciana Zaina
c
Federal University of S
˜
ao Carlos (UFSCar), Sorocaba, S
˜
ao Paulo, Brazil
Keywords:
User Experience, UX, UX Research, UX Methods, Software Professionals, Empirical Study.
Abstract:
The interest in User Experience (UX) with interactive products and services has grown in the industry. In this
context, the research with end-users contributes to articulating practices, methods, and research techniques
on UX that can be applied at different stages of software development. Nevertheless, software development
professionals have demanded tools that can aid them in selecting the suitable method or technique for a given
purpose of user research. To address this demand, we developed guidelines that suggest methods and tech-
niques for working with user experience research. Considering the guidelines, we created the GURiP tool
in the virtual catalog format, providing a more dynamic interaction with the guidelines. We evaluated the
proposal acceptance with 32 software professionals from software startups and established companies. Our
results revealed that professionals of both types of companies showed similar acceptance and reported more
positive than negative feedback about the guidelines. We also found that participants’ profiles, such as years
of experience or affiliation with startups or established companies, did not influence the acceptance of the
guidelines.
1 INTRODUCTION
In recent years, there has been a significant increase
in recognition of challenges associated with integrat-
ing the design of user experience (UX) into software
development (Silveira et al., 2021; Hokkanen and
V
¨
a
¨
an
¨
anen-Vainio-Mattila, 2015; Kashfi et al., 2019).
There are different definitions of UX in the literature;
however, the majority of them include both the soft-
ware’s functionalities and its quality characteristics as
elements perceived by end-users during their inter-
actions (Hassenzahl, 2018). Software professionals
(e.g., developers, UX designers, and UX researchers)
have faced obstacles to incorporating UX into devel-
opment processes, such as a lack of knowledge in
UX and limited availability of resources (Kashfi et al.,
2019; Silveira et al., 2021). Besides, studies indicate
that the adoption of UX practices is fundamental in all
stages of software development (Silveira et al., 2021;
Hokkanen and V
¨
a
¨
an
¨
anen-Vainio-Mattila, 2015).
From different UX design disciplines, UX Re-
search emerges as essential to sustain the product
conception and evolution (Farrell, 2017). UX Re-
a
https://orcid.org/0009-0005-4886-8217
b
https://orcid.org/0000-0002-4421-2940
c
https://orcid.org/0000-0002-1736-544X
search systematically researches and evaluates users’
interaction with a product by providing techniques
and methods to collect, analyze, and interpret user
data (Farrell, 2017; Pazitka, 2019). Practices for this
purpose generate meaningful insights on UX design,
which contribute to decision-making about product
development from users’ motivations and pains (Paz-
itka, 2019). Thus, UX Research practices (i.e., UXR
practices) represent recurring attitudes, actions, or
activities of user experience research and evaluation
work, which satisfy user-centered product develop-
ment (Meingast et al., 2013). UX Research work
is relevant to reducing the risk of failure in product
development (S
¨
uner-Pla-Cerd
`
a et al., 2021), besides
bringing significant value and establishing a competi-
tive edge for the company (Silveira et al., 2021).
Despite the variety of UX methods and tech-
niques, there is a lack of solutions to facilitate the se-
lection of UX Research methods and techniques most
suitable for the needs of companies and their product
development objectives (Hokkanen and V
¨
a
¨
an
¨
anen-
Vainio-Mattila, 2015). Professionals can easily find
a description of practices dedicated to data collection
and analysis in UX (S
¨
uner-Pla-Cerd
`
a et al., 2021);
however, there is still a lack of knowledge among pro-
fessionals about how to analyze user feedback (Sil-
de Moura, M., Martinelli, S. and Zaina, L.
Guiding the Adoption of UX Research Practices: An Approach to Support Software Professionals.
DOI: 10.5220/0012597100003690
Paper published under CC license (CC BY-NC-ND 4.0)
In Proceedings of the 26th International Conference on Enterprise Information Systems (ICEIS 2024) - Volume 2, pages 473-484
ISBN: 978-989-758-692-7; ISSN: 2184-4992
Proceedings Copyright © 2024 by SCITEPRESS – Science and Technology Publications, Lda.
473

veira et al., 2021). Besides, professionals struggle
in how to transform user data into useful information
for software development (Hokkanen and V
¨
a
¨
an
¨
anen-
Vainio-Mattila, 2015).
From the gap of tools that support the application
of UX Research into practice, a set of 14 guidelines
was proposed. These guidelines assist software pro-
fessionals in their UX Research work by suggesting
UXR practices, methods, and techniques to conduct
research and evaluation with users. These guidelines
were conceived from a Systematic Literature Review
(SLR) that analyzed 45 studies conducted in the soft-
ware industry. Considering the findings of the SLR,
we developed an online catalog Guidelines for UX
Research in Practice (GURiP) to provide a useful and
accessible resource for professionals looking for ad-
vice on how to implement UX Research in practice.
We evaluated the acceptance of the guidelines in
the dimensions of perceived ease of use, usefulness,
and intent to use, as well as the participants’ over-
all feedback. Our study involved 32 professionals
who were instructed to apply the GURiP tool’s guide-
lines in practical UX Research scenarios. The group
of participants comprised a diverse range of profiles,
including UX and software professionals in different
positions in software startups and established compa-
nies. We considered it relevant to have startup and
established company professionals in our sample due
to the literature suggesting that startup professionals
generally have a shorter tenure of professional ex-
perience. Our findings indicate that the guidelines
were well-received and emphasized that they could
be useful mainly for novice professionals. Our re-
sults also showed that participants’ professional back-
grounds did not significantly impact the guidelines’
acceptance, demonstrating their suitability across var-
ious profiles.
This paper is organized as follows. The related
work and the conception of the guidelines are pre-
sented in Sections 2 and 3, respectively. Section
4 gives all the procedures adopted in the guidelines
evaluation. The findings are presented in Section 5
and the discussion of the findings and the their re-
lation with the literature in Section 6. Finally, the
contributions and the conclusions are pointed out in
Section 7.
2 RELATED WORK
A survey involving 65 organizations in Saudi Ara-
bia examined professionals’ perceptions of UX and
related practices, focusing on obstacles impeding the
integration of UX work in software development envi-
ronments (Majrashi and Al-Wabil, 2018). The results
indicated that participants identified the primary ob-
stacle as a lack of understanding or knowledge about
UX Research, exacerbated by a shortage of trained
UX professionals. Another survey in Saudi Arabia
gathered responses from 75 software professionals
(Alhadreti, 2020). The study aimed to assess the per-
ception of professionals about the significance of UX
in software development and the challenges in UX
work. The findings showed that task analysis, proto-
typing, and heuristic evaluation are methods prevalent
during various stages of product development, espe-
cially in the prototyping phase.
A previous study also discussed the main chal-
lenges of integrating UX and agile methods in soft-
ware development (Meingast et al., 2013). Among
the findings, the significance of collaborative activ-
ities, such as brainstorming sessions and informa-
tion sketching, along with the involvement of stake-
holders and developers in UX activities, was high-
lighted. In another study, the authors categorized or-
ganizational barriers from a systematic literature re-
view (Kervyn de Meerendr
´
e et al., 2019). These
barriers encompass the inadequacy of UXR practices
and methods, insufficient UX literacy, and subopti-
mal utilization of UX artifacts. The study highlights a
prevalent lack of comprehension among profession-
als regarding UX, often compounded by confusion
between UX and User Interface (UI). This misunder-
standing, in turn, contributes to hindering the appli-
cation of UX Research methods and artifacts within
organizational contexts.
A recent study presented a UX Process Refer-
ence Model (UXPRM), which includes delineating
fundamental UX lifecycle processes and systemati-
cally classifying UX methods and artifacts (Kieffer
et al., 2019). UXPRM furnishes a comprehensive
overview of UX-centric practices that encompass col-
lecting data on opinions, feedback, and user behav-
ior. Methods for knowledge elicitation are further cat-
egorized into those involving user participation and
those without, the latter focusing on predicting sys-
tem usage through expert opinions. In a SLR, the
authors highlighted the need for specialized UX re-
search technologies prioritizing user-friendliness and
comfort (Rivero and Conte, 2017). The results argue
that future UX evaluation technologies should inte-
grate diverse aspects and prevent duplication or con-
fusion between quantitative and qualitative data from
achieving comprehensive evaluation reports.
In addition to these studies, researchers proposed
a tool to recommend UX evaluation methods by em-
ploying filters that conducted the stakeholders dur-
ing evaluations (Oliveira et al., 2023). The feasi-
ICEIS 2024 - 26th International Conference on Enterprise Information Systems
474

bility study gathered positive feedback from partici-
pants about the perception of the usefulness of tools
that suggest UX methods to help professionals in the
decision of which practice or method they should
adopt. Besides, the feedback revealed the need for
tools for centralized ease of access to UX-related con-
tent guides.
Our guidelines differ from the related work above
by focusing on a specific UX area, i.e., UX research.
The guidelines were elaborated considering a SLR,
a similar approach adopted by (Rivero and Conte,
2017), incorporating UXR practices widely employed
in the industry.
3 UX RESEARCH PRACTICES’
GUIDELINES
Our guidelines aim to assist software professionals in
working with UXR practices. In particular, we in-
tend to support professionals in employing UXR prac-
tices in industry settings. The guidelines related to
UXR practices are categorized into six groups (see
Table 1 for group descriptions). Fourteen guidelines
were derived from the literature, as outlined in Table
2. Each guideline includes details about the methods
and techniques suggested, practical guidance to apply
them, and the professionals who should be involved
in putting the guideline into practice. Each guideline
clearly defines its objectives and outlines the associ-
ated benefits of the proposed methods and tools.
The guidelines were elaborated by following a rig-
orous Systematic Literature Review (SLR) method
(Kitchenham and Charters, 2007). The entire process
of guideline construction is detailed in our previous
work (Martinelli et al., 2022). In this paper, we will
briefly describe the construction process; further de-
tails will be added in case the paper is accepted.
The search string was applied to five scientific pa-
per’s search engines (i.e., ACM Digital Library, Engi-
neering Village, IEEE Xplore, Scopus, and Web of Sci-
ence) and resulted in 634 papers selected. Our exclu-
sion criteria focused on eliminating papers published
before 2001, short papers, or studies that showed
technical problems of software (e.g., algorithm opti-
mization, programming). Meanwhile, our inclusion
criteria are dedicated to selecting papers that describe
UXR practices applied by the software industry, as
well as papers that present contributions to UX Re-
search work (e.g., how has been applied user research,
collection, analysis, or interpretation of data).
After applying the inclusion and exclusion crite-
ria, 45 papers were deemed relevant to our analysis.
We thus conducted a qualitative analysis using open
Table 1: Groups of UXR Practices.
Research Planning (RP)
Actions focused on planning activities in UX Research,
encompassing the definition of research goals, organization
of research tasks within software development teams,
and the creation of artifacts or prototypes to facilitate
research conduct.
Research Training (RT)
Actions to encourage a culture of research and user evaluation
among software industry professionals, including training
in UX research skills.
Collecting Data with Users (CD)
Actions dedicated to generating data through research
and user testing, conducted at different stages of the
software development cycle.
Data Analysis (DA)
Actions that aid decision-making in software development
through quantitative and qualitative analysis methods.
Organization and Communications (OC)
These communicative actions involve organizing and
communicating with professionals in software development.
They are related to research and evaluations conducted by
these professionals.
Design with Research (DR)
Approaches that integrate UX Research into the UX Design
process, with a special focus on creating the initial design,
involving the development of software prototypes.
These designs and prototypes serve as support for
conducting user research activities.
code, a technique in which the names and meanings of
the codes emerge from the analyzed data itself (Gibbs,
2018). The researcher assigns codes and definitions to
each set of extractions based on the common meaning
of these extractions (Charmaz, 2006). As a result, we
identified 38 UXR practices that were applied by the
software industry.
These practices were further categorized into six
groups (see Table 1) based on essential actions or at-
titudes dedicated to UX Research work, e.g., defin-
ing research goals, collecting user feedback, apply-
ing user tests, and developing research skills. Conse-
quently, we developed a set of guidelines that can help
professionals choose the best UXR practices, meth-
ods, and techniques to facilitate data collection and
evaluation at different stages of the product lifecycle.
Considering the guidelines, we have developed
the GURiP tool, building upon our formulated guide-
lines and their respective categories (see Figure 1).
This tool is specifically tailored for professionals in
the software industry, with a primary objective of fa-
cilitating the finding of new techniques and meth-
ods of UX Research suitable for each stage of prod-
uct development. The GURiP tool
1
offers three dis-
tinct views: one provides an overview of general cat-
egories, another shows the details of the guidelines
within each specific group, and a final view offers
more in-depth information about individual guide-
1
GURiP tool available in http://uxleris.net/gurip/.
Guiding the Adoption of UX Research Practices: An Approach to Support Software Professionals
475

Table 2: Guidelines for UX Research in Practice (GURiP).
Research Planning (RP)
RP1
Defining goals, strategies, and pre-established
roles related to the practical work of UX
Research.
RP2
Planning user research and evaluations,
considering the support of artifacts to aid in this
planning.
Research Training (RT)
RT1
Conducting workshops, training sessions, and
internal study groups on UX Research among
professionals involved in different teams.
RT2
Establishing partnerships with academic experts
in UX/UCD or with agile and UCD consultants
to conduct workshops or training sessions on
UX Research.
RT3
Implementing strategies to guide on the
importance of UX at the business level and
promote the UX Research practices carried out
internally by professionals involved in different
teams.
Collecting Data with Users (CD)
CD1
Conducting collections that combine different
moments of product use by users (before,
during, and after use) to generate longitudinal
UX research.
CD2
Generating initial and anticipatory user research
before the product development cycle.
CD3
Frequent and continuous user testing and
evaluations at any stage of product
development.
Data Analysis (DA)
DA1
Developing user data analyses to generate
valuable insights for product development.
DA2
Frequently analyzing operational and system
data derived from user interactions with
products and services.
DA3
Conducting qualitative analyses of user
interaction with the product and
cross-referencing results with quantitative data.
Organization and Communications (OC)
OC1
Adapting research and evaluation activities with
users according to project needs and available
resources.
OC2
Creating lean artifacts or actions to share
knowledge about users.
Design with Research (DR)
DR1
Developing designs integrated with UX
Research practices and guided by UX
information.
lines.
The GURiP tool’s catalog presents categories with
titles, icons, and descriptions on cards (see Figure
1(a)). By selecting a category, the user can access the
category page containing the guidelines. Users can
access all the essential information for each guideline,
including the title, objective, recommended methods
and techniques, and the professionals involved (see
Figure 1(b)). The methods suggested are shown as
hyperlinks to external pages with more in-depth de-
tails. We provide the option to obtain additional in-
formation about each guideline, provide instructions
on how to implement it, and highlight its usage ben-
efits (see Figure 1(c)). The tool is available on the
Internet; however, we could not provide its link due
to the double-blind review policies.
4 EVALUATION
Our study followed the guidelines for experimen-
tal studies (Wohlin et al., 2012). Our study was
approved by the ethics committee of the Federal
University of S
˜
ao Carlos under the process number
68524023.0.0000.5504.
The study was conducted by two researchers,
hereafter referred to as R1 and R2. R1 is an under-
graduate student in Computer Science and currently
plays the role of web developer as an intern at a com-
pany; R2 is a Ph.D. candidate in Computer Science
with 6+ years of experience in User Experience and
qualitative research.
4.1 Planning
Participants were invited to take part in the study
voluntarily through announcements disseminated via
LinkedIn. Our invitation included posts in profes-
sional groups related to UX Research, UX Design,
and software development. Additionally, we sent
emails to contacts within our professional network.
The selection of participants was based on conve-
nience and availability to participate in the study
(Wohlin et al., 2012). Both professionals from star-
tups and established companies were invited to join.
The participants were divided into two groups: one
consisted of software startup professionals, and the
other composed of software professionals from estab-
lished companies.
We designed the study to explore two scenarios
using guidelines through the GURiP tool. Within the
tool, users were free to navigate through guideline
groups and subsequently, within each group, access
the available guidelines in each category. In each sce-
nario, participants had the flexibility to select one or
more guidelines that best suited the proposed situa-
tion.
An online questionnaire was developed to collect
data on participants’ professional profiles (e.g., years
of experience, market segment of the company, and
role in the company). The questionnaire included the
Informed Consent Form to obtain participants’ agree-
ment to be part of the study. We also created an on-
line feedback questionnaire based on the Technology
ICEIS 2024 - 26th International Conference on Enterprise Information Systems
476
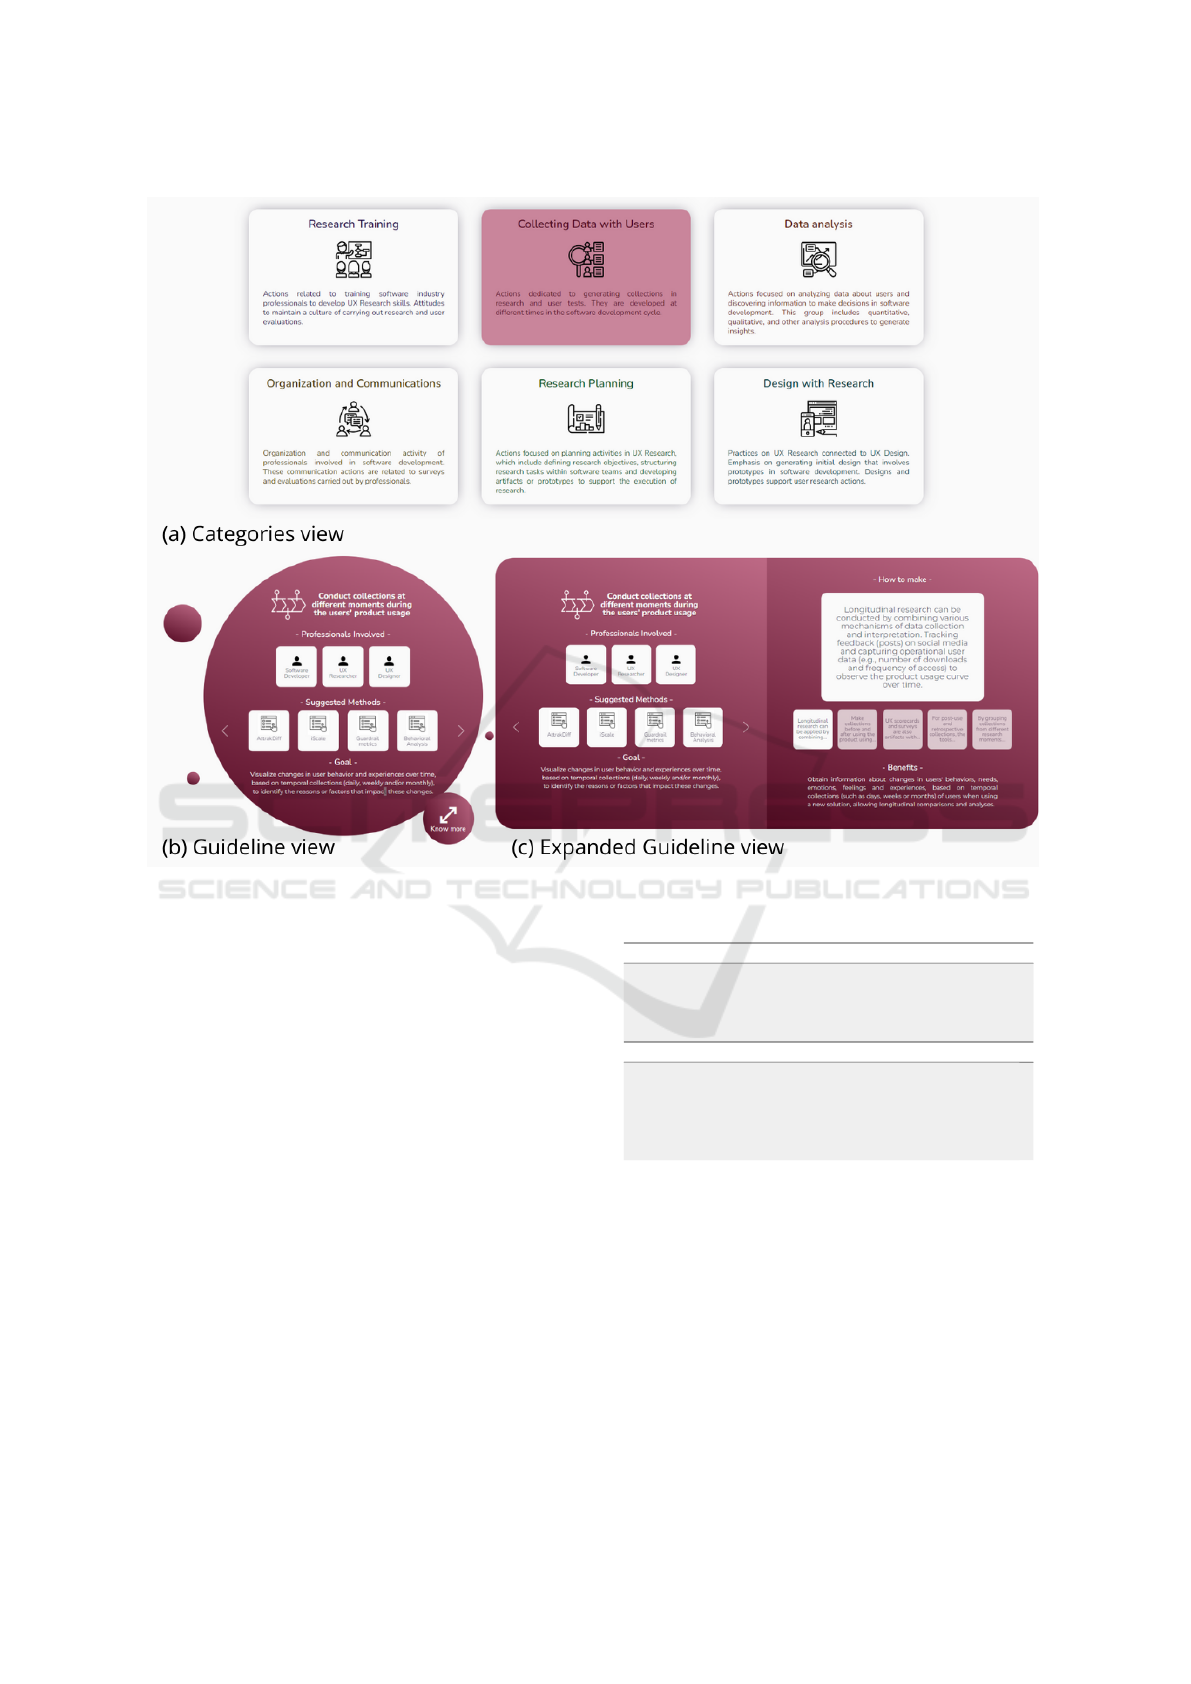
Figure 1: GURiP Tool.
Acceptance Model 3 (TAM3) (Venkatesh and Bala,
2008), an updated version of the Technology Accep-
tance Model (Davis, 1989) to gather participants’ per-
ceptions of the guidelines. We utilized TAM3, which
presents questions divided into three constructs. The
perceived usefulness construct represents how much
a person believes using a specific technology can en-
hance their performance in UX-related tasks. The
ease of use construct is related to the perception that
the technology can be adopted effortlessly. The third
construct concerns the user’s intention to use the tech-
nology (Dias et al., 2011). We added three open-
ended questions at the end of each construct.
Finally, we wrote up two scenarios that depict how
users would interact with the guidelines. The scenar-
ios aimed to assess practical aspects such as the ap-
plication’s ease of use, utility perception, and users’
comprehension of categorizing guideline groups (see
Table 3).
We had a senior researcher with 20+ years of ex-
perience in empirical studies in industry and User Ex-
perience research evaluate our study. They reviewed
and refined the profile questionnaire and other arti-
Table 3: Scenarios.
Scenary 1
“You need to gather feedback from users about a new
feature implemented. Afterward, you need to materialize
this feedback through an electronic presentation to share
the results with the team.”
Scenary 2
“You need to identify patterns in the data regarding the
difficulties and needs of users after the release of the
latest update. You’ve never done this type of activity
before and decided to seek assistance in conducting
this inspection.”
facts. In addition, a professional with eight years of
experience in software development and UX design
participated in our pilot test. This professional helped
us understand what hindered their understanding of
the scenarios, which allowed us to improve the clarity
and accuracy of the scenarios. After these changes,
we concluded that no further alterations were neces-
sary, and the study could proceed.
Guiding the Adoption of UX Research Practices: An Approach to Support Software Professionals
477
4.2 Execution
The study involved 32 professionals who worked in
different companies in Brazil. Of these professionals,
16 were employed in startups and 16 in established
companies. The research was conducted through on-
line meetings using the Google Meet platform
2
. R1
and R2 followed the same script to ensure the unbias
of the study execution with each session having an
average duration of 30 minutes.
The researchers welcomed the participants in each
session and briefly outlined the study’s objectives.
Participants agreed to the informed consent terms for
using their data and recording the meeting for aca-
demic purposes, and they completed the profile ques-
tionnaire. The participants engaged in a warm-up
exercise to familiarize themselves with GURiP tool.
Participants could freely navigate the tool to level
their knowledge of the catalog. The warm-up lasted
approximately 5 minutes for each participant.
Once the warm-up was completed, we presented
the different scenarios to the participants. Each par-
ticipant’s proposed solutions were expressed verbally
using the think-aloud method, in which participants
speak aloud any words in their mind as they complete
a task (Charters, 2003). The participants’ screens and
audio were recorded with their permission while uti-
lizing the tool. Based on the participants’ responses or
speeches, we collected information on which guide-
lines each professional would use to solve the given
scenarios. After the guidelines usage, participants
could provide comments or opinions about using the
guidelines. Finally, participants were invited to re-
spond to the TAM online questionnaire (Dias et al.,
2011).
4.3 Analysis
We considered three sources for data analysis. We
conducted a qualitative analysis by considering the
feedback responses from open-ended TAM questions
and the comments made by participants at the end of
the scenario implementations. For the quantitative
analysis, we utilized the responses to closed-ended
questions from the online questionnaire. R1 and R2
were responsible for the data analysis. Besides, a se-
nior researcher with 20+ years of experience in empir-
ical studies in industry and User Experience research
supervised and discussed all results with R1 and R2.
The qualitative analysis followed three steps.
First, we utilized closed coding, which involves iden-
tifying text excerpts and categorizing them within a
2
https://meet.google.com/.
pre-established codebook (Corbin, 1998). This tech-
nique helped us to explore all responses more thor-
oughly. Our research involved using a codebook that
included three codes to represent the dimensions of
TAM (Dias et al., 2011), as well as three codes to
identify different professional experiences: those with
less than 3 years of experience, those with between 3
and 5 years of experience, and those with more than 5
years of experience. We classified participants’ feed-
back using two codes: ‘positive feedback’ and ‘nega-
tive feedback’. Additionally, we assigned open codes
to the excerpts. We applied open codes as a sec-
ond technique to allow the researcher to identify new
codes from the analyzed data (Gibbs, 2018). This
technique enables the assignment codes and their def-
initions from a common meaning of the grouped ex-
tractions (Charmaz, 2006). We code what the emerg-
ing topics are concerning positive and negative feed-
back. The R1 developed open codes during data anal-
ysis, which were later validated and refined by R2.
Finally, we explored participants’ acceptance re-
sponses regarding using guidelines in the dimensions
of perceived of usefulness, perceived of ease-of-use,
and intention to use use using the objective questions
from the TAM questionnaire (Table 4). In the ques-
tionnaire, participants responded on a 4-point Likert
scale. We applied a scale without a neutral point to
favor a more accurate response and prevent the par-
ticipant’s choice of a neutral point, avoiding a conflict
of opinion with the researcher (Garland, 1991; Johns,
2005). We also analyzed whether their profiles influ-
enced technique acceptance.
Table 4: TAM Questions.
Construct ID Question
Perceived
of
Ease-of-use
E1
I find the guidelines easy to understand.
E2
I consider that interacting with the
guidelines demands minimal mental
effort.
E3
I find it easy to apply the guidelines.
E4
I find that using the guidelines makes my
work easier.
Perceived
of
Usefulness
U1
Using the guidelines helped me in
performing UX Research activities.
U2
Using the guidelines made it easier to
perform UX Research activities.
U3
Using the guidelines improved my
performance in UX Research tasks.
U4
I consider the guidelines useful for
performing UX Research tasks.
Perceived
of future
use intent
F1
Given access to the guidelines, I plan to
utilize them.
F2
Given access to the guidelines, I foresee
using it.
ICEIS 2024 - 26th International Conference on Enterprise Information Systems
478
4.4 Threats to Validity
We adopted the four elements (i.e., conclusion, con-
struct, internal, and external) to discuss the threats to
validity (Wohlin et al., 2012) and outlined our strate-
gies to mitigate the study issues. To ensure the reli-
ability of our conclusions from the results, we relied
on multiple sources of data (i.e., profile questionnaire,
scenarios with verbal feedback, and TAM question-
naire that included open-ended questions), as well as
a mixed-methods approach for data analysis. Both
types of analysis were conducted by the first author
and reviewed by the other authors, who are experi-
enced in qualitative and quantitative analyses. Dur-
ing the open and closed coding activities, the first au-
thor frequently communicated with the second author,
who guided the conducting of the qualitative analysis.
To avoid problems in the construction validity, we
followed a consistent script in all study sessions and
provided the same scenarios to every participant. Fur-
thermore, we included a preliminary scenario to lever-
age participants’ previous knowledge. We also em-
phasized various guideline categories to reduce the
effects of misunderstandings of UX Research and the
guidelines as a whole.
We set a maximum duration of one hour for each
study session to evade potential participant fatigue,
which can threaten internal validity. By using the
GURiP tool, the participants employed less effort in
handling the guidelines usage. All necessary infor-
mation for implementing the scenarios was available
in the tool, including the guidelines’ objectives and
benefits.
Our study involved 32 participants from startups
and established companies, which ensured diversity
in their professional experience and roles. This ap-
proach helped us obtain a representative sample for
our research objectives, securing external validity.
5 FINDINGS
The profile of the participants is summarized in Table
5. We observed a balanced representation of profes-
sionals from both startups and established companies,
as well as various experience levels and job roles.
We will present findings in the two next sections:
guidelines acceptance and the influence of partici-
pants’ profiles on the results.
5.1 Acceptance of the Guidelines
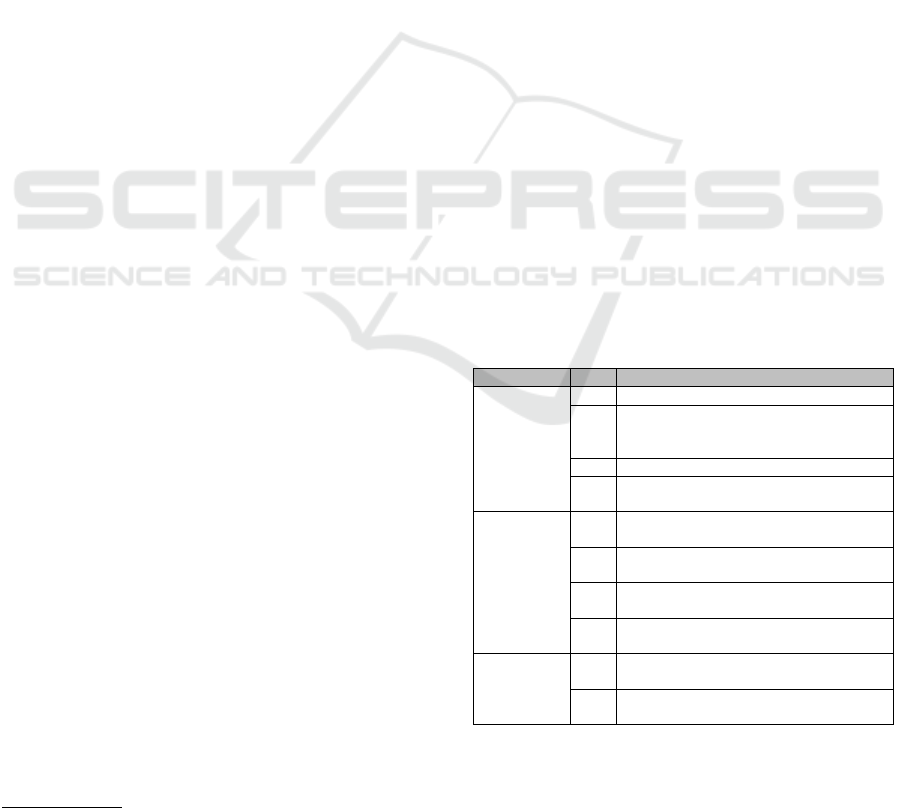
The participants’ responses are shown in Figures 2
and 3. In the figures, we see that participants from
startups and established companies highly accepted
the guidelines in general. However, a different result
can be observed in Figure 3 about the Perceived of
Usefulness dimension. By crossing the participants’
profiles with the results, we saw that Participant P04,
who works for a startup with over 5 years of expe-
rience, assigned low scores to all questions for that
construct. Unfortunately, we could not find an expla-
nation for the low scores because the participant did
not point out the reasons.
Figure 2: Acceptance results of professionals from estab-
lished companies.
Figure 3: Acceptance results of professionals from startups.
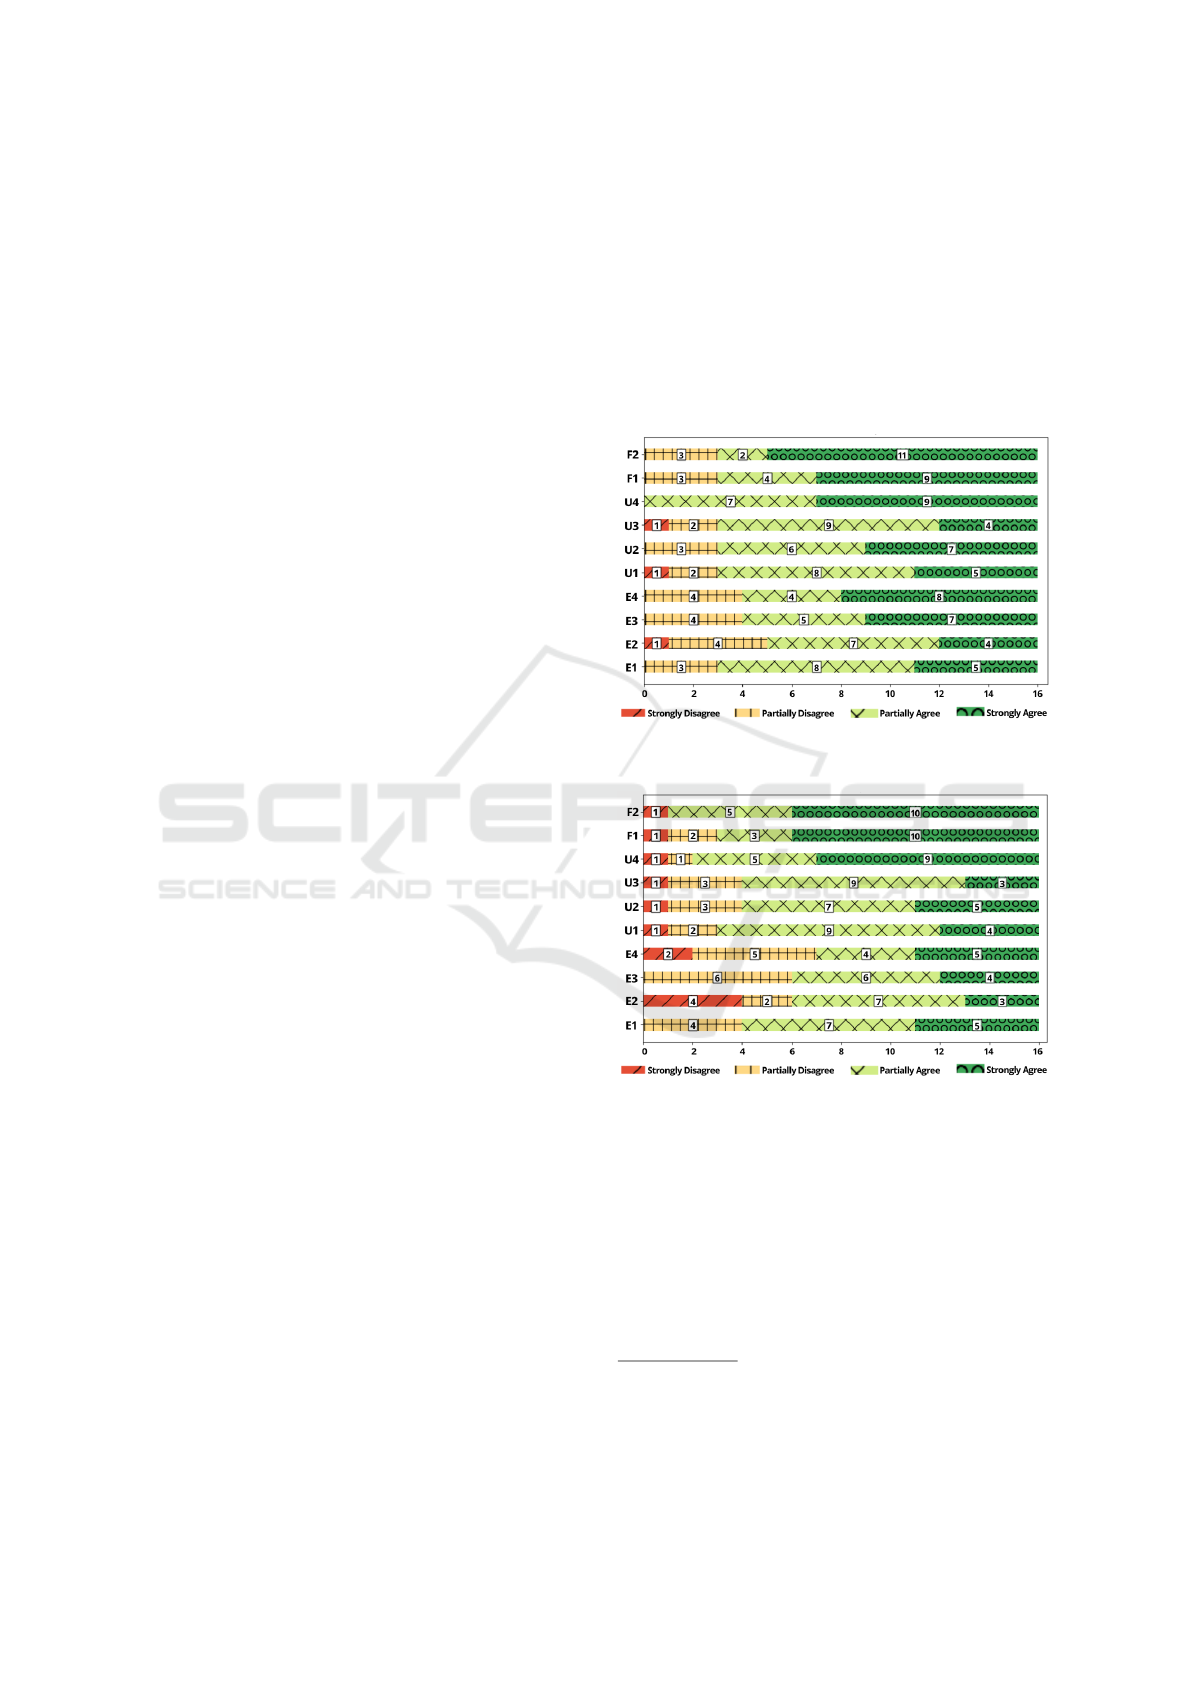
To provide a supplementary view of the TAM re-
sults, we examined the comments made by the partic-
ipants and their relationship with the TAM constructs.
Figure 4 shows a Sankey diagram
3
that illustrates the
link of the open codes (on the left side) and their as-
sociation with the corresponding TAM construct (on
the right side). The open codes emerged in the quali-
tative analysis and expressed the positive or negative
feedback provided by the participants. In Figure 4,
3
Sankey diagram is a flow diagram in which the width
of the arrows is shown proportionally to the flow quantity.
It helps locate dominant contributions to an overall flow
(Schmidt, 2008).
Guiding the Adoption of UX Research Practices: An Approach to Support Software Professionals
479

Table 5: Participants’ profile.
Id Group* Position Experience Market segment
P01 EC UX Researcher <3 years Data and credit granting
P02 EC UX Coordinator UX <3 years Tourism / Services
P03 SS UX Researcher >5 years Venture Capital
P04 SS UX Researcher >5 years Fintech
P05 EC UX Designer, UX Researcher >5 years Product and Design Consulting
P06 SS UX Designer, UX Researcher <3 years Healthtech
P07 EC UX Designer, UX Researcher 3 to 5 years Information Technology
P08 SS Product Manager <3 years Fintech
P09 EC UX Researcher >5 years Edtech
P10 SS UX Researcher 3 to 5 years Agtech
P11 SS UX Researcher <3 years Tourism / Services
P12 EC UX Designer, UX Researcher 3 to 5 years Information Technology
P13 EC UX Researcher >5 years Fintech
P14 SS UX Researcher, Product Designer <3 years Information Technology
P15 EC Software Engineer, Tech Lead 3 to 5 years Edtech
P16 SS UX Designer 3 to 5 years HRtech
P17 SS UX Researcher >5 years Accounting
P18 SS Research Project Consultant >5 years Logistics
P19 EC UX Designer <3 years Information Technology
P20 EC UX Researcher 3 to 5 years Telecommunications
P21 SS Product Designer <3 years Information Technology
P22 SS UX Designer >5 years Information Technology
P23 SS UX Designer, UX Researcher <3 years Information Technology
P24 SS Developer <3 years Accounting
P25 SS UX Designer, UX Researcher 3 to 5 years Digital and In-person Events
P26 SS Software Engineer, UX Researcher >5 years Logistics
P27 EC Project Manager <3 years e-Commerce
P28 EC R&D Analyst <3 years R&D Consulting
P29 EC SAP Business Consultant SAP <3 years Information Technology
P30 EC Project Manager 3 to 5 years e-Commerce
P31 EC Software Developer 3 to 5 years Information Technology
P32 EC Software Engineer, Tech Lead >5 years Information Technology
*Legend: SS to Software Startup; EC to Established Company.
the width of the arrows illustrates the number of quo-
tations and helps identify each column’s main contri-
butions toward the overall flow. For each open code,
we indicate whether the feedback was positive, nega-
tive, or both by using the labels +, -, and +/- for both),
respectively. Besides, the number of the participant’s
quotations for each open code and TAM construct is
informed between brackets in the figure. By look-
ing at Figure 4, we observe that positive feedback is
mostly related to the constructs of Perceived of Use-
fulness and Intention to Use. In contrast, negative
feedback is primarily linked to the Perceived Ease-
of-use of the guidelines.
Regarding the Perceived Ease-of-Use construct,
we identified 15 instances of the label quantity of
text, predominantly associated with negative feed-
back. Participants noted that excessive details about
the content of the guidelines made it more challeng-
ing to find guidelines that were useful for each sce-
nario; it can be seen from P27 comment: ”Some long
texts make it challenging to quickly understand each
block of information.” On the other hand, the open
code division of categories emerged as a recurring
theme related to positive feedback in the Perceived
Ease-of-Use construct. It was observed that adopt-
ing categories to group the guidelines made finding
the suitable guidelines easier as expressed by P03:
”The breakdown of training, collection, analysis [cat-
egories]... feels more intuitive.”.
Considering the constructs of Perceived of Use-
fulness and Intention to Use, participants expressed a
favorable view of the guidelines’ content, particularly
emphasizing its high quality for newcomers in the UX
research area: ”The tool, I think it’s pretty cool, espe-
cially helpful for someone who’s just starting in the
career or even those who sometimes need to conduct
research without much guidance.”, commented P16.
Additionally, participants recognized the value of the
content of the guidelines as an introductory resource
for beginners and a valuable tool for seasoned profes-
sionals seeking to explore and adopt innovative meth-
ods and techniques in their work, as mentioned by
P20: ”Method visualization helps a lot when we have
complex research to conduct and end up getting stuck
in using method X or Y. This way, we can freshen up
our ideas a bit”.
5.2 Influence of Participants’ Profile in
the Results
We conducted two tests to investigate the potential in-
fluence of participants’ profiles on the results. First,
ICEIS 2024 - 26th International Conference on Enterprise Information Systems
480
Figure 4: Relation of the participants’ feedback (open codes) and the TAM constructs.
we explored whether the fact that the professionals are
working in startups and established companies could
affect the participants’ responses about acceptance of
the guidelines. We carried out this verification be-
cause startups and established companies present dif-
ferent dynamics in their workplace and consequently,
their professionals usually have different perspectives
about the work. To conduct the verification, we com-
puted the mean and median values for each TAM con-
struct, splitting the professionals’ responses into two
groups, i.e., startups and established companies (see
Table 6 and the boxplots in Figure 5). We see a small
difference in the average when comparing the values
of startups and established companies. In particular,
by looking at Figures 2 and 3, we see a difference in
the Perceived of Usefulness, i.e., in E2 and E4 ques-
tions. The results showed that some participants con-
sidered they should employ mental efforts to use the
guidelines (i.e., E2) and also that the guidelines will
not make their work easier (i.e., E4).
We performed the Independent Samples T-Test
test
4
. This choice was based on the paired and inde-
pendent nature of the samples and the observed nor-
mal distribution. The latter was confirmed through the
Shapiro-Wilk test (Shapiro and Wilk, 1965). Shapiro-
4
https://www.statstest.com/independent-samples-t-test
Table 6: Mean and Median for each group.
Construct Group Mean Median
Perceived
of
Ease-of-use
Startup 2.8 3.0
Estabilished
Company
3.1 3.0
Perceived
of
Usefulness
Startup 3.06 3.0
Estabilished
Company
3.21 3.25
Perceived
of future
use intent
Startup 3.43 4.0
Established
Company
3.43 4.0
Wilk test was conducted at a significance level of 95%
(i.e., 0.05) to assess the distribution of samples for
each TAM construct. The results indicated that sam-
ples from established companies and startups demon-
strated a normal distribution as outlined in Table 8.
To conduct the Independent Samples T-Test, we de-
fined the null hypothesis (H0) and alternative hypoth-
esis (H1) as follows: H0 - There is no influence of
workplace type on the acceptance of the technique.,
and H1 - There is an influence of workplace type on
the acceptance of the technique. Table 7 presents the
results (see p-value) and they indicate that no signif-
icant evidence supports the idea that the fact of the
professional works in a startup or an established com-
pany influenced the acceptance of the guidelines.
After, we verified whether the participants’ expe-
Guiding the Adoption of UX Research Practices: An Approach to Support Software Professionals
481
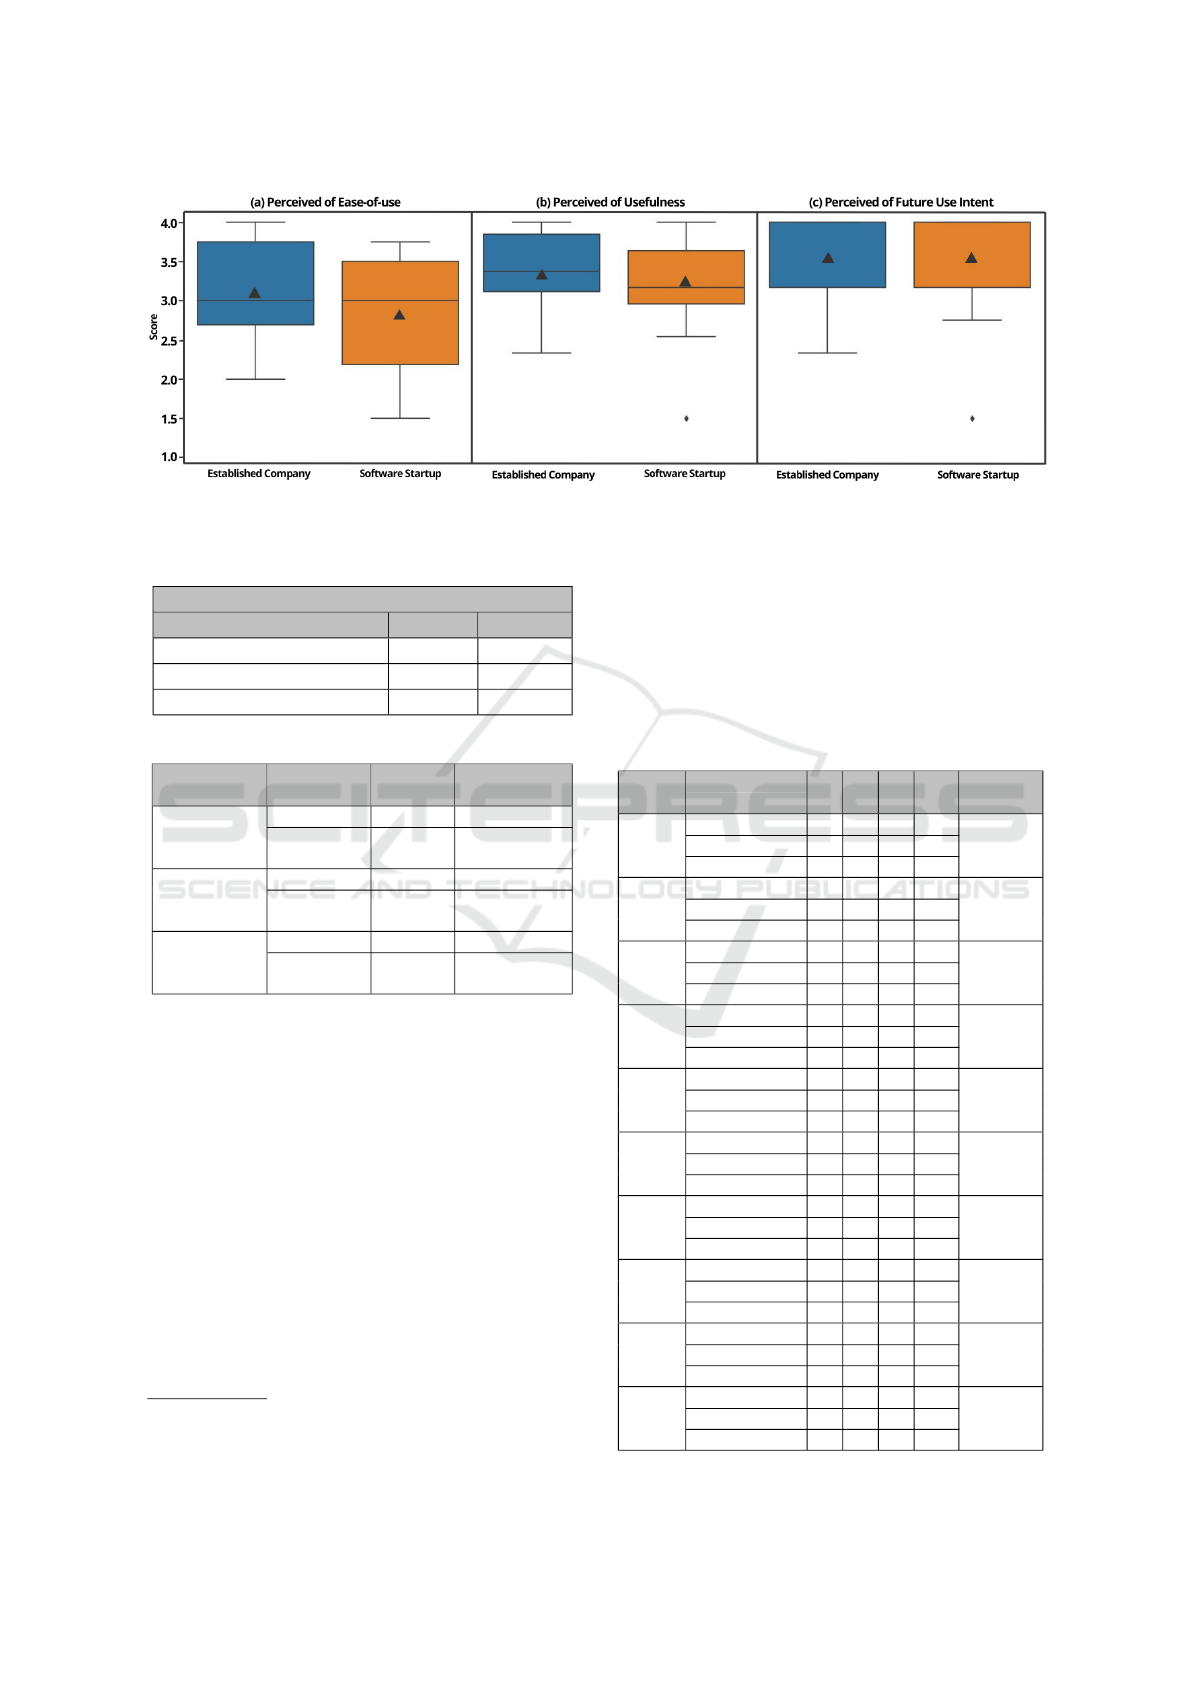
Figure 5: The scale ranged from 1, indicating ’strongly disagree,’ to 4, representing ’strongly agree’. The median: a horizontal
line inside the ’box’; the mean: a black triangle.
Table 7: Independent Samples T-Test.
Influence of the type of company
Construct TAM t value p value
Ease-of-Use -0,894 0,379
Perceived of Usefulness -0,085 0,933
Use intent -0,096 0,924
Table 8: Shapiro test.
Construct Group p value
Normal
Distribution
Perceived
of
Ease-of-use
Startup 0.06 Yes
Stabilished
Company
0.16 Yes
Perceived
of
Usefulness
Startup 0.07 Yes
Stabilished
Company
0.14 Yes
Perceived
of future use
intent
Startup 0 No
Stabilished
Company
0 No
rience influenced their acceptance of the guidelines by
performing Fisher’s exact testing
5
. We divided the
participants into three groups based on their experi-
ence level: <3 years, 3 to 5 years, and >5 years. The
Fisher’s exact test compares categorical data from
small sample sizes. This test accurately calculates
the significance of the deviation from a null hypothe-
sis using the p-value, providing a more reliable result
than other methods. Unlike alternative methods, ex-
act significance tests do not require a well-distributed
or balanced sample, which aligns well with the char-
acteristics of our sample (Mehta and Patel, 1996). We
established a 95% confidence interval (i.e., 0.05) to
reduce errors in the findings. To perform the Fisher
exact test
6
, we formulated the hypotheses as follows:
H0 - The experience of the professional does not af-
5
https://www.statstest.com/fischers-exact-test/.
6
We ran tests from https://astatsa.com/.
fect the acceptance of the guidelines. and H1 - The
experience of the professional affects the acceptance
of the guidelines. The p-value results for each TAM
question are presented in Table 9, which leads us to
accept the null hypothesis for all questions. The re-
sults suggest no statistical evidence that professional
experience affects the acceptance of the guidelines.
Table 9: Exact Fisher test results.
TAM
Professional
experience
1 2 3 4 p-value
E1
<3 years 0 2 7 4
0,26023 to 5 years 0 1 3 5
>5 years 0 4 5 1
E2
<3 years 2 4 4 3
0,51293 to 5 years 0 1 6 2
>5 years 3 1 4 2
E3
<3 years 0 3 5 5
0,65313 to 5 years 0 2 4 3
>5 years 0 5 2 3
E4
<3 years 1 1 5 6
0,09483 to 5 years 0 4 0 5
>5 years 1 4 3 2
U1
<3 years 0 2 8 3
0,28493 to 5 years 0 0 4 5
>5 years 2 2 5 2
U2
<3 years 0 4 4 5
0,08013 to 5 years 0 0 3 6
>5 years 1 2 6 1
U3
<3 years 0 4 6 3
0,22743 to 5 years 0 0 6 3
>5 years 2 1 6 1
U4
<3 years 0 0 5 8
0,23553 to 5 years 0 0 2 7
>5 years 1 1 5 3
F1
<3 years 1 2 0 10
0,03643 to 5 years 0 0 4 5
>5 years 0 3 3 4
F2
<3 years 1 1 1 10
0,22483 to 5 years 0 0 2 7
>5 years 0 2 4 4
ICEIS 2024 - 26th International Conference on Enterprise Information Systems
482

6 DISCUSSION
This article proposed a catalog of guidelines to help
professionals select and apply UX research. The
guidelines were developed from an SLR previously
published by the second author (Martinelli et al.,
2022). This approach of constructing guidelines
based on experiences extracted from the literature and
categorizing them is similar to the work (Kervyn de
Meerendr
´
e et al., 2019). Additionally, similar to the
(Oliveira et al., 2023) proposal, our catalog is a tool to
assist professionals in selecting UX practices. How-
ever, our proposal is more comprehensive than the
cited works, as it presents more than guidelines and
categories. The catalog joins a set of useful informa-
tion to adopt UXR practices, such as the professionals
involved in that practice, UXR methods that can be
adopted, as well as suggestions on how to implement
the practices (see an example in Figure 1).
In contrast to previous studies (Alhadreti, 2020;
Kieffer et al., 2019) our guidelines are not strictly tied
to software development stages, allowing for more
flexibility in their implementation. Our guidelines are
intended to address the lack of knowledge about UX
methods and the incorporation of UX Research into
agile practices, topics discussed by literature (Ma-
jrashi and Al-Wabil, 2018; Rivero and Conte, 2017;
Meingast et al., 2013). The catalog serves as a source
of knowledge that can help professionals in compa-
nies to find the practices that best suit their needs, as
evidenced by the results of the catalog evaluation (see
Section 5.1).
Considering the evaluation, we see that the partic-
ipants generally found the guidelines useful for con-
ducting UX Research activities and expressed inter-
est in utilizing them in the future (see Figures 2 and
3). This overview suggests a positive reception of
the guidelines and the catalog among professionals in
the software industry. Our results also revealed that
novices recognize the guidelines and the catalog as a
valuable resource to assist them in their daily work
(see Section 5.1).
We also verified whether the participants’ profes-
sional profiles impacted the guidelines’ acceptance.
We considered the company type they worked for, i.e.,
startups or established companies, and their years of
experience (see Section 5.2). From statistical tests, we
concluded that the participants’ profiles did not sig-
nificantly impact the acceptance of guidelines. This
confirmed that the guidelines can be adopted by pro-
fessionals of different job positions and from different
companies.
7 CONCLUSION AND FUTURE
WORK
In this paper, we presented a set of 14 guidelines
to support software professionals in the implemen-
tation of UXR practices. The guidelines were elab-
orated based on extractions from the literature that
considered UXR practices applied in the industry.
The guidelines were grouped into categories and pre-
sented recommendations for applying UX Research
methods and techniques. We developed an online
interactive catalog to make it accessible from the
web. We evaluated the acceptance of guidelines with
32 UX and software professionals who worked from
both startups and established companies.
The results showed that our guidelines were useful
for professionals from startups and established com-
panies, regardless of their experience levels in the
software industry. Participants from both groups ex-
pressed positive feedback about the tool’s ease of use,
perceived usefulness, and use intention. As positive
points, the professionals were enthusiastic about us-
ing the catalog and highlighted the quality of the con-
tent in the GURiP tool. However, the amount of text
in the guidelines, the navigation of the catalog, and
the color contrast of the texts are negative points of
the GURiP tool from professionals.
As contributions, our study provides evidence that
the guidelines are beneficial for professionals en-
gaged in UX Research activities, particularly for be-
ginners. These initiatives aim to address an identi-
fied gap in the literature by offering practical support
and guidance to professionals, especially those in the
early stages of their careers. In future work, we plan
an assessment to check whether the suggested prac-
tices, methods, and techniques can meet the needs of
UX Research. Besides, we will conduct a usability
evaluation of the online catalog.
ACKNOWLEDGEMENTS
We thank the support of grant #2020/11441-1,
S
˜
ao Paulo Research Foundation (FAPESP), grant
309497/2022-1 and 147915/2022-8, Conselho Na-
cional de Desenvolvimento Cient
´
ıfico e Tecnol
´
ogico
(CNPq - Brazil), and grant by the Coordenac¸
˜
ao
de Aperfeic¸oamento de Pessoal de N
´
ıvel Superior -
Brasil (CAPES) - Finance Code 001.
Guiding the Adoption of UX Research Practices: An Approach to Support Software Professionals
483

REFERENCES
Alhadreti, O. (2020). Exploring UX Maturity in Software
Development Environments in Saudi Arabia. Inter-
national Journal of Advanced Computer Science and
Applications (IJACSA), 11(12):168–174.
Charmaz, K. (2006). Constructing Grounded Theory: A
Practical Guide through Qualitative Analysis. Sage
Publications.
Charters, E. (2003). The use of think-aloud methods
in qualitative research an introduction to think-aloud
methods. Brock Education Journal, 12(2).
Corbin, A. S. (1998). Basics of qualitative research: Tech-
niques and procedures for developing grounded the-
ory. Citeseer.
Davis, F. D. (1989). Perceived Usefulness, Perceived Ease
of Use, and User Acceptance of Information Technol-
ogy. MIS Quarterly, Vol. 13, No. 3, pages 319–340.
Dias, G. A., da, S. P. M., Delfino Jr., J. B., and Almeida, J.
R. d. (2011). Technology Acceptance Model (TAM):
avaliando a aceitac¸
˜
ao tecnol
´
ogica do Open Journal
Systems (OJS). Informac¸
˜
ao & Sociedade: Estudos,
21(2).
Farrell, S. (2017). UX Research Cheat Sheet. https://
www.nngroup.com/articles/ux-research-cheat-sheet/.
Nielsen Norman Group (NNGroup). Online; accessed
22 March 2021.
Garland, R. (1991). The mid-point on a rating scale: Is it
desirable. Marketing bulletin, 2(1):66–70.
Gibbs, G. (2018). Analyzing Qualitative Data. SAGE Pub-
lications Ltd, 2 edition.
Hassenzahl, M. (2018). The Thing and I (Summer of ‘17
Remix): From Usability to Enjoyment. Springer In-
ternational Publishing, page 17–31.
Hokkanen, L. and V
¨
a
¨
an
¨
anen-Vainio-Mattila, K. (2015). UX
Work in Startups: Current Practices and Future Needs.
In Agile Processes in Software Engineering and Ex-
treme Programming, pages 81–92, Cham. Springer In-
ternational Publishing.
Johns, R. (2005). One Size Doesn’t Fit All: Selecting Re-
sponse Scales For Attitude Items. Journal of Elec-
tions, Public Opinion and Parties, 15(2):237–264.
Kashfi, P., Feldt, R., and Nilsson, A. (2019). Integrating UX
principles and practices into software development or-
ganizations: A case study of influencing events. Jour-
nal of Systems and Software, 154:37–58.
Kervyn de Meerendr
´
e, V., Rukoni
´
c, L., and Kieffer, S.
(2019). Overcoming Organizational Barriers to the In-
tegration of UX Methods in Software Development: A
Case Study. In Design, User Experience, and Usabil-
ity. Practice and Case Studies, volume 11586, pages
263–276, Cham. Springer International Publishing.
Kieffer, S., Rukonic, L., de Meerendr
´
e, V. K., and Vander-
donckt, J. (2019). Specification of a UX Process Ref-
erence Model towards the Strategic Planning of UX
Activities. In Proceedings of the 14th International
Joint Conference on Computer Vision, Imaging and
Computer Graphics Theory and Applications (VISI-
GRAPP 2019), volume 2, pages 74–85. SCITEPRESS
– Science and Technology Publications.
Kitchenham, B. and Charters, S. (2007). Guidelines for
performing Systematic Literature Reviews in Soft-
ware Engineering. Technical Report EBSE 2007-001,
Keele University and Durham University Joint Report.
Majrashi, K. and Al-Wabil, A. (2018). HCI Practices in
Software-Development Environments in Saudi Ara-
bia. In Cross-Cultural Design. Methods, Tools, and
Users (CCD 2018), pages 58–77, Cham. Springer In-
ternational Publishing.
Martinelli, S., Lopes, L., and Zaina, L. (2022). UX Re-
search in the Software Industry: An investigation of
Long-Term UX practices. Proceedings of the 21st
Brazilian Symposium on Human Factors in Comput-
ing Systems.
Mehta, C. and Patel, N. (1996). SPSS exact
tests. https://www.ibm.com/docs/en/SSLVMB 27.0.
0/pdf/en/IBM SPSS Exact Tests.pdf. Online; ac-
cessed 01 September 2023.
Meingast, M., Packard, H., Ballew, T., Edwards, R.,
Nordquist, E., Sader, C., and Smith, D. (2013). Ag-
ile and UX: The Road to Integration The Challenges
of the UX Practitioner in an Agile Environment. In
Proceedings of the Human Factors and Ergonomics
Society Annual Meeting, pages 1002–1006. Scopus.
Oliveira, S., Cristo, A., Geovane, M., Xavier, A., Silva, R.,
Rocha, S., Marques, L., Gomes, G., Gadelha, B., and
Conte, T. (2023). UXNator: A Tool for Recommend-
ing UX Evaluation Methods. Proceedings of the 25th
International Conference on Enterprise Information
Systems (ICEIS 2023), 2:336,343.
Pazitka, K. (2019). The UX Research Methods Ev-
ery Designer Needs To Know. https://youtu.be/
gGZGDnTY454?si=E84qMmkEue2f7wvk. Career-
Foundry, 2019. Online; accessed 22 March 2021.
Rivero, L. and Conte, T. (2017). A Systematic Mapping
Study on Research Contributions on UX Evaluation
Technologies. In XVI Brazilian Symposium on Human
Factors in Computing Systems, page 10, New York,
NY, USA. Association for Computing Machinery.
Schmidt, M. (2008). The Sankey diagram in energy and
material flow management: Part II: Methodology and
current applications. Journal of industrial ecology,
12:173–185.
Shapiro, S. S. and Wilk, M. B. (1965). An Analysis
of Variance Test for Normality (Complete Samples).
Biometrika, 52(3/4):591–611.
Silveira, S., Choma, J., Pereira, R., Guerra, E., and Zaina, L.
(2021). UX Work in Software Start-Ups: Challenges
from the Current State of Practice. International Con-
ference on Agile Software Development, pages 19–35.
S
¨
uner-Pla-Cerd
`
a, S., T
¨
ore Yargın, G., S¸ahin, H., and Danıs¸,
S. (2021). Examining the impact of covid-19 pan-
demic on ux research practice through ux blogs. In
Design, User Experience, and Usability: UX Re-
search and Design, volume 12779, pages 579–592,
Cham. Springer International Publishing.
Venkatesh, V. and Bala, H. (2008). Technology acceptance
model 3 and a research agenda on interventions. De-
cision sciences, 39(2):273–315.
Wohlin, C., Runeson, P., H
¨
ost, M., Ohlsson, M. C., Reg-
nell, B., and Wessl
´
en (2012). A Experimentation in
software engineering. Springer Science & Business
Media.
ICEIS 2024 - 26th International Conference on Enterprise Information Systems
484
