
Advancements in Household Data Mining: Fine-Tuning of Usage Pattern
Inference Pipeline
Ramona Tolas
a
, Raluca Portase
b
and Rodica Potolea
c
Technical University of Cluj-Napoca, Romania
Keywords:
Usage Mining, Time Series Feature Extraction, Synthetic Household Data Generation, Wavelet Transform,
Dimensionality Reduction.
Abstract:
In the era of rapidly expanding smart household devices, a surge in data generation within domestic environ-
ments has occurred. This paper focuses on optimizing knowledge inference methods from this rich household-
generated data, building upon our earlier work for uncovering intricate usage patterns. This work addresses
non-functional requirements, emphasizing data processing efficiency by introducing innovative techniques for
dimensionality reduction. Another contribution of this research is the formalization of a synthetic data gen-
eration process, crucial for comprehensive testing and data privacy compliance. Overall, this work advances
household data mining by refining usage pattern inference pipeline, enhancing performance, and providing a
framework for synthetic data generation.
1 INTRODUCTION
In an era characterized by the rapid growth of smart
household devices, the generation of household data
has witnessed an unprecedented surge. Today, mod-
ern homes are equipped with an assortment of inter-
connected sensors and intelligent appliances, collec-
tively producing complex and voluminous data. This
wealth of information, often extending beyond the ini-
tial scope envisioned for these household sensors, has
the potential to unlock valuable insights and knowl-
edge.
This work is focused on optimizing the identifica-
tion and extraction of usage patterns from household-
generated data. At its core, our objective lies in ex-
panding on the result of our earlier work, enhanc-
ing the proposed processing pipeline dedicated to un-
raveling the intricate behaviors and habits encoded
within this data. Beyond the mere refinement of the
process itself, we tackle the topic of non-functional
requirements, acutely aware that the efficiency and
performance of data processing hold significant im-
portance in an era characterized by the surging tide
of information. In this context, we address the crit-
ical dimensionality challenge by introducing innova-
tive techniques that reduce the size of the data, thus
significantly enhancing the pipeline’s performance.
a
https://orcid.org/0000-0002-6236-1114
b
https://orcid.org/0000-0002-8985-4728
c
https://orcid.org/0000-0002-7051-3691
Moreover, recognizing the need for rigorous vali-
dation and experimentation, we formalize a synthetic
data generation process. This step not only facilitates
comprehensive testing but also plays a pivotal role in
preserving data privacy and security, two paramount
considerations in the topic of household data mining,
especially in the topic of recent laws that protect the
usage of data, such as GDPR (General Data Protec-
tion Regulation).
By refining the usage pattern inference pipeline,
optimizing performance, and offering a structured ap-
proach to synthetic data generation, we not only seek
to push the boundaries of knowledge extraction but
also to empower the ever-evolving landscape of pat-
tern mining.
The rest of this paper is organized as follows. In
Section 2, we provide an in-depth exploration of the
related work done in the business domain of house-
hold data processing. Section 3 delves into the the-
oretical aspects. Moving forward, in Section 4, we
present the improved pipeline and in Section 5 we ex-
plore its efficiency with experiments and presentation
of the results. The last section is reserved for conclu-
sions and proposals for future work.
Tolas, R., Portase, R. and Potolea, R.
Advancements in Household Data Mining: Fine-Tuning of Usage Pattern Inference Pipeline.
DOI: 10.5220/0012598000003705
Paper published under CC license (CC BY-NC-ND 4.0)
In Proceedings of the 9th International Conference on Internet of Things, Big Data and Security (IoTBDS 2024), pages 53-61
ISBN: 978-989-758-699-6; ISSN: 2184-4976
Proceedings Copyright © 2024 by SCITEPRESS – Science and Technology Publications, Lda.
53

2 THEORETICAL BACKGROUND
AND RELATED WORK
Smart devices represent nowadays an important
source for knowledge inference as shown in multi-
ple studies focused on extracting valuable information
from data generated by smart home appliances (Lloret
et al., 2016), (Tolas et al., 2023), (Portase et al., 2023).
A methodology for handling complex data, partic-
ularly data originating from home appliances is intro-
duced by (Portase et al., 2021), while in (Tolas et al.,
2021), the authors tackle the same topic, but from a
data transmission view. The authors demonstrate how
recognizing periodicity in signal transmission can be
utilized to identify missing data and data duplication
within the context of data generated by home appli-
ances. Modern approaches for preprocessing data,
applied to session-based data (such as the running cy-
cle of a washing machine), are discussed in (Olariu
et al., 2020). Additionally, in (Chira et al., 2020), the
authors present a data processing pipeline designed
for sensor-generated data, with applications in data
produced by home appliances. Knowledge inference
techniques are explored in (Firte et al., 2022), while
(Portase et al., 2023) presents a comprehensive end-
to-end pipeline for usage prediction.
In the current era, marked by the exponential gen-
eration of voluminous data from intelligent devices,
the careful selection of appropriate tools has an im-
portant significance. In accordance with the specific
task at hand, the choice of algorithms becomes a crit-
ical determinant. Pattern recognition and extracting
usage patterns represent an example of a processing
step for extracting insights from such data.
2.1 Tools for Recognizing Patterns in
Time-Series
A common way of storing this kind of data is in the
syntactical form of time series. This is acknowledged
by numerous studies from the literature (Aljawarneh
et al., 2016), (Rodr
´
ıguez Fern
´
andez et al., 2016). This
syntactical form is classified by (Lin et al., 2012) as
the most commonly encountered data type. Given this
popularity, approaches for pattern recognition applied
to this type of data are in the attention of both the aca-
demic and industrial world. This lead to the existence
of various reliable and well tested processing frame-
works and libraries (Pandas, 2022), (Numpy, 2022),
(Pedregosa et al., 2011).
Pattern recognition in time series data can be ac-
complished through various methods, including dy-
namic time warping (DTW), hidden Markov mod-
els (HMMs), support vector machines (SVMs), and
convolutional neural networks (CNNs), each tailored
to capture distinct temporal features and complexi-
ties. These methods enable the detection and clas-
sification of temporal patterns, fostering applications
across domains like finance, healthcare, and environ-
mental monitoring (Milillo et al., 2022), (P
´
ealat et al.,
2022).
Neural networks have gained widespread popu-
larity in contemporary research and applications due
to their demonstrated efficacy in delivering robust re-
sults (Bishop, 1995), making them a prevalent choice
for deployment in the field of pattern recognition
(Karim et al., 2019), (Patro et al., 2022). However,
it is essential to acknowledge that traditional methods
such as clustering techniques offer a compelling al-
ternative, especially when dealing with datasets char-
acterized by well-defined clusters and structured pat-
terns, potentially making them a more suitable choice
for specific pattern recognition scenarios. The adapt-
ability of such methods to data without labels attached
is also a significant advantage.
Feature extraction from time series data plays a
pivotal role in uncovering meaningful patterns and es-
sential insights such as usage patterns. Fast Fourier
Transform and Wavelet Transform are widely em-
ployed techniques for feature extraction from time se-
ries data. They serve as essential tools in uncovering
meaningful patterns and characteristics within diverse
temporal datasets across various domains. FFT pri-
marily operates in the frequency domain, providing
information about the dominant frequencies present
in the time series data. It is well-suited for capturing
periodic patterns. Wavelet Transform operates in the
time-frequency domain, offering time-localized infor-
mation about the data’s frequency components.
2.2 Wavelet Transform
A Wavelet Transform decomposes a function into a
set of wavelets. A Wavelet is an oscillation that is lo-
calized in time. Wavelets have two basic properties:
scale and location. This makes the wavelet transform
to gather information not only about the frequency
present in the signal but also about its temporal lo-
cation in the signal.
For a complete understanding of the theory behind
the selection of the Wavelet transform a script is de-
veloped, in order to have a visual representation of
the concepts. We combine two signals and we apply
FFT and Wavelet Transform on the composed signal.
In Figure 1 it can be seen the first set of experiments.
We combine a sinusoidal signal with a signal of a dif-
ferent frequency, but the second signal has values dif-
ferent than zero only after a threshold. In Figure 2
IoTBDS 2024 - 9th International Conference on Internet of Things, Big Data and Security
54
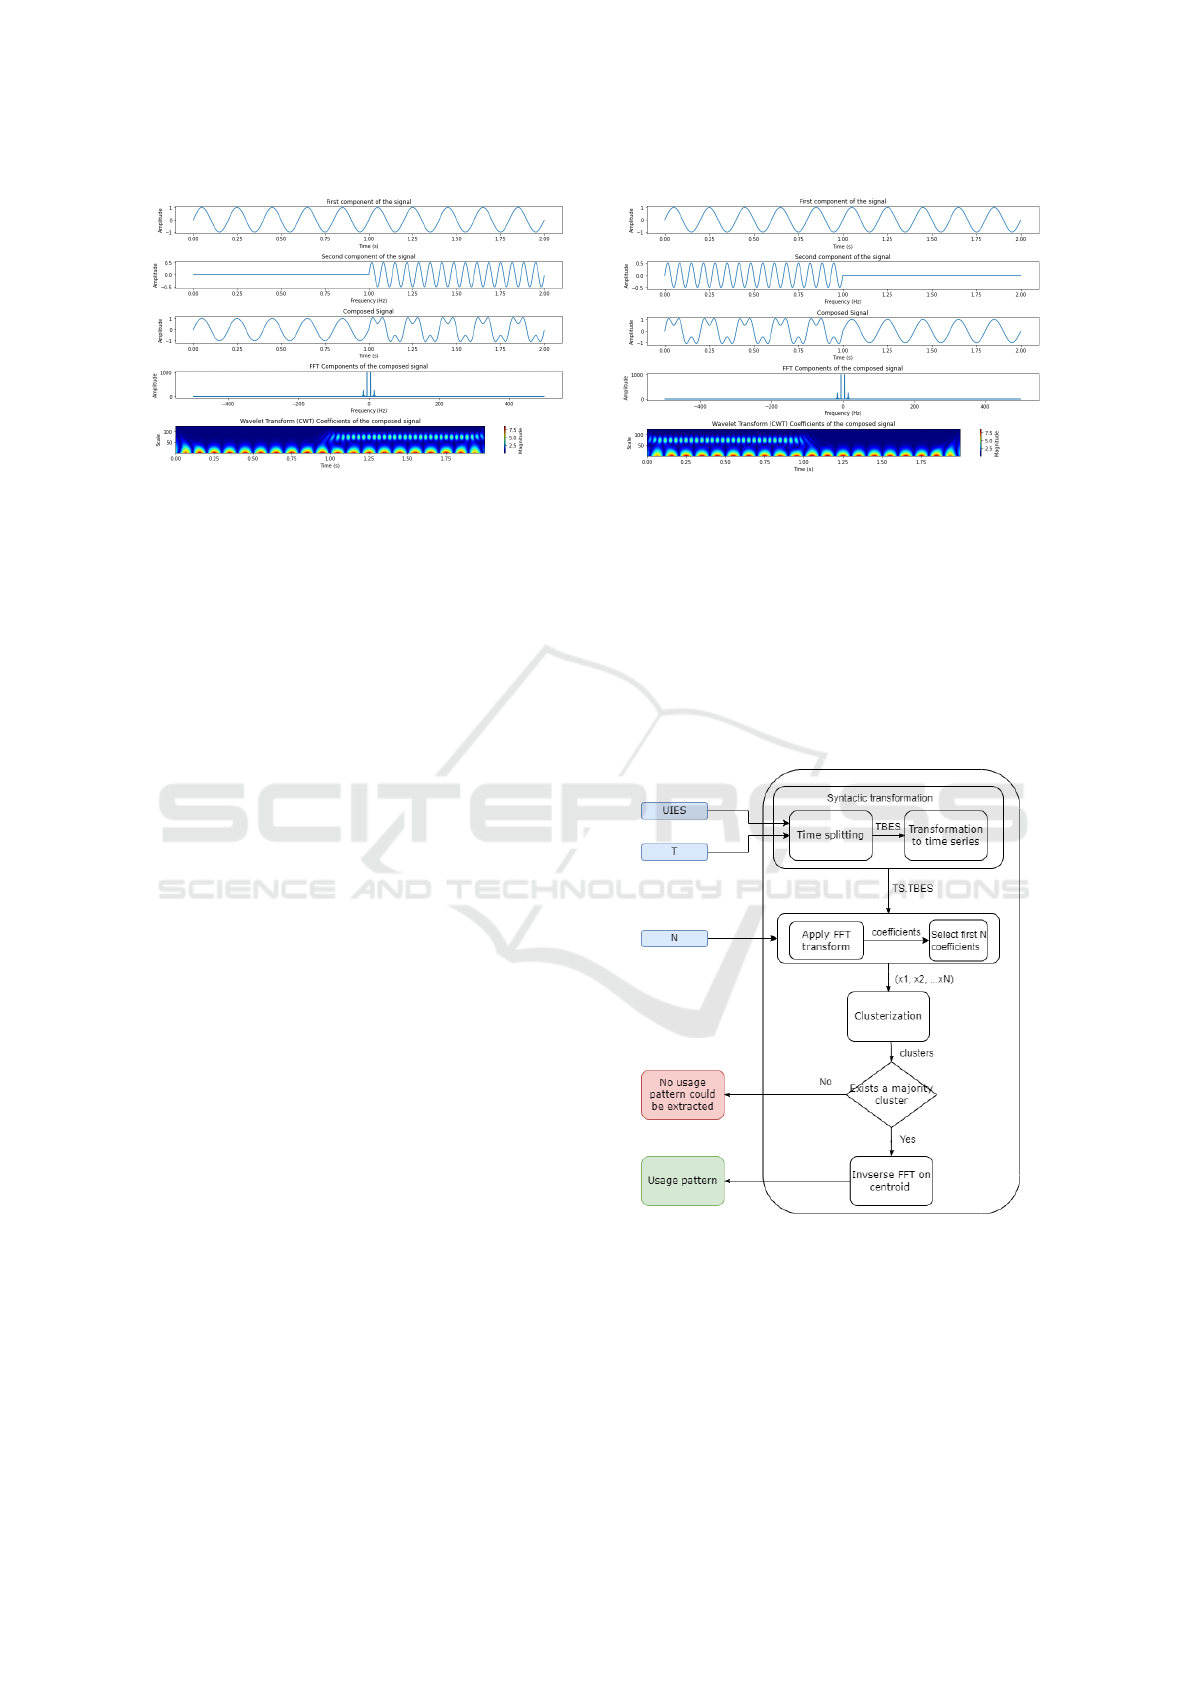
Figure 1: In this figure we can see a composed signal (third
signal from the figure) that is obtained by combining a sig-
nal of a frequency of 5 Hz and amplitude equal to 1 (first
signal from the figure) with a signal characterized by fre-
quency equal to 15 Hz and amplitude equal to 2 if the time
variable is greater than 1. The second signal has a value of
zero, otherwise. The fourth component of the Figure is the
result of the FFT transform applied to the composed signal.
The last component of the Figure is the result of the Wavelet
Transform applied to the composed signal.
we combine the same signals, but the second signal
has oscillations before the threshold and they stop af-
ter the threshold. The combined signals are different
signals and an efficient feature extraction step applied
to those signals should give different representations
of the signals.
We can see that applying FFT transform is not
efficient in this task because the FFT representation
of both signals is the same. This is a consequence
of the fact that the same frequencies are composing
the analyzed signal, but they are placed differently
in time. Applying wavelet transform on the signals,
yields however a different representation of the sig-
nals, as can be observed from Figure 1 and Figure 2.
The focus of this work is to use these theoretical
aspects to improve the efficiency of the usage mining
pipeline discussed in the previous section.
3 PROBLEM STATEMENT
In our prior research (Tolas et al., 2023), we presented
initial results related to the identification of one spe-
cific usage pattern in historical data. The subsequent
section will provide a discussion of the solution and
its limitations.
In Figure 3, the proposed pipeline for mining user
behavior proposed in (Tolas et al., 2023) is presented.
The pipeline aims to process data obtained from the
interactions of the users with home appliances. The
input for the pipeline is represented by UIES (user in-
teraction event series). The events are split into time
Figure 2: In this figure we can see a composed signal (third
signal from the figure) that is obtained by combining a sig-
nal of a frequency of 5 Hz and amplitude equal to 1 (first
signal from the figure) with a signal characterized by fre-
quency equal to 15 Hz and amplitude equal to 2 if the time
variable is less than 1. The second signal has a value of zero,
otherwise. The fourth component of the Figure is the result
of the FFT transform applied to the composed signal which
is the same as the FFT transform applied on the composed
signal described in 1. The last component of the Figure is
the result of the wavelet transform applied to the composed
signal, which is different than the Wavelet Transform ap-
plied on the composed signal described in Figure 1.
Figure 3: Usage pattern inference pipeline proposed in work
(Tolas et al., 2023).
intervals based on the input parameter T, obtaining
TBES (time-boxed event series) representation of the
data. A syntactical transformation is applied to the
data and the interaction of the user with the home ap-
pliance is represented at the end of the syntactic trans-
formation step in time series (TS.TBES). Follow-
Advancements in Household Data Mining: Fine-Tuning of Usage Pattern Inference Pipeline
55
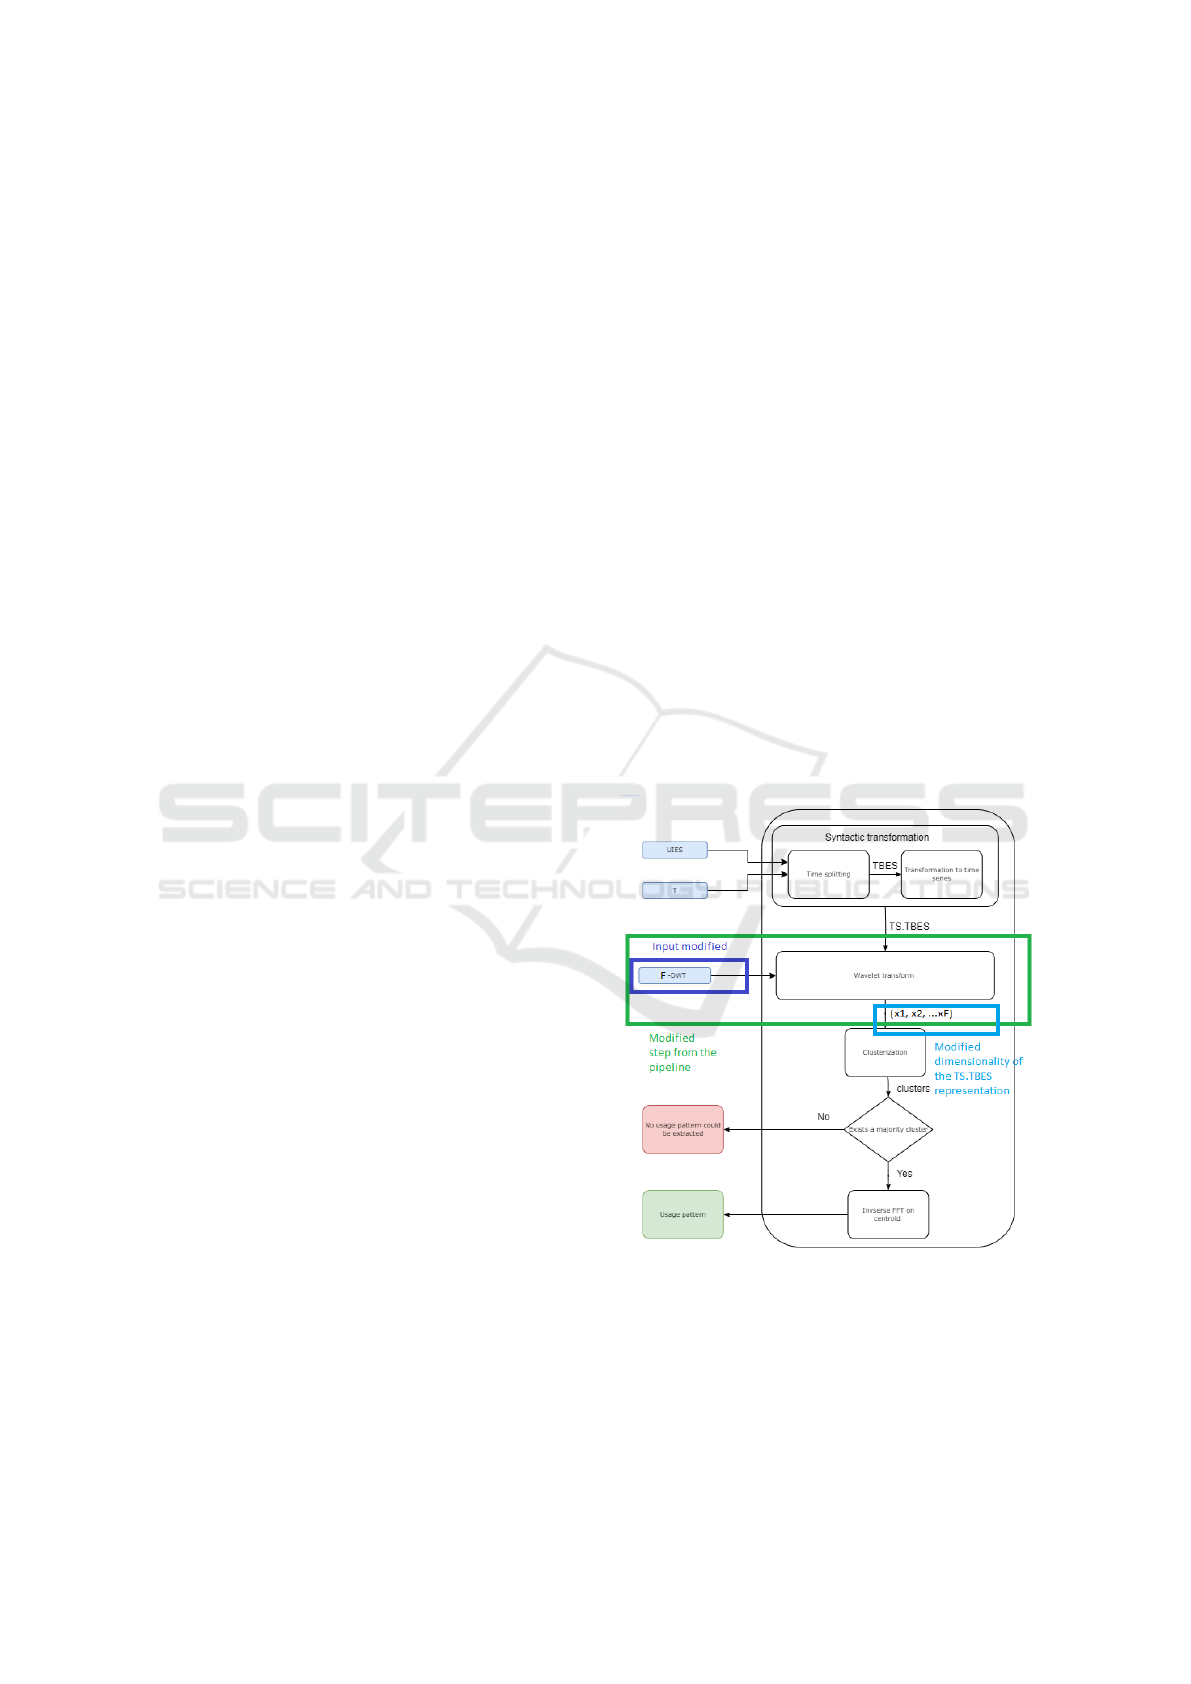
ing the syntactic transformation is a processing step
consisting of applying FFT (Fast Fourier Transform)
(Brigham and Morrow, 1967). Combined with N, an
input parameter that represents the number of coeffi-
cients that are used by the algorithm, each TS.TBES is
represented by an array of numerical values. A clus-
tering step is considering this data as input. After the
clustering, a majority cluster is selected, if it exists.
This cluster is the cluster with the most number of
instances from the dataset. Inverse FFT is used for
transforming the centroid of the majority cluster into
a usage pattern.
The presented processing pipeline demonstrates
significant value to the scientific field, offering a re-
liable methodology for processing any kind of event-
based generated data and mining usage behavior.
However, it is essential to recognize that no approach
is without its limitations. While the pipeline excels
in many scenarios, as shown by the authors, we have
identified specific situations where its effectiveness
may be constrained.
These limitations are sourced by the usage of FFT
for extracting the features from the TS.TBES. We
claim that in scenarios where the same pattern is
slightly shifted in time the algorithm does not per-
form at its best. An example of such a scenario is an
alternation to the dataset identified by 1-AP
1
in (Tolas
et al., 2023). This is a dataset representing the in-
teraction of a user with a smart home appliance con-
sisting of a planted usage pattern which assumes that
the user is interacting with the smart device in one es-
tablished time-window of the day. However, even if
scenarios such as this one, are possible in the context
of well-established work schedules of the users, it is
very likely to have small time shifting in the pattern.
For example, if the dataset 1-AP
1
would represent the
interaction of a user with a device that happens in the
morning, we want to make sure that all the days rep-
resenting this interaction are grouped together even
if in some mornings the interactions happen not at 9
AM as usual, but at 9:30 AM. Also, if the user has
two patterns of using the appliance influenced by the
work schedule (the home-appliance might be a smart
fridge and the user is interacting with it during the
weekdays in the morning for breakfast and during the
weekends only in the evening) we want to make sure
that those patterns are clearly separated by the cluster-
ing phase even if the interaction itself is similar (the
user is opening the appliance two or three times with
similar frequency), but its position in time is making
the difference. These challenges present opportunities
for further refinement and innovation in our approach.
To address these limitations and ensure the appli-
cability of the pipeline across a broader range of sce-
narios, we propose the following improvement: re-
placing the FFT transformation step with a Wavelet
transform step.
By implementing these enhancements, we aim to
make a more versatile and robust processing pipeline
for extracting usage patterns, enabling its success-
ful application in a wider array of scientific contexts.
Through ongoing research and development, we as-
pire to continually improve and adapt our methodol-
ogy to meet the evolving needs of the scientific com-
munity.
4 PROPOSED PIPELINE FOR
EFFICIENT MINING OF USAGE
PATTERNS
Figure 4 presents a new pipeline for extracting a us-
age pattern from event-based historical data. It high-
lights the modifications brought to the baseline pro-
cessing pipeline. The initial configuration is modified
by replacing the feature extraction step from the time
series. The new proposed processing pipeline is iden-
tified in the rest of this work by APUPM (Advanced
Pipeline for Usage Pattern Mining).
Figure 4: Adaptation of the usage pattern inference
pipeline. The steps from the pipeline which are subject to
the improvements proposed in this paper are highlighted.
One of the most significant advantages of WT
(Wavelet Transform) is its ability to provide time-
frequency localization. Unlike FFT, which represents
a signal solely in the frequency domain, the Wavelet
IoTBDS 2024 - 9th International Conference on Internet of Things, Big Data and Security
56

Transform captures both time and frequency informa-
tion. Also, the Wavelet Transform adapts to the local
characteristics of a signal. This adaptability makes
it well-suited for handling signals with irregularities,
spikes, or discontinuities, which can be challenging
for FFT.
Another aspect that we want to focus on is the vol-
ume of the TS.TBES representation. The WT pro-
vides a sparse representation of a signal and therefore
a significant portion of the coefficients is close to zero,
making it efficient for data compression. We claim
that by replacing the FFT step with the Wavelet trans-
form we can encode the same information needed for
clustering but with fewer coefficients. This has the
advantage of significantly decreasing the overall pro-
cessing time.
As a consequence of the modified processing
step, the input for the feature extraction phase of the
pipeline is also modified. The input that was used
to control the number of coefficients from the FFT
transform that are used for representing a TS.TBES is
replaced with F-DWT. This input represents the num-
ber of components from the Wavelet Transform that
are included in the representation of the TS.TBES.
Depending on the complexity of the patterns, a cer-
tain level of detail components need to be included or
excluded.
The rest of the steps from the usage mining
pipeline remain the same as in the pipeline proposed
by (Tolas et al., 2023).
5 EXPERIMENTS AND RESULTS
This section explores the efficiency of the proposed
pipeline by presenting a series of experiments.
5.1 Dataset Description and Generation
Process
In order to prove the efficiency of the proposed im-
provements brought to the usage patterns inference
pipeline, a synthetic data set is used. The generation
of the data follows the same procedure as the datasets
used for validation by (Tolas et al., 2023) consisting
on planted behavioral patterns in data generated by
a smart refrigerator. The time parameter chosen for
the experiments is one day, hence daily usage patterns
will be processed in the experiments.
The syntactic form of the input data is represented
by user interaction events of type Door Open. These
events are triggered by the user of the smart refriger-
ator when an interaction (open or closing the device
door) is occurring. A synthetic data generation model
is proposed after inspecting real data. We preserved
the precise syntactical structure found in real-world
data. At a semantic level, we constructed several de-
scriptors of the real data which we later applied in the
generation process. The duration of keeping the door
open, the frequency of opening the door during ac-
tive periods (AP), the frequency of opening the door
outside AP are examples of such descriptors.
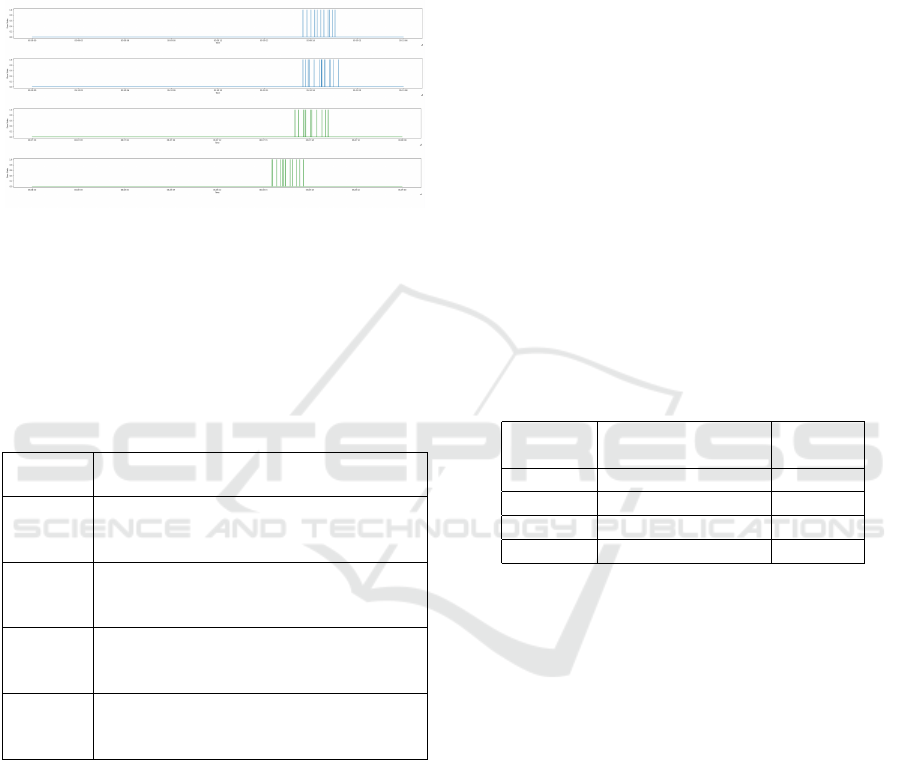
For the experiments performed, four data sets are
generated. Table 1 contains a description of the pat-
terns planted in each dataset. We used the AP as an
identifier for an active period. This concept refers to
a period from the day when the user is actively in-
teracting with the device. Outside active periods, the
interaction of the user with the device is considered
only an exception (or it can appear in the usage his-
tory as a consequence of noise addition). At a con-
crete level, a user who opens the fridge only in the
morning for breakfast preparation is generating events
of user interaction with the smart refrigerator charac-
terized by 1-AP. A user who actively uses the device
during the morning and the evening for dinner prepa-
ration is producing a 2-AP dataset (each day from the
dataset is characterized by two active periods). These
behaviors are visually represented in Figure 5.
Figure 5: Visual representation of the events generated by
the user interaction with the smart refrigerator characterized
by 1-AP (first) and 2-AP (second). On the OX axis, it is
represented the time, bounded to one day. On the OY axis
is represented numerically the state of the door: 0 if it is
closed and 1 if it is open. A transition from 0 to 1 means
that the user is opening the door. A transition from 1 to 0
occurs when the user is closing the door.
Another key descriptor for the datasets is S and
D. This part of the identifier of each dataset refers
to the strategy used for placing in time each AP. S
stands for same, meaning that each day characterized
by an N-AP has the APs starting at approximately the
same time. The approximation is given by the noise
added to the data generation process. D represents a
model where an AP is placed at different times during
the day. This different time is determined by a time
delta. This parameter is useful for covering complex
but real use cases. It is often that the user has a usage
pattern such as using the refrigerator each morning
but the effective usage starts at a different time in the
morning. The delta should be chosen such that the AP
remains relevant. For a big value for the time place-
ment delta, the pattern is lost or it is too general (given
Advancements in Household Data Mining: Fine-Tuning of Usage Pattern Inference Pipeline
57
a time placement delta of 12 hours for an AP, there
is no pattern to be found other than the fact that the
user is using the device in that interval). The complex
nature of the data brought by this factor is important
for proving the improvements added to the process-
ing pipeline and for emphasizing the initial pipeline
limitations.
Figure 6: Visual representation of the user interaction
events with a 2-AP model. On the OX axis, it is represented
the time, bounded to one day. On the OY axis is represented
numerically the state of the door: 0 if it is closed and 1 if it
is open. The blue coloring scheme represents two days from
a 2 − AP
S
model where the placement of the AP during the
day is the same for all the days following this model. With
green are represented two snapshots from a 2 − AP
D
model
where the same AP is placed at different starting times.
Table 1: Datasets used in the experiments performed.
Dataset Description
identifier
1AP
S
Each day contains one active period.
Time placement of the AP during the day
is the same.
2AP
S
Each day contains two active periods.
Time placement of the AP during the day
is the same.
1AP
D
Each day contains one active period.
Time placement of the AP during the day
is different.
2AP
D
Each day contains two active periods.
Time placement of the AP during the day
is different.
Each dataset contains data generated for a period
of usage of six months. Noise was added in the same
proportion to all of the datasets represented by the
probability of missing an AP for a model. The proba-
bility of missing an AP from the generation model is
10%. For the datasets where the D generation model
is used, a time placement delta of two hours is con-
figured. All generated datasets are programmatically
constructed in two patterns: in three days from the
week the N-AP pattern is placed in one period of the
day and in the rest of the days the N-AP pattern is
placed in a different time. An ideal result of the pro-
cessing pipeline would be to split the entire dataset
in two clusters, each one corresponding to one of the
planted usage models.
5.2 Support of Complex Scenarios and
Enhanced Performance
This work is focused on the consequences brought
by replacing the feature extraction step from the us-
age pattern mining pipeline proposed by (Tolas et al.,
2023). That step is highly influencing the clustering
performance, which is the next step in the pipeline.
The effect of the feature extraction step modification
can be evaluated and discussed based on the perfor-
mances of the clustering process. To have a common
baseline, F1-score is used as an evaluation metric be-
cause it is also used by (Tolas et al., 2023) for evalu-
ating the initial pipeline performances.
In Table 2, a complete evaluation of the initial
pipeline proposed by (Tolas et al., 2023) and our
pipeline is presented. Our pipeline is identified by the
APUPM.
Table 2: Comparison of the evaluation results of APUPM
pipeline compared with the processing pipeline proposed
by (Tolas et al., 2023).
Dataset F1-score F1-score
identifier (Tolas et al., 2023) APUPM
1AP
S
0.997 1.0
2AP
S
0.988 0.994
1AP
D
0.997 1.0
2AP
D
0.409 0.933
We observe that for simple usage patterns like
1AP
S
and 1AP
D
the pipeline proposed by (Tolas et al.,
2023) is performing very well. Even these good re-
sults are outperformed by the APUPM pipeline. For
more complex patterns like 2AP
S
, the APUPM ob-
tains an increase in performance of 0.6%. The signif-
icant impact is however emphasized by the last use-
case. The initial pipeline fails when applied to 2AP
D
dataset. The poor F1-score shows that the pipeline is
not capable of splitting the dataset in the two clusters
by using the proposed approach. With the enhance-
ments brought by this work, we can observe that re-
sults are greatly improved. An increase of 52.4% is
observed in this case.
Plotting the PCA (Principal Components Analy-
sis) components can be a useful way to visualize and
understand how a clustering algorithm is characteriz-
ing the data. For this analysis, the first two principal
components (PC1 and PC2) are computed for each of
the use cases in order to visually compare the APUPM
pipeline with the existing state of the art in this do-
main. An effective clustering algorithm (directly in-
IoTBDS 2024 - 9th International Conference on Internet of Things, Big Data and Security
58
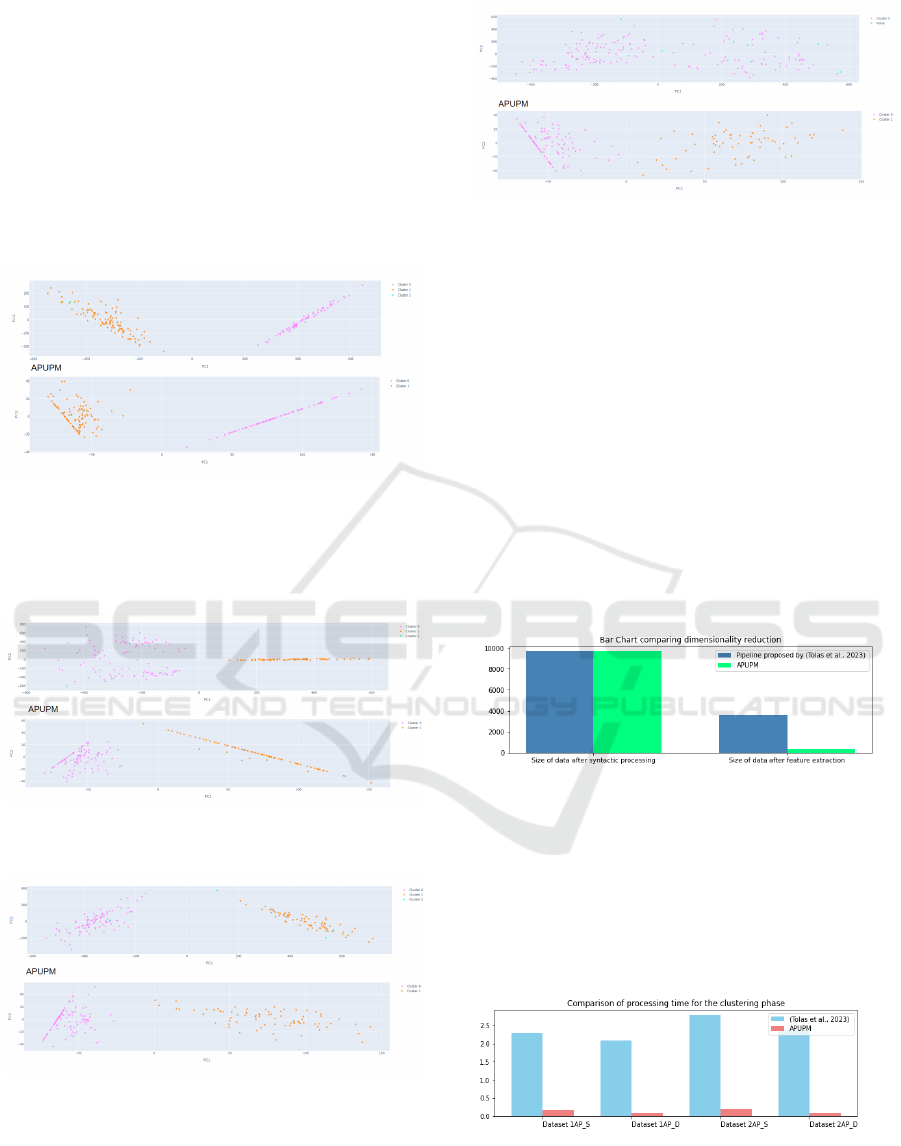
fluenced by the feature extraction step) should gener-
ate well-defined and distinct clusters in the PC1-PC2
plot. As the clustering setup was the same, the actual
comparison is made for the feature extraction step.
The plot is also helpful for observing cluster density,
another visual indicator of the feature extraction effi-
cacy.
In Figure 7, Figure 8, Figure 9 and Figure 10 the
PC1-PC2 plots are generated for the clusters obtained
by applying both processing pipelines on each of the
datasets.
Figure 7: PC1-PC2 plot for clusters obtained after applying
the usage mining processing pipeline on 1AP
S
dataset. The
processing pipeline proposed by (Tolas et al., 2023) gener-
ates the first PC1-PC2 plot while the second is obtained by
applying the APUPM pipeline.
Figure 8: PC1-PC2 plot for clusters obtained after applying
the usage mining processing pipeline on 1AP
D
dataset.
Figure 9: PC1-PC2 plot for clusters obtained after applying
the usage mining processing pipeline on 2AP
S
dataset.
Figure 10: PC1-PC2 plot for clusters obtained after apply-
ing the usage mining processing pipeline on 2AP
D
dataset.
It can be observed that the APUPM pipeline succeeds to
split the sparse data into two clusters, while the pipeline
proposed by (Tolas et al., 2023) is computing a single clus-
ter (also containing noise points).
5.3 Addressing Dimensionality
Reduction
Altering the pipeline by replacing the FFT transform
with a Wavelet Transform brings benefits beyond the
initial scope of addressing complex situations and im-
proving performance, as it can be observed in Figure
11. In an era characterized by large volumes of data,
the dimensionality of the data is a critical aspect.
The results reported in the previous section are ob-
tained by using the first component of the WT.
Figure 11: Dimensionality reduction shown by comparing
the dimension of one dataset before applying the feature ex-
traction step and after.
In Figure 12, the processing time of the pipeline
proposed by (Tolas et al., 2023) and the APUPM are
compared. The clustering time is considered. As we
can see, the processing time for APUPM are signifi-
cantly reduced in all of the four use-cases.
Figure 12: Comparison of the APUPM processing pipeline
and the pipeline proposed by (Tolas et al., 2023) from the
time processing of clustering phase perspective.
Advancements in Household Data Mining: Fine-Tuning of Usage Pattern Inference Pipeline
59

6 CONCLUSIONS AND FUTURE
WORK
In conclusion, this paper presents a rich spectrum
of contributions, addressing several aspects of home
appliance-generated data processing.
Firstly, it introduced significant enhancements to
an existing processing pipeline, not only improving its
overall performance but also rendering it more adapt-
able to the demands of today’s data-intensive sce-
nario.
Secondly, the paper delved into the domain of di-
mensionality reduction, a pivotal technique for ex-
pediting data processing. By successfully imple-
menting dimensionality reduction strategies, the work
demonstrated the capability to accelerate data pro-
cessing significantly, offering practical advantages in
real-world applications, where time and resource con-
straints are critical.
Additionally, this work formalized a synthetic
data generation model, a valuable contribution in the
realm of data analytics and machine learning. The
introduction of a formalized synthetic data generation
model not only aids in testing and validating data pro-
cessing pipelines but also plays a crucial role in ensur-
ing data privacy and security.
Collectively, these contributions underline the pa-
per’s significance in advancing the field of mining
user patterns from data generated by smart devices,
offering innovative solutions to the challenges posed
by contemporary data-driven environments.
As we conclude this study, it’s worth noting that
there are several promising directions for future re-
search. Firstly, we intend to expand upon our current
work by generating and exploring more complex data
scenarios to assess the robustness and adaptability of
the proposed methodology. These complex scenarios
may include situations with intricate data interdepen-
dencies, extreme outliers, or highly skewed distribu-
tions, allowing us to further refine and validate our
data processing techniques.
Additionally, there is room for exploration in the
realm of algorithm selection for wavelet transforma-
tion. While our study has utilized a specific set of al-
gorithms for wavelet transformation, future research
could investigate alternative algorithms to determine
if there are more suitable options that enhance the pro-
cessing pipeline’s performance and accuracy.
By delving into these future research avenues, we
aim to continually refine and expand upon the insights
and methodologies presented in this paper, contribut-
ing to the ongoing advancement of mining usage pat-
terns from data generated by smart devices.
REFERENCES
Aljawarneh, S., Radhakrishna, V., Kumar, P. V., and Janaki,
V. (2016). A similarity measure for temporal pat-
tern discovery in time series data generated by iot. In
2016 International conference on engineering & MIS
(ICEMIS), pages 1–4. IEEE.
Bishop, C. M. (1995). Neural networks for pattern recog-
nition. Oxford university press.
Brigham, E. O. and Morrow, R. E. (1967). The fast fourier
transform. IEEE Spectrum, 4(12):63–70.
Chira, C.-M., Portase, R., Tolas, R., Lemnaru, C., and Po-
tolea, R. (2020). A system for managing and process-
ing industrial sensor data: Sms. In 2020 IEEE 16th In-
ternational Conference on Intelligent Computer Com-
munication and Processing (ICCP), pages 213–220.
Firte, C., Iamnitchi, L., Portase, R., Tolas, R., Potolea, R.,
Dinsoreanu, M., and Lemnaru, C. (2022). Knowl-
edge inference from home appliances data. In 2022
IEEE International Conference on Intelligent Com-
puter Communication and Processing (ICCP).
Karim, F., Majumdar, S., Darabi, H., and Harford, S.
(2019). Multivariate lstm-fcns for time series classifi-
cation. Neural networks, 116:237–245.
Lin, J., Williamson, S., Borne, K., and DeBarr, D. (2012).
Pattern recognition in time series. Advances in
Machine Learning and Data Mining for Astronomy,
1(617-645):3.
Lloret, J., Tomas, J., Canovas, A., and Parra, L. (2016). An
integrated iot architecture for smart metering. IEEE
Communications Magazine, 54(12):50–57.
Milillo, P., Sacco, G., Di Martire, D., and Hua, H. (2022).
Neural network pattern recognition experiments to-
ward a fully automatic detection of anomalies in insar
time series of surface deformation. Frontiers in Earth
Science, 9:728643.
Numpy (2022). Numpy. https://numpy.org/. [Online;
accessed 2-Jan-2022].
Olariu, E. M., Tolas, R., Portase, R., Dinsoreanu, M., and
Potolea, R. (2020). Modern approaches to preprocess-
ing industrial data. In 2020 IEEE 16th International
Conference on Intelligent Computer Communication
and Processing (ICCP), pages 221–226.
Pandas (2022). Pandas. https://pandas.pydata.org/. [Online;
accessed 2-Jan-2022].
Patro, K. K., Prakash, A. J., Samantray, S., Pławiak, J.,
Tadeusiewicz, R., and Pławiak, P. (2022). A hybrid
approach of a deep learning technique for real-time
ecg beat detection. International journal of applied
mathematics and computer science, 32(3).
P
´
ealat, C., Bouleux, G., and Cheutet, V. (2022). Improved
time series clustering based on new geometric frame-
works. Pattern Recognition, 124:108423.
Pedregosa, F., Varoquaux, G., Gramfort, A., Michel, V.,
Thirion, B., Grisel, O., Blondel, M., Prettenhofer,
P., Weiss, R., Dubourg, V., Vanderplas, J., Passos,
A., Cournapeau, D., Brucher, M., Perrot, M., and
Duchesnay, E. (2011). Scikit-learn: Machine learning
in Python. Journal of Machine Learning Research,
12:2825–2830.
IoTBDS 2024 - 9th International Conference on Internet of Things, Big Data and Security
60

Portase, R., Tolas, R., Lemnaru, C., and Potolea, R. (2023).
Prediction pipeline on time series data applied for
usage prediction on household devices. In eKNOW
2023, The Fifteenth International Conference on In-
formation, Process, and Knowledge Management.
Portase, R., Tolas, R., and Potolea, R. (2021). MEDIS:
analysis methodology for data with multiple complex-
ities. In Cucchiara, R., Fred, A. L. N., and Filipe,
J., editors, Proceedings of the 13th International Joint
Conference on Knowledge Discovery, Knowledge En-
gineering and Knowledge Management, IC3K 2021,
Volume 1: KDIR, Online Streaming, October 25-27,
2021, pages 191–198. SCITEPRESS.
Rodr
´
ıguez Fern
´
andez, M., Cort
´
es Garc
´
ıa, A.,
Gonz
´
alez Alonso, I., and Zalama Casanova, E.
(2016). Using the big data generated by the smart
home to improve energy efficiency management.
Energy Efficiency, 9:249–260.
Tolas, R., Portase, R., Dinsoreanu, M., and Potolea, R.
(2023). Mining user behavior: Inference of time-
boxed usage patterns from household generated data.
In eKNOW 2023, The Fifteenth International Confer-
ence on Information, Process, and Knowledge Man-
agement.
Tolas, R., Portase, R., Iosif, A., and Potolea, R. (2021). Pe-
riodicity detection algorithm and applications on iot
data. In 2021 20th International Symposium on Paral-
lel and Distributed Computing (ISPDC), pages 81–88.
Advancements in Household Data Mining: Fine-Tuning of Usage Pattern Inference Pipeline
61
